Retail Sales Rise, Showing Resilient U.S. Consumers Retail sales rose 0.7% as American consumers stepped up their spending in September, a sign of solid demand and rising inflation.
Sales at retail stores, restaurants and online sellers rose a seasonally adjusted 0.7% in September from the previous month, the Commerce Department said Friday. The rise in sales reflects persistently strong demand and higher consumer prices. (…)
The retail sales, which aren’t adjusted for inflation, rose 13.9% in September from a year earlier. Consumer inflation increased 5.4% in that time, according to the Labor Department. (…)
September spending on autos and auto parts rose 0.5% last month even though auto unit sales fell in September to a seasonally adjusted annual rate of 12.6 million from a recent peak of 18.8 million in April, according to a separate Commerce Department report. (…)
Spending at restaurants and bars was up 0.3% in September. Consumers also spent 1.8% more at gas stations, and 3.7% more at sporting goods, music and book stores. (…)
Americans have kept their spending on goods (blue line) at a high (18.9% above February 2020) but stable level since March, using pandemic rescue money and savings given that labor income (black) is up only 6.0% during the same period.

But inflation is masking a weakening trend. Real retail sales (red line below), are up 12.3% from their pre-pandemic level, but are are down 3.0% (-6.1% annualized) since March. Note also that real Weekly Payrolls (black) are merely back to their February 2020 level after inflation eroded 6% in purchasing power.

The bar chart below decomposes the trend in Payrolls during the last 4 quarters. It illustrates the Fed’s challenge to grow employment enough to offset the not so transitory inflation in order to keep the consumer economy humming. The bars are QoQ growth rates. During 2021, quarterly employment growth (black) has accelerated from 0.5% to 1.5% but reduced hours (blue) and declining real hourly wages (red). In Q2, 92% of the gain in real wage rates was taken away by reduced hours and rising prices. In Q3, only 62% of the growth in employment remained after reduced hours and rising prices.

Now look at the monthly trends in employment during the last 12 months. We should all be worried and hope that the slowdown in last 2 months were mainly Covid-19 related.

The good news is that the damages from the Delta variant are receding and recent weekly trends in unemployment claims are encouraging. The not so good news is that pandemic rescue payments have now stopped and people must now rely on their take-home-pay or their savings during the all-important holiday season. This while prices of essentials such as food (+10.0% a.r. in the last 4 months) , energy (+21%) and rent (+3.6% “officially”) are a real burden for most households.

The WSJ reports that “retail spending in the first week of October was up 8.8% compared with the average week in September, according to data from Earnest Research, which tracks credit- and debit-card purchases.” Chase’s Card Spending Tracker is also up nicely through October 11, forecasting a 1.3% MoM gain in October control sales following a 0.8% rise in September.

Given the well publicized on-going shortages on many goods, it is likely that Christmas will come early for retailers. But watch for weaker trends by December and into 2022. Hopefully, reduced demand will ease inflation on most goods but prices of essentials and services seem set to hurt consumers in 2022.
Nordea raises a yellow flag:
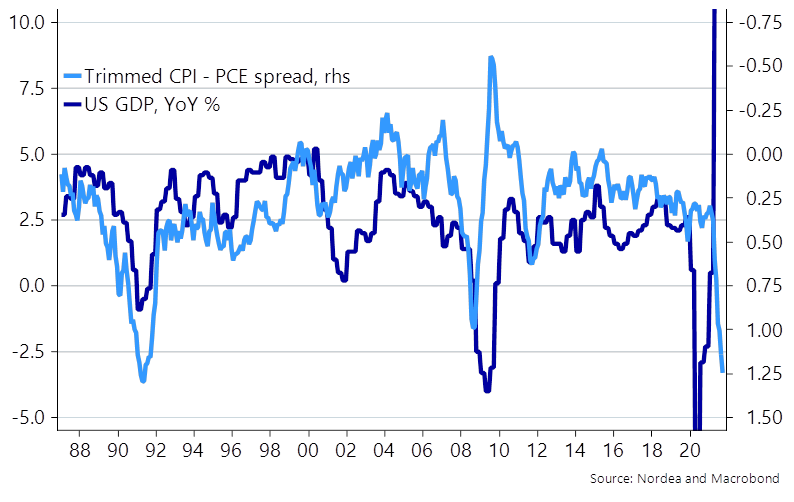
(…) CPI-weights are updated substantially less frequently than PCE-weights, why the CPI may underestimate the behavioural effects from rising prices currently. Will consumers substitute certain goods in the basket after a rapid price increase or maybe just outright decrease spending? If the latter is the real reason why CPI-PCE spreads have widened materially, then it may be a really bad signal for growth in 2022.
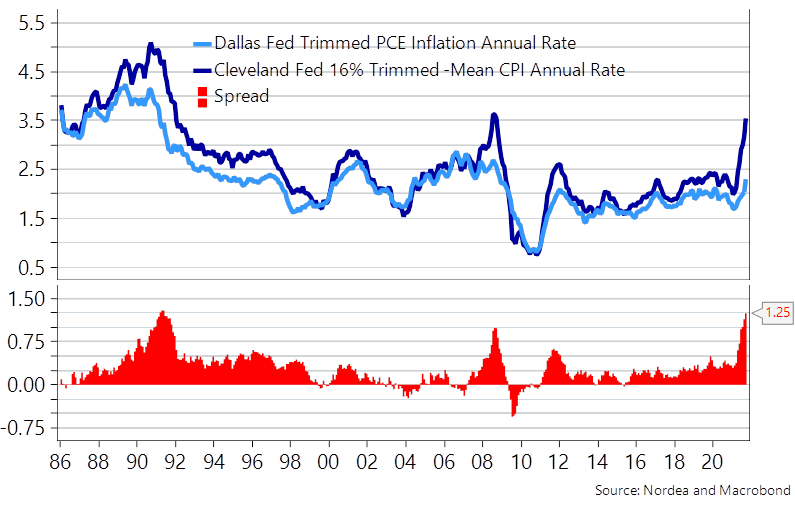
Spreads between CPI and PCE prices have widened to historical highs. A bad sign?
In any case, we remain on watch for 2022 growth since continued high inflation paired with weakening trends in forward-looking indicators is obviously something to worry about. When spreads between trimmed CPI and PCE prices are as elevated as currently, then we have usually been in the middle of a recession already. We most likely aren’t, but there is a clear risk that consumers and manufacturing companies will start behaving differently due to the recent surge in (energy) prices.
With spreads as wide as now between CPI and PCE prices, we have usually been in a recession
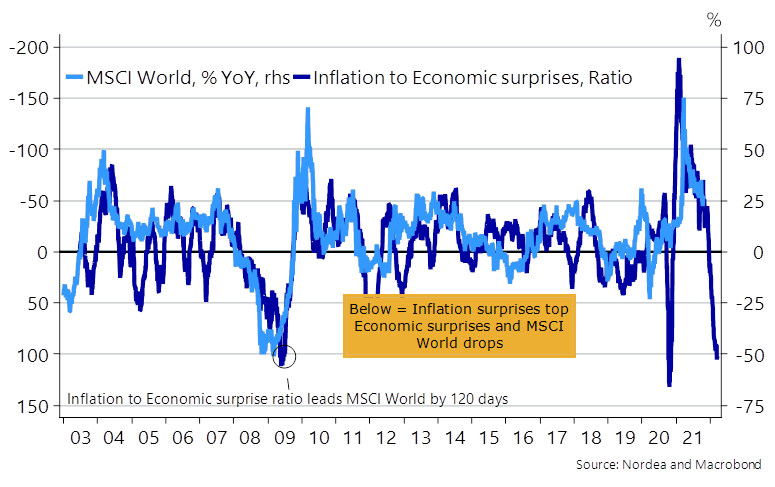
In any case, it can’t be construed as good news that inflation keeps surprising on the upside, while growth prospects keep surprising on the downside. We have basically never seen a material correction in equities with the current amount of monthly support from central bank QE, but if the Fed, BoE and maybe partly the ECB are convinced to take the foot off the pedal due to inflation, then it may be another discussion already during H1-2022.
A Santa Rally in equities is likely (due to oversold conditions and continued QE), but 2022 prospects are muddy as the current strike price of the central bank put is not necessarily going to survive an inflationary regime-shift.
If stagflation fears are as warranted as economic surprise indices hint, then buckle up in 2022
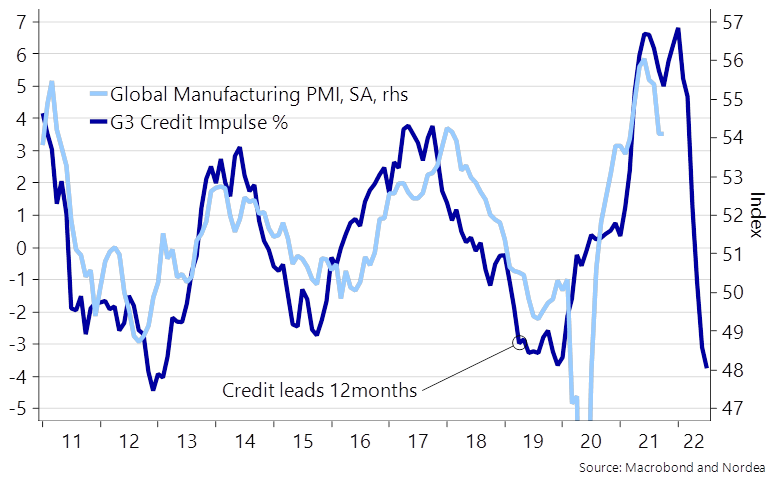
Input prices have been materially on the rise, which will add to an already bleak picture for the cyclical parts of the economy in to 2022. Global manufacturing looks set to slow, if the usual lead/lag patterns related to the global credit impulse hold true again and we are yet to receive new potentially worse credit numbers post the recent energy price squeeze. (…)
A clear manufacturing slowdown in 2022 on the cards?
Does this mean that global stagflation fears are warranted? We find (at least) one missing piece in the stagflation puzzle – namely labour markets. All indicators still look sound and job openings are extremely plentiful compared to the number of unemployed. The latter is driven by a combination of a strong comeback for demand paired with a continued surprisingly weak labour market supply.
Boomers who have enjoyed the asset-QE ride, will likely never return to the labour-force or else at least insist to work only from the cottage house in Toscana. Vaccine mandates have likely also limited labour market supply to a surprisingly large extent (The mandates surely cannot increase labour market supply at least). These developments speak in favour of a tight labour market development over the coming quarters. This doesn’t sound overly stagflationary to us, but consumers simply need a substantial pay rise by now to keep confidence elevated as the purchasing power will be otherwise be eradicated too swiftly.
Consumers in Europe and the U.S. aren’t rushing to spend more than $2.7 trillion in savings socked away during the pandemic, dashing hopes for a consumption-fueled boost to economic growth on both sides of the Atlantic.
In the wake of lockdown easing during the northern hemisphere’s summer holiday season, excess savings in euro-area bank balances declined only marginally in August, and Italy still recorded an increase, according to calculations by Bloomberg Economics. In the U.S. there has also been no drawdown, the figures show. (…)
Bloomberg Economics calculates the total of excess savings built up since the crisis began at about $2.3 trillion in the U.S. and almost 400 billion euros ($464 billion) in the euro zone.
Source: BEA, Bloomberg Economics


- Why Buying a Second or Even Third Home Is Becoming More Popular Than Ever Low interest rates, pandemic-era savings and a hybrid-work revolution are making it more feasible for people to split their time.
(…) That fundamental change in where and how people live stands to infuse second-home markets, once reliant on weekenders and seasonal visitors, with greater demand for restaurants, retail and other amenities that make urban dwelling so appealing. (…)
Already, about 19% of respondents in Knight Frank’s 2021 Global Buyer Survey said they moved since the start of the pandemic. And there may be more to come: 33% of respondents said they were more likely to buy a second home as a result of the pandemic, up from 26% the prior year. (…)
Cibelli said she has “two of everything” for her kids and herself — clothes, toiletries. (…)
Demand for apartments has increased globally in 2021, according to Knight Frank, as people look for larger places and pieds-à-terre to use as mid-week bases: 19% of survey respondents said they wanted to buy apartments this year, up from 12% last year. And of those looking to move within the next year, the most at 38% are looking at cities. (…)

Supply-Chain Bottlenecks, Elevated Inflation to Last Well Into Next Year, Survey Finds Economists see supply constraints, labor shortages as bigger risks to economy than Covid-19, WSJ survey finds
Economists on average see inflation at 5.25% in December, just slightly less than the rate that has prevailed since June. Assuming a similar level in October and November, that would mark the longest inflation has been above 5% since early 1991. (…)
Consumer-price inflation will drop to 3.4% by June of next year, then 2.6% by the end of 2022, according to respondents’ average estimates. That is still above the average 1.8% that prevailed in the decade before the pandemic.
Economists slashed growth forecasts this year, to an average 3.1% annualized in the third quarter from 7% in the July survey. They also lowered projected fourth-quarter growth to 4.8% from 5.4%. (…)
Some 45% estimate that it will take until the second half of 2022 for bottlenecks to have mostly receded, compared with two-fifths expecting major improvement before then.
Concerns about Covid-19 have receded. It was flagged by just 8.2% of respondents as the main risk to growth. (…)
Nearly three in five economists surveyed see the Fed raising rates by the end of next year, including 16% who see the first increase happening by the Fed’s June meeting. (…)
- OPEC+ Once Again Fails to Pump Enough to Meet Its Output Target OPEC+ cut its production 15% deeper than planned in September, compared with 16% in August and 9% in July, according to delegates with knowledge of the matter. This reflects the inability of some members — including Angola, Nigeria and Azerbaijan — to raise output to agreed volumes due to a lack of investment, exploration and other issues. In theory, OPEC+ could have pumped an extra 747,000 barrels a day in September and remained within its agreed production limit.
On the latest Bloomber’s Odd Lots Joe Weisenthal spoke with Goldman’s top commodity strategist Jeff Currie:
Yeah, it’s far more bullish than, you know, we could have ever envisioned. Let’s take oil. The deficit that we can measure at the end of last month was running somewhere around 4.5 million barrels per day. That’s nearly 5% of the market is in a deficit. That is such a large hole that OPEC, the U.S. administration… nobody’s going to fix this. This is like, you know, the train is off the track and you’re watching it in slow motion.
But it’s not just oil. Uh, you see it in copper — copper inventories dropping 8%, 10% week after week. These are numbers I have never envisioned or never seen before. You know, and you can think about what is going on here. And I think, you know, it goes back to Tracy’s point about that zinc smelter shutting down in Europe, that problems in one market create problems in the other.
So we think about first it was coal in China, then it being gas in Europe. Then it became aluminum in China, which then impacts copper elsewhere in the world. And it keeps this chain reaction going in each one of these markets get tighter and tighter. So what is it about oil that makes this deficit so much larger than we could have ever envisioned… because you now have oil being used in lieu of both coal and gas because of the shortages in those markets. So bottom line is, you know, we see a lot of upside risk from these price levels, which are far greater than the price levels. We were forecasting when we spoke nine months ago. So bottom line, the underlying picture is far more bullish than what we had expected nine months ago, but the drivers of it are pretty much in line exactly what we thought just in a much larger degree than what we thought.
Inflation Sets Off Alarms Around the World More than a dozen central banks have raised interest rates but two that haven’t are those that loom largest over the global economy: the Federal Reserve and the European Central Bank.
(…) Of the 38 central banks tracked by the Bank for International Settlements, 13 have raised their key rate at least once. In October, the central banks of New Zealand, Poland and Romania increased borrowing costs for the first time since the pandemic struck. Singapore, which tightens policy by nudging its exchange rate higher, joined that group Thursday.
For all central bankers, the big worry is that inflation becomes embedded as households start to factor expectations that faster inflation is here to stay into wage bargaining and businesses make the same assumption as they set prices. Where memories of high rates of inflation are fresher than they are in the U.S. and Western Europe, that is a greater risk. (…)
Almost every country in South America has been through a period of very high inflation in living memory, and prices are again surging there following a decline in new coronavirus infections. Without increases in wages to match, many households are in financial peril.
Like Chile, Colombia and Peru are also seeing rising prices after years of controlling inflation. That has prompted central banks in both countries to tighten their monetary policy as households struggle to make ends meet. (…)
In some countries, the risk of a wage and price spiral is greater because there are few workers who can be recruited to help meet rising demand. (…) “Central and Eastern Europe is one of the regions of the world where we think that the risk of sustained higher inflation in the next few years is greatest,” said Liam Peach, an economist at Capital Economics. (…)
And, importantly, this weekend: Bank of England will have to act to contain inflation – Bailey
(…) Bailey said he continued to believe that the recent jump in inflation would be temporary, but that a surge in energy prices would push it higher and make its climb last longer, raising the risk of higher inflation expectations.
“Monetary policy cannot solve supply-side problems – but it will have to act and must do so if we see a risk, particularly to medium-term inflation and to medium-term inflation expectations,” Bailey said during an online panel discussion organised by the Group of 30 consultative group.
“And that’s why we at the Bank of England have signalled, and this is another such signal, that we will have to act,” he said. “But of course that action comes in our monetary policy meetings.” (…)
Bailey said demand for workers in Britain had been stronger than expected and the number of younger and older workers leaving the labour market had grown.
“I do have concerns about labour supply growth,” he said.
But Bailey said he did not believe there was a “general pattern of labour market pressure” as wages climbed strongly in some sectors but less so in others. (…)
- “Inflation is clearly not temporary…The Fed is starting to indicate it’s time for them to move” – Bank of America (BAC) CEO Brian Moynihan
- “Inflationary trends are appearing more than transitory, reflecting structural changes, including a shift from consumerism to job creation, rising wage growth, and the energy transition.” – BlackRock (BLK) CEO Laurence Fink
- “It’s not transitory. I’ve never seen a greater divergence between what’s defined as transitory and what’s being seen day in and day out. Most CEOs I talk to today are very concerned about supply chain, very concerned about import costs, whether they’re materials, commodities and increasingly labor” – Goldman Sachs (GS) President John Waldron
- “We do expect the Federal Reserve will begin tapering soon, and that will be followed by increasing rates in 2022–You’ve got to prick this bubble a little bit. Money is a bit too free and available right now–I think the market has digested that the Fed will have to move, not just on tapering, but rate increases. And by the way, we are 10 rate increases away from what would be considered normal.” – Morgan Stanley (MS) CEO James Gorman (Check)
- “…if you look at what’s happening in inflation and with tapering coming and we still think that there’s more risk to upside on rates than there is downside at this point.” – Wells Fargo & Company (WFC) CFO Michael Santomassimo
America’s Workers Are Leaving Jobs in Record Numbers U.S. workers handed in nearly 20 million resignations this spring and summer, according to the latest federal data.
U.S. workers left their jobs nearly 20 million times between April and August this year, according to the latest federal data, a number more than 60% higher than the resignations handed in during the same period last year, and 12% above the spring and summer of 2019 when the job market was the hottest it had been in almost 50 years. The data doesn’t count retirements but includes people who have quit jobs for any number of reasons, such as taking a job elsewhere, going back to school, leaving to care of a family member or simply taking a break. The data also includes people who may have quit multiple times, for instance leaving a job on a college campus in May and then quitting a summer job in August.
Additional data from the Bureau of Labor Statistics shows a steady rise in the employed-to-employed rate, indicating that many people are switching jobs, not sitting on the sidelines. (…)
In August, a seasonally adjusted 4.3 million resignations were handed in, according to the Bureau of Labor Statistics. Though August is a traditionally high turnover month, in part because many teens and 20-somethings leave jobs to go back to school, the figure sets a record since the BLS started tracking it in 2000.
The sheer number of quits helps explain why so many employers are struggling to fill hiring gaps, said Danny Nelms, president of the Work Institute, a consulting firm that conducts 40,000 exit interviews each year for companies. At the same time, many workers have a rare edge: Jobs are plentiful, wages are rising and companies are competing for talent, he said. (…)
Certain industries are churning more workers than others. People left healthcare, retail and food services at especially high rates at the end of the summer. Workers also left jobs at an accelerating pace across the Midwest and South. Texas and Florida have a high concentration of the industries seeing the greatest churn, including travel and hospitality. (…)
Workers between 40 and 50 years old, who are typically less likely to quit their jobs than younger employees, also quit in higher numbers this year, increasing their resignation rates by over 38%, the study found. (…)
A March analysis by Gallup found that 48% of the U.S. working population surveyed was actively job searching or watching for opportunities. The survey included workers in every job category, from hourly consumer-facing roles to high-paid professional positions, who were hunting at roughly the same rates. (…)
China’s Economy Slowed Sharply in the Third Quarter China’s economy grew 4.9% in the third quarter from a year earlier, as power shortages and supply-chain problems added to the impact from Beijing’s efforts to rein in the real estate and technology sectors.
(…) When compared with the second quarter, China’s GDP inched up just 0.2% in the three months ended Sept. 30, according to data released Monday by the National Bureau of Statistics. In the second quarter, China’s GDP rose 1.3% from the prior quarter. (…)
For the first nine months of the year, China’s GDP expanded 9.8% compared with a year earlier, the statistics bureau said. (…)
China was the only major global economy to grow during last year’s pandemic-induced slowdown; its economy expanded 2.3%. (…)
On Friday, China central bank officials suggested it wouldn’t resort to a relatively large stimulus to drive up the growth rate in the final quarter of the year, for example by flooding the financial system with liquidity or slashing benchmark interest rates. (…)
In a reflection of the worries around China’s property market, which has traditionally been a key growth driver for the broader economy, new construction starts as measured by contracted floor area fell 4.5% in the first nine months of the year, widening from a 3.2% decline recorded in the January-to-August period, according to official data released Monday. (…)
Industrial output, a measure of factory production, rose just 3.1% in September from a year earlier, the statistics bureau said Monday, slowing from August’s 5.3% year-over-year growth pace and falling short of economists’ expectation for a 3.8% expansion. (…)
Fixed-asset investment also fell short of expectations, increasing 7.3% in the first three quarters of the year, the statistics bureau said—a slowdown from the 8.9% growth pace recorded in the January-to-August period. Economists had expected investment to rise by 7.9% for the first nine months of the year.
On the plus side, retail sales, a key gauge of domestic consumption, rose 4.4% in September from a year earlier, rebounding from August’s lackluster 2.5% year-over-year increase and topping the 3.4% rate expected by economists. (…)
 (
(- China’s President Xi Jinping called on Friday for the nation to “vigorously and steadily advance” legislation for a property tax, which could curb rampant speculation, according to an essay in the ruling Communist Party journal Qiushi. (Reuters)
EARNINGS WATCH
From Refinitiv/IBES:
Through Oct. 15, 41 companies in the S&P 500 Index have reported earnings for Q3 2021. Of these companies, 82.9% reported earnings above analyst expectations and 14.6% reported earnings below analyst expectations. In a typical quarter (since 1994), 66% of companies beat estimates and 20% miss estimates. Over the past four quarters, 85% of companies beat the estimates and 12% missed estimates.
In aggregate, companies are reporting earnings that are 15.6% above estimates, which compares to a long-term (since 1994) average surprise factor of 4.0% and the average surprise factor over the prior four quarters of 18.3%.
Of these companies, 87.8% reported revenue above analyst expectations and 12.2% reported revenue below analyst expectations. In a typical quarter (since 2002), 61% of companies beat estimates and 39% miss estimates. Over the past four quarters, 79% of companies beat the estimates and 21% missed estimates.
In aggregate, companies are reporting revenues that are 2.8% above estimates, which compares to a long-term (since 2002) average surprise factor of 1.2% and the average surprise factor over the prior four quarters of 4.1%.
The estimated earnings growth rate for the S&P 500 for 21Q3 is 32.0% [it was 29.4% on Oct. 1]. If the energy sector is excluded, the growth rate declines to 24.8%.
The estimated earnings growth rate for the S&P 500 for 21Q4 is 22.3% [21.7% on Oct. 1]. If the energy sector is excluded, the growth rate declines to 15.9%.
The estimated revenue growth rate for the S&P 500 for 21Q3 is 14.1%. If the energy sector is excluded, the growth rate declines to 11.5%.
Trailing EPS are now $193.61. Full year 2021: $201.36e. 2022: $220.77e.
Earnings revisions have not turned positive overall:


Demand strength surprised widely as BlackRock illustrates. Rescue money, reopening, job security, shortages all combined to a favorable base effect to boost revenues well beyond expectations.
Beating by a historically wide margin
Average revenue surprise, 2003-2021
Source: BlackRock Fundamental Equities, with data from FactSet, as of Aug. 31, 2021. Chart shows the average revenue surprise among S&P 500 companies relative to consensus analyst estimates, calculated as a z-score, a numeric representation of the distance from the mean.
That cannot last. If it does for a little longer, inflation will force Fed interventions.
TECHNICALS WATCH
Last week’s action, though positive and encouraging, does not eliminate six months of degradation in most indicators, particularly in smaller caps where the 200dma is hanging in.

The S&P 500 13/34–Week EMA trend weakened last week.

At various points this year, the majority of stocks have trailed the major indexes. Sometimes, there was a wide divergence between what the average stock was doing versus, say, the S&P 500. Historically, that has preceded declines in the indexes, but 2021 has thrown a whole host of historical markers out the window.
Even so, the internal weakness was enough so that when the S&P actually did start to struggle over a month ago, some of its breadth metrics really struggled. The rally at the tail end of last week started to change that; the McClellan Oscillator for the S&P 500 has turned positive for the first time in a month.
The extended run below zero in the Oscillator caused the longer-term Summation Index to plunge, and it recently dived below its zero line for the first time in well over a year. The worst possible scenario for an index or sector is when its Summation Index is negative and declining – that’s when the ugliest selloffs tend to occur.

EV SALES
From McKinsey:
(…) Despite an overall slump in car sales worldwide, 2020 was a banner year for electric-vehicle sales, with global sales actually exceeding prepandemic levels by the third quarter of the year. Incredibly, Europe and China achieved fourth-quarter sales increases of 60 percent and 80 percent, respectively, over the previous quarter, helping to drive global EV penetration to an all-time high of 6 percent. While the United States lags behind the two other regions, EV sales increased nearly 200 percent between the second quarter 2020 and the second quarter 2021, contributing to a domestic penetration rate of 3.6 percent during the pandemic.
(…) California, where light-duty electric-vehicle registrations shot up to 425,300 in 2020, representing about 42 percent of EV registrations in the entire country, according to the US Department of Energy’s Alternative Fuels Data Center. That’s more than seven times the rate of registrations for Florida, the state with the second-highest number of EVs registered. (…)
In our most likely EV-adoption scenario, EV sales would make up about 53 percent of all passenger-car sales by 2030. However, gas-powered vehicles will continue to be by far the most common car on the road through 2030. (…)

Goldman Sachs Cleared to Own All of China Unit Chinese regulators approved Goldman’s application to take full ownership of a key local unit, another step in China’s gradual opening of its financial system to major players from the U.S. and elsewhere.
STUMBLED UPON:
Bridging the gap between companies and stakeholders. Quartr allows you access to conference calls, investor presentations, transcripts, and earnings reports straight from your iOS and Android devices. Quartr is available for free and covers companies from 15+ markets including the US, UK, Canada, India, and all the Scandinavian countries.


