HAPPY HOLIDAYS!
The Daily Edge will be published sporadically in the next 2 weeks.
A special thank you to donators who help support this blog. Very, very much appreciated.
Apologies if have not sent a personalized thank you note like I normally do. The recent weeks/months have been particularly busy for me.
Spending Was Strong Heading Into Omicron, and Will Be After A shift in spending toward services—and away from goods—last month hints at what next year might look like
The Commerce Department on Thursday reported that consumer spending rose a seasonally adjusted 0.6% in November from October and also revised its October spending figures higher. (…)
Digging into the data a little more, the increase in spending was driven by a 0.9% increase in services expenditures. Spending on goods rose just 0.1%. And that is before the bite from inflation, which has been concentrated in goods. Adjusted for inflation, spending on services rose 0.5%, but spending on goods fell 0.8%.
(…) a fair amount of holiday spending looks as if it was pulled into October, since people were worried that supply-chain snarls might mean they wouldn’t get their gifts on time (a concern that retailers encouraged). (…)
Credit and bank card data from both Bank of America and JPMorgan Chase indicate that spending has weakened this month, particularly in services-related categories such as airlines and restaurants — and of course one might have gathered as much from reading the news or walking around. (…)
In [Omicron surge’s] aftermath, the spending dynamics that were in place last month might well reassert themselves. Next year could be when demand for services really drives spending, and demand for goods moves to the passenger seat.
The BEA’s Table 5 provides the important income/spending stats:

- Wages and Salaries (#3) slowed a little in November (+0.5%) but growth this year is huge. Last 4 months: +7.7% a.r. (total comp (#2): +6.8% a.r.).
- The problem is inflation. Real personal income ex. transfers (#19) has totally stalled since July.
- Real disposable income (#20) has declined in each of the last 4 months and is up only 2.0% from its pre-pandemic levels, 21 months ago.
- Real expenditures are up 4.4% since February 2020 but abruptly stalled in November after jumping 0.7% in October. The decline in the savings rate to 6.9%, its lowest level since December 2017, helped sustain consumption in spite of declining disposable income.

Since 1969, there is a pretty good +0.68 correlation between core CPI and the savings rate, which would suggest a higher savings rate in 2022, at least during the first half when most forecasters expect inflation to peak. But who really knows? Americans had displayed a somewhat higher propensity to save since 2013 but the pandemic could have changed that trend.
The savings rate is the erratic and elusive wild card. Forecasting higher consumer spending based on possible dissaving is dangerous, particularly when inflation is rising.
U.S Savings Rate And Core CPI 1969-2019
Real expenditures on goods peaked in March but are still 16.2% above their pre-pandemic level, and about 10% above trend. Meanwhile, consumption of services is about 3% below trend but has been growing at an 8.0% annualized rate in 2021 from a depressed base, four times faster than its pre-pandemic trend growth rate.

Demand for services will likely keep growing in 2022 but whether it can offset a return to trend in goods will require Americans really step up using some services. In total, services account for 64% of total expenditures but services such as shelter and medical services account for nearly 2/3rd of the total.
Discretionary services on which one could splurge (e.g. restaurants, hotels, travels, recreation) account for no more than 15% of total spending and have limitations that goods don’t have (number of restaurant meals, travels, etc. per week, month, year).
Spending on services as a percent of disposable income is almost back to its long-term declining trend while the proportion of income spent on goods is 4% above trend:

Meanwhile, inflation on services is steady at between 4% and 5% annualized but the official measure of inflation on the heavy-weight shelter is still relatively subdued at 3.8% YoY in November but is dangerously accelerating (+6.2% a.r. in the last 2 months). Real world data suggest actual rent inflation is much higher.
As often shown in the Daily Edge, CPI-Essentials is now 7.0% YoY and has risen at a 12% annualized rate in the last 2 months.
The impact on real income is significant. The impact on discretionary income and spending is even more significant for most Americans.
CPI-Essentials And Private Wages
- Producers Expect Food Prices to Rise in New Year Many food manufacturers say they plan to raise prices in 2022 for a range of products from macaroni-and-cheese to snacks, the latest sign that consumers will continue to face higher costs at the supermarket.
(…) Food prices are estimated to rise 5% in the first half of 2022, according to research firm IRI, though the level of increases will vary by grocers and regions.
Mondelez International Inc. MDLZ 0.17% said recently that it was raising prices across cookies, candy and other products sold in the U.S. by 6% to 7% starting in January. General Mills Inc. GIS 0.44% and Campbell Soup Co. CPB -0.02% said their price increases also would take effect in January. Kraft Heinz Co. KHC 0.40% told retailer customers that it would raise prices across many of its products including Jell-O pudding and Grey Poupon mustard, with some items going up as much as 20%, according to a memo viewed by The Wall Street Journal. (…)
Kraft Heinz said the average price increase on its products will be 5%, adding that it wasn’t passing all of its cost increases to customers. Production costs of Grey Poupon rose 22%, and the company is raising it by 6% to 13% for customers, the company said. (…)
Holiday Sales Jump 8.5% as U.S. Consumers Return to Retailers U.S. holiday sales jumped 8.5% from last year as consumers spent more money on clothes, jewelry and electronics, a report from Mastercard SpendingPulse showed. Sales grew across the board, both in stores and online, for the holiday season defined as Nov. 1 to Dec. 24.
![]() But note the period: Nov. 1 to Dec. 24. Retail sales were up 16.1% YoY in November. Control sales were up 13.6%. Seems December was rather weak…
But note the period: Nov. 1 to Dec. 24. Retail sales were up 16.1% YoY in November. Control sales were up 13.6%. Seems December was rather weak…
The Chase card spending tracker, updated through Dec. 14, suggests sales peaked at Thanksgiving:

Omicron Starts to Slow U.S. Economy as Consumer Spending Flags Fewer people are dining in restaurants, and rising case numbers are leading many businesses to close for a short period.
The number of diners seated at restaurants nationwide was down 15% in the week ended Dec. 22 from the same period in 2019, a steeper decline than in late November, data from reservations site OpenTable show. U.S. hotel occupancy was at 53.8% for the week ended Dec. 18, slightly below the previous week’s level, according to STR, a global hospitality data and analytics company. (…)
In the 10 days through Dec. 22, the number of travelers passing through Transportation Security Administration checkpoints was more than double the number of passengers flying in the same period of 2020, though still below 2019 levels. (…)
The forecasting-firm Oxford Economics now expects U.S. gross domestic product to grow at a 2.5% annual rate in the first quarter, down from a previous estimate of 3.4% growth. (…)
The Return of the Wage COLA Kellogg workers are the latest to demand inflation insurance.
By the WSJ Editorial Board
(…) The latest sign that Americans think inflation will be more than transitory is the labor agreement struck at Kellogg Co. Production workers for the cereal giant spent almost three months on strike before accepting a deal Tuesday night. (…)
One provision is a five-year moratorium on closing plants. Kellogg will also accelerate the path for newer employees to earn senior wages and benefits.
But when it comes to their base pay, workers chose a deal that offers more in inflation insurance than immediate gains. They’ll get no across-the-board raise after the first year of the contract. But Kellogg will provide a periodic COLA, granting up to $3 an hour in additional pay by 2026. Kellogg workers are following the successful quarterly COLA demands of Deere & Co. employees after they went on strike this fall.
(…) COLAs also force companies to pay for economy-wide price increases even if their own sales haven’t kept up. (…)
Unions like those at Kellogg and Deere represent a small share of overall employment in the private economy. But they represent more than one-third of the public workforce, and watch for their demands in the coming year. If public union wage demands rise, including COLAs, city and state budgets will be under pressure.
(…) the Kellogg contract is another sign that the 2021 inflation surge will have damaging economic consequences.
- Amazon, NLRB Reach Accord on Organizing The agreement with the National Labor Relations Board comes as some Amazon workers push for unionization. Amazon will notify warehouse staff of their rights to organize in its buildings.
(…) The agreement is significant because of Amazon’s size and because the company agreed to do away with a rule that limited how employees could communicate with each other at its facilities outside of work hours, said Risa L. Lieberwitz, a professor of labor and employment law at Cornell University. That had made it difficult for workers to organize, she said.
“This can give an enormous boost to organizing at Amazon and at other large employers in the United States,” she said.
The NLRB settlement is one of a number of steps the Biden administration has taken to show its support for the U.S. labor movement. The president reiterated his pro-union views a few weeks ago at an event promoting his $1 trillion infrastructure plan, and he has previously voiced support for Amazon workers seeking to unionize. (…)
More than 70% of Amazon warehouse workers in Bessemer, Ala., who voted in a union election earlier this year decided not to unionize, a margin that illustrates the challenge workers at Amazon will face nationally, labor experts have said.
That election is set to be held again after a federal labor official in November ruled that Amazon violated labor law during the first vote due to a mailbox it had installed outside of the Alabama facility. Amazon has denied any wrongdoing and said the decisive margin of victory was a vindication of its labor practices. (…)
U.S. Durable Goods Orders Up Sharply in November
Manufacturers’ new orders for durable goods rose 2.5% m/m (15.7% y/y) in November versus and upwardly revised 0.1% m/m gain in October (initially reported as a 0.5% m/m decline). The Action Economics Forecast Survey was expecting a 1.5% m/m increase.
The sharp November increase was led by a 6.5% m/m (19.4% y/y) rebound in transportation orders after having declined in three of the previous four months. Excluding transportation orders, the remainder rose 0.8% m/m (14.1% y/y), the ninth consecutive monthly increase. Orders for motor vehicles and parts increased 1.0% m/m on top of a 5.8% m/m jump in October. Orders for aircraft and parts surged 23.8% m/m in November after having declined in three of the previous four months. Orders for nondefense aircraft jumped 34.1% m/m while orders for defense aircraft rose a more modest 3.0% m/m. Across the other major sectors, orders for primary metals, fabricated metal products, and computers and electronic products rose in November while orders for machinery and electrical equipment fell. (…)
Also in the report are key readings on capital goods shipments and orders. The shipments figures provide a dependable reading on the course of business spending on equipment in the national accounts. Core (that is, excluding defense and aircraft) capital goods shipments increased 0.3% m/m (10.9% y/y) in November following a 0.4% gain in October. The October/November average is 6.4% annualized above the Q2 average, pointing to another quarter of solid business spending on equipment. Core capital goods orders slipped 0.1% m/m (12.8% y/y) in November, their first monthly decline in nine months. (…)

Capex are booming, up 21.4% from their pre-pandemic level and way above the last 3 cyclical peaks:

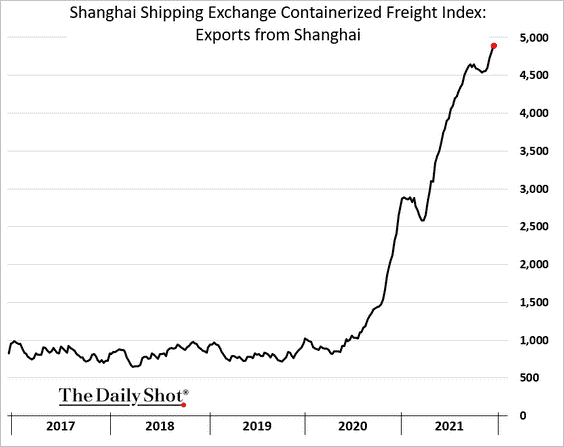
- Although there’s lots of talk of #supply disruptions easing container #freight rates in #China don’t seem to reflect any #slowdown. (Richard Bernstein)
Oil Prices Could Hit $100 By 2023 Despite Omicron Concerns
Oil at $100 a barrel was considered all but certain, until the Omicron variant struck. Goldman Sachs, however still thinks it’s a possibility in 2023. Rising oil prices has been driving inflation. But it works the other way too. Inflation has an effect on the value of the dollar, the currency in which oil contracts are priced. As it strengthens, thanks to Fed policy, $100 oil could come faster than expected.
From Bison Interest, a Houston based firm dedicated to energy investments:
The longer-term oil bull thesis remains intact. Producers continue to exhibit capital discipline, using the cash flow generated from higher market prices to buy back shares and pay dividends, rather than investing in exploration and drilling to sustain production. This is well illustrated in a recent chart from Credit Suisse:
The lack of investment in the sector has compounded for some time now, and it is becoming increasingly clear that future production will fall short of demand unless investment picks up materially. This is illustrated in a chart from JP Morgan, which implies much higher future oil prices:
Problematic policy will continue to contribute to projected energy deficits as world governments become increasingly hostile to the fossil-fuel industry, which ironically, coincides with the reduction in industry capital spending. World leaders and governments continue to reduce the industry’s ability to operate. In the US, the government has banned oil leases on federal lands and cancelled pipelines while simultaneously pushing for lower gasoline prices—policies which they insist are not causing higher energy prices. Our CIO Josh Young addressed this profound misunderstanding of basic market economics recently on Al Jazeera.
Shifting investor preferences are also driving the investment shortfall, as banks and investment funds continue restrict oil and gas producers’ access to capital. Consequently, the supply of credit available to E&Ps has been shrinking, resulting in a higher cost of capital and contributing to lower industry-wide investment, further exacerbating likely future under-supply:
You may not have heard this from muted news headlines in the US, but there is an ongoing energy crisis in Europe and Asia. It is likely the culmination of years of underinvestment in reliable energy sources, as a part of a poorly implemented energy transition. Global commodity prices continue to rise, fuelling price inflation as higher costs are passed along the value chain. The situation is especially bad in Europe, where natural gas prices have nearly quadrupled this year and are now sitting above $200 per barrel of oil equivalent, recently hitting a high of $270!
In addition to costing people more to heat and power their homes in the winter and disproportionately burdening the poorest people, higher energy prices have a negative spillover effect into other industries. For instance, higher gas prices are forcing ammonia factories—which convert gas into fertilizer used to grow crops—to shut down, driving food prices higher. Historically, food inflation has not reflected positively on the incumbent administration, and in some cases, has catalyzed revolutions such as the Arab Spring. As fuel and energy price subsidies roll out across Europe and elsewhere, prices may go even higher as demand destruction is averted through subsidies. Additionally, gasoline substitutes like fuel oil and diesel will be increasingly consumed, potentially forcing oil prices much higher from “surprise” demand.
Onshore stockpiles of crude oil and distillates continue to draw down amidst a backdrop of post-pandemic heightened demand, which in our view, increases the likelihood of an undersupplied market moving forward. We addressed this previously in “Oil Demand is Outweighing Supply”, and the situation has since worsened. Additionally, the OPEC+ has the stated their intention to get inventories back to their 2000—2014 average of 338 MM bbls, a period in which oil prices were ~$100/barrel:
A consequence of sustained underinvestment in oil exploration, production and critical infrastructure is that most oil-producing countries simply don’t have the spare capacity needed to ramp up production moving forward. As such, it is likely that oil prices will rise as the market shifts into a structural deficit. This deficit may persist due to non-economic reasons such as ESG-driven divestment and unfavourable regulations. Our early call on OPEC+ spare capacity being lower than advertised is rapidly becoming a widely adopted narrative, with the cartel having once again come short of its own targets in November.
The situation in the U.S, which supplies roughly a fifth of global oil supplies, is equally promising for higher prices. The inventory of drilled but uncompleted wells (DUC’s), which are a form of working capital for E&P’s and are necessary to maintain and grow production, is approaching dangerously low levels:
DUCs are a form of oilfield working capital. A producing shale oil well is brought online in two distinct phases, each requiring different specialized crews and equipment: The well is first drilled using a drilling rig, and is then stimulated to production, or “completed,” using a frac spread. A DUC is a well that has been drilled but has not yet been completed (thus the DUC acronym: Drilled Un-Completed). Therefore, when the rate of drilling outpaces completions DUC inventory rises—which has been the case for some time now—DUC inventory draws down.
Bison is currently performing an in-depth analysis of the DUC shortage and possible outcomes moving forward (more on this to come). At a high level, we surmise that the higher supply of frac spreads relative to drilling rigs is a major driver of DUC depletion:
Our preliminary calculations indicate that the U.S needs to add over 100 drilling rigs to keep the DUC count flat and sustain production at current levels or deliver moderate growth:
This is a material increase over the existing rig count, which currently sits at 560 as of November. This has meaningful implications for likely US production, as there is substantial lead time needed for rigs to be refurbished and/or re-activated, transported to the appropriate well pad and to then begin drilling. Additionally, severe labor and supply shortages may exacerbate the issue even if the equipment could otherwise be supplied on time. Ultimately, we anticipate that the rig count may not reach necessary levels for the reasons above, US production may continue to underwhelm expectations, and oil and gas prices will likely continue their climb higher.
Like many of the topics we address in our research, the potential impact on US production of the rapidly depleting inventory of DUCs is under appreciated.


TECHNICALS WATCH
First the sell side:
JPMorgan Says Investors Too Bearish, Doesn’t See Stock Selloff
There’s no reason to fear that the rally that catapulted U.S. stocks to successive records this year will end anytime soon, according to JPMorgan Chase & Co. strategists. In fact, more investors may soon join.
“Conditions for a large selloff are not in place right now given already low investor positioning, record buybacks, limited systematic amplifiers, and positive January seasonals,” the strategists led by Dubravko Lakos-Bujas wrote in a note to clients. “Investor positioning is too bearish — the market has taken the hawkish central bank and bearish omicron narratives too far.” (…)
For JPMorgan strategists, however, the “extreme stock dispersion and record concentration within equities” is an indicator of an abundance of caution, not a looming selloff. Investors have been treating mega caps as safe-havens, or “pseudo-bonds,” the strategists wrote.
If anything, the drawdown in smaller companies offers investors attractive entry points for “reopening stocks”, such as travel and hospitality, as well as energy and e-commerce, as inflation normalizes and concerns over the Fed’s hawkishness abate, the strategists said.
The bullish outlook echoes the one of Goldman Sachs Group Inc. strategists, who also said earlier this month that the narrowing rally doesn’t point to an imminent major drawdown.
“Rising concentration is not a reliable indicator for market peaks,” JPMorgan strategists said.
The buy side:
T Rowe Price chief warns of ‘free-form risk-taking’ in buoyant markets Bill Stromberg, head of $1.6tn fund group, sees increased speculation as stocks hit new records
The neutral side:
My favorite technical analysis firm says that the accumulated internal market damage will need time, and still missing sustained demand, to cure.
This NDR chart (via CMG Wealth) illustrates the weak demand/supply trend:

U.S. large cap indices remain in an uptrend, mainly carried by a few heavyweights. Callum Thomas shows the “Stealth Correction” — around a 3rd of the market is tracking below their respective 200-day moving averages.

Outside the USA, equities are struggling with all moving averages pointing down.

U.S. small caps are also struggling with unfriendly moving averages:

Satellite images show Russia still building up forces near Ukraine President Vladimir Putin said on Thursday that Russia wanted to avoid conflict, but needed an “immediate” response from the United States and its allies to its demands for security guarantees.
Santa shortage
Demand for professional Santas surged this season, but supply dwindled as many chose to retire or take the year off, Axios Local reporters found across the U.S. Many Santas fall into the high-risk category due to their age or weight. Hundreds have died since the beginning of the pandemic, many due to COVID-19, Slate reports.
Shortages may continue next season, with enrollment at “Santa schools” down and fewer St. Nicks entering the industry.


