![]() Note: I am travelling in Asia until April 24. Limited equipment and different time zones will limit the frequency and depth of my postings.
Note: I am travelling in Asia until April 24. Limited equipment and different time zones will limit the frequency and depth of my postings.
U.S. Services PMIs
S&P Global: Growth of activity sustained at end of first quarter
The seasonally adjusted S&P Global US Services PMI® Business Activity Index ticked down to a three-month low of 51.7 in March from 52.3 in February. That said, the index remained above the 50.0 no-change mark and therefore signalled a rise in business activity for the fourteenth consecutive month.
The rate of growth in new orders also eased in March, to a modest pace that was the slowest since last November. Growth of total new orders was restricted by a second consecutive monthly fall in new business from abroad. The reduction in new export orders was only slight, but the most pronounced since September last year.
Those firms that saw total new orders increase often reported that successful advertising campaigns had helped to boost client interest. Some respondents also indicated that their customers had been more willing to commit to new projects during the month.
Marketing activity is also expected to help generate gains in sales volumes during the year ahead, supporting confidence in the 12-month outlook for business activity. The prospect of improving economic conditions was also behind the positive outlook as 42% of respondents predicted an increase in activity over the coming year. Sentiment was slightly stronger than in February.
Softer growth of new orders meant that firms were able to work through outstanding business again in March. Backlogs of work have now decreased in eight of the past nine months. The latest fall was modest, but slightly faster than in the previous month.
Service providers continued to expand their staffing levels in response to higher new business volumes, the forty-fifth successive month of job creation. The latest increase was only slight, however, and the weakest since last November. Some companies indicated that cost considerations had led them to hold off on hiring.
In fact, higher wages were a key factor behind the latest increase in input costs, according to respondents. Panellists also reported rises in transportation and material prices. As a result, input costs increased sharply during the month, with the rate of inflation accelerating to a six-month high. The latest rise was also sharper than the series average as 23% of companies recorded inflation over the month.
In turn, the pace of output price inflation also quickened markedly from that seen in February to the fastest since July 2023 as companies passed higher input costs through to their customers. As with input prices, the rise in charges was also faster than the average since the survey began in 2009.
Looking at business trends across the combined manufacturing and service sectors, the S&P Global US Composite PMI Output Index registered 52.1 in March, down marginally from 52.5 in February but still pointing to a solid monthly increase in overall business activity. Manufacturing production rose at the fastest pace in almost two years, but growth of services activity waned.
New orders across both sectors combined increased modestly and at a softer pace than in February, with the rate of expansion in overall new business held back by a lack of growth in exports. New business from abroad was unchanged in March.
Employment continued to rise, helping firms to reduce their backlogs of work.
Rates of both input cost and output price inflation quickened, and were at six- and ten-month highs respectively. Sharper price rises were seen in both monitored sectors.
Finally, business confidence picked up from the previous survey period and was in line with the series average.
Chris Williamson, Chief Business Economist at S&P Global Market Intelligence, said:
“The US service sector reported a further rise in business activity in March, adding to signs that the economy enjoyed robust growth in the first quarter. Combined with an acceleration of growth in the manufacturing sector, the latest services PMI data point to GDP having risen at an approximate 2% annualized rate in the first three months of the year.
“Confidence in the outlook for the coming year has also lifted higher, which should help to sustain solid growth into the second quarter.
“The sustained upturn is being accompanied by renewed upward price pressures, however, with wage growth in particular driving costs higher. Rising raw material and fuel prices are also adding to cost burdens, which is in turn driving average selling prices for goods and services higher at a rate not seen since July of last year. Both manufacturers and services providers alike are seeing intensifying cost and selling price inflation rates, which is likely to feed through to higher consumer price inflation in the near term.”


ISM reports cooling activity and inflation in the service sector
The March ISM services index is weaker than expected, falling to 51.4 from 52.6 and coming in below the 52.8 consensus. Out of the 52 forecasts submitted to Bloomberg, only one person predicted anything weaker than this outcome – remember that vehicle sales (yesterday) came in below everyone’s expectations and construction spending (Monday) came in below everyone’s expectations, but the strength in the ISM manufacturing survey has dominated the commentary and market direction since its release Monday morning.
The details show business activity holding steady at decent levels, but new orders cooled below the six-month average while employment remains in contraction territory as the backlog of orders fell markedly. Importantly, the prices paid component slowed meaningfully to a four-year low, although the press release noted that “respondents indicated that even with some prices stabilizing, inflation is still a concern.”
The ISM reports don’t have the predictive qualities of old
With both the manufacturing and the services ISM employment components coming in below 50 – indicating falling employment levels – this should in theory mean a soft payrolls print on Friday (the consensus is 213k), but the report has a mind of its own and doesn’t correlate with anything right now. The chart below shows how the ISM employment components used to be a very good predictor of what payrolls would do, now they couldn’t be further apart – we are at levels suggesting payrolls should actually be falling outright to the tune of perhaps 50k.
ISM employment components versus non-farm payrolls changes (000s)
Source: Macrobond, ING
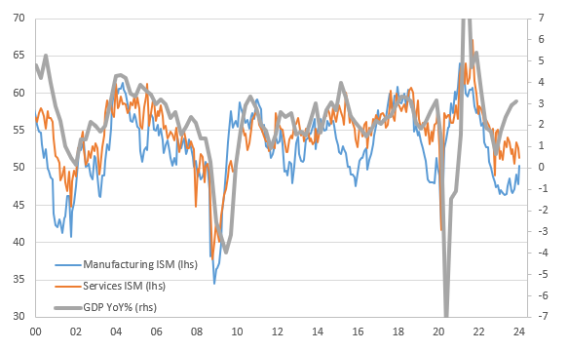
Likewise, the chart below shows how the headline indices from the ISM for manufacturing and services used to be a good indicator for where GDP growth would be heading, but again the relationship has failed since the pandemic. The ISMs are at levels historically consistent with the economy expanding at a rate below 1% year-on-year, not the 3%+ figure that official data tells us.
ISM headline indices versus GDP growth (YoY%)
The Fed needs to see cooling inflation and weaker jobs to be confident of being able to cut rates
These data discrepancies make the Federal Reserve’s job that much harder. For now, the market is leaning in the direction of things being too hot for substantial interest rate cuts with June seeing only a 60% chance of a 25bp rate cut. For the Fed to be comfortable to cut at that meeting we are likely going to need to see at least two 0.2% month-on-month core CPI prints between now and then (next week’s consensus forecast for March’s figure is 0.3%) with payrolls growth slowing towards 150k per month rather than the 236k averaged over the previous 12 months.

Note that the ISM is much weaker than the S&P Global on employment (ISM employment in contraction territory for the third time in four months) and prices/inflation. The media and most economists/pundits are focused on the ISM. Wrongly in my view.
March CPI Preview: Early-Year Strength in Inflation Noise or Signal?
Headline CPI likely rose by 0.4% for a second straight month, which would push the year-over-year rate up to a six-month high of 3.5%. Excluding food and energy, we estimate prices rose 0.3%—a tick softer than in January and February but similar to the pace averaged in Q4, in a sign underlying progress remains stubbornly slow. We suspect core goods fell back into deflation territory in March. Core services inflation, however, was likely little changed as a further moderation in shelter costs was offset by a pickup in services ex-housing.
Looking beyond March, we expect inflation to move lower this year. However, progress will be more of a grind ahead. A rebound in commodity costs have turned food and energy from tailwinds to headwinds. Meantime, supply chain strains are no longer easing. While we believe core goods prices have some additional room to fall over the next few months as earlier benefits of supply chain normalization feed through to prices, services prices will need to cool more markedly to keep overall inflation on its downward path. We expect to see a further moderation in shelter costs help drive the year-over-year rate of core CPI down from 3.8% at present to 3.3% in Q4, although progress is likely to be harder to discern when measured by the PCE deflator, the Fed’s preferred inflation gauge. (…)
Source: U.S. Department of Labor, Bloomberg Finance L.P. and Wells Fargo Economics

The Wells Fargo economists thus explain their optimism on housing inflation:
Housing inflation likely continued its gradual downward trend. After popping back up in February, rent of primary residences likely slowed in March. In addition to apartment vacancies climbing and private sector measures of “spot” rental rates having subsided sharply, the U.S. Department of Labor’s New Tenant Rent Index (NTRI) shows a steep slowdown for renters changing housing units. The moderating trend in rental rates should also help to keep a lid on owners’ equivalent rent growth; we look for another 0.4% rise in this component in March after it turned heads in January with a 0.6% increase.
Source: U.S. Department of Labor, CoStar Inc. and Wells Fargo Economics

The spectacular drop in the NTRI YoY growth rate is eye-catching, but new rents are less than 10% of all rents. The BLS also computes an All-Tenant-Regressed-Rent-Index which was still up 5.3% YoY in Q4’23 (last datapoint, next update April 10) after rising 1.54% QoQ or 6.2% annualized, up from +0.9% QoQ in Q3’23 (3.7% a.r.).
Powell Still Sees Room for Fed to Cut Rates This Year Federal Reserve Chair Jerome Powell said stronger-than-anticipated economic activity hasn’t changed the Fed’s expectation that declining inflation will allow for rate cuts.
Powell pointed to signs that labor-market conditions are less tight than they have been in recent years, a view that has eased concerns that paychecks and prices might rise in tandem. (…)
“The recent data do not…materially change the overall picture, which continues to be one of solid growth, a strong but rebalancing labor market, and inflation moving down to 2% on a sometimes bumpy path,” he said. (…)
Bloomberg’s account indicates that Mr. Powell is less solid about the bumps:
(…) He reiterated his expectation that it will likely be appropriate to begin lowering rates “at some point this year.”
“On inflation, it is too soon to say whether the recent readings represent more than just a bump,” Powell said Wednesday in a speech at Stanford University in California. “We do not expect that it will be appropriate to lower our policy rate until we have greater confidence that inflation is moving sustainably down toward 2%.” (…)
During the fireside chat, Powell detailed the outsized role supply-side factors like population growth have had in the inflation recovery. While it’s unclear if such factors will continue to reduce price pressures going forward, the Fed chair seemed optimistic.
“There may be more supply-side gains to be had,” he said. “Surveys of businesses still show difficulties in hiring people, difficulties in getting the inputs they need for their businesses — so, there’s some more benefit there.” (…)
Maybe he had not read the morning’s PMI surveys:
Some companies indicated that cost considerations had led them to hold off on hiring.
In fact, higher wages were a key factor behind the latest increase in input costs, according to respondents. Panellists also reported rises in transportation and material prices. As a result, input costs increased sharply during the month, with the rate of inflation accelerating to a six-month high. The latest rise was also sharper than the series average as 23% of companies recorded inflation over the month.
In turn, the pace of output price inflation also quickened markedly from that seen in February to the fastest since July 2023 as companies passed higher input costs through to their customers. As with input prices, the rise in charges was also faster than the average since the survey began in 2009.
- Raphael Bostic said he expects just one trim, in the fourth quarter.
CANADA: Service sector activity falls again in March
Canada’s services economy recorded another month of falling activity and new business during March amid reports of subdued market demand. Firms were subsequently able to comfortably keep on top of overall workloads and saw little need to recruit additional staff, the net result being a stagnation of employment. Operating expenses, however, continued to rise sharply, underpinned by increased wage costs. Competitive pressures restricted the degree to which costs were passed on to clients.
Closely linked to the decline in activity was a drop in levels of incoming new work. Anecdotal evidence pointed to client hesitancy in committing to new work given the uncertain economic environment. Lower consumer confidence and high prices were also noted. Overall, levels of new work have now fallen for eight months in a row, though the latest contraction was the weakest since last September. Volumes of new export business also fell in March, in line with a trend that has been apparent for nearly five years.
Poor trends in activity and new business discouraged recruitment activity in March. Following two months of modest growth, employment numbers stalled. (…)
According to the latest data, input prices rose steeply and at a faster pace than in February. Sharp inflation was partially linked to high fuel prices and suppliers increasing their charges.
Similarly, service providers sought to raise their own average sales prices in March. A net increase in average output charges extended the current period of inflation to three years. However, the degree to which prices rose was the lowest in 2024 so far. Some panellists noted that competitive pressures restricted pricing power.


Euro-Area Inflation Inches Toward 2% With Focus on June Cut Consumer prices rose annual 2.4% in March
Consumer prices rose an annual 2.4% last month, down from 2.6% in February, in line with a Bloomberg Economics Nowcast model. Analysts predicted an increase of 2.5%. A measure excluding volatile items such as food and energy also eased more than anticipated, to 2.9%. (…)
Bloomberg Economics’ Nowcast for April points to a reading of 2.1%.
While a key compensation gauge showed some moderation at the end of 2023, salaries continue to expand by more than 4%. That’s sustaining price pressures in services, where labor has an outsized impact on final costs. Inflation in that sector remained at 4% in March, while the rate for non-energy industrial goods fell to 1.1%.

Oil Advances Near $90 as OPEC Sticks With Its Production Cuts
Brent rose to within one cent of the $90-a-barrel psychological level on Wednesday after OPEC and its allies didn’t recommend any changes to their existing output cuts at an online ministerial review meeting. The move means roughly 2 million barrels a day of curbs will be in place until the end of June. (…)
Crude has pushed higher this year, with Ukrainian attacks on Russian energy infrastructure and Middle East tensions supporting prices. OPEC+’s curbs have been tightening the market, while there have been patches of disruption elsewhere, including an early-year deep freeze in the US and a recent curb to exports by Mexico. (…)


