U.S. Initial Jobless Claims Fall Again to a New Pandemic-Period Low
Initial claims for unemployment insurance decreased again in the week ending April 17, reaching 547,000, down 39,000 from the prior week’s 586,000. That reflected a modest upward revision from 576,000 initially reported, which was a weekly decline of 193,000. After that decline, the Action Economics Forecast Survey panel expected a rebound to 625,000, so this latest week is notably lower than expected. The latest week’s 547,000 represents yet another new low since the pandemic started in March 2020, even though it is still well above pre-pandemic amounts. The 4-week moving average is 651,000 in the period ending April 17, down from 678,750 the week before.
Initial claims for the federal Pandemic Unemployment Assistance (PUA) program edged slightly higher in the April 17 week, reaching 133,319, up from 131,721 the week before. Still, these are both the smallest since April 11, 2020, right after the program started. The PUA program covers individuals such as the self-employed who are not included in regular state unemployment insurance. Given the brief history of this program, these and other COVID-related series are not seasonally adjusted.
Continuing claims for regular state unemployment insurance decreased 34,000 in the week ended April 10 to 3.674 million from 3.708 million in the April 3 week; that earlier week was revised down from 3.731 million. (…)
Continuing PUA claims turned higher in the April 3 week, climbing to 7.310 million from the prior week’s 7.044 million. Still, these last two week are the lowest since the first few weeks of the pandemic period, except for a dip during the Christmas-New Year’s week. Also in the April 3 week, the number of Pandemic Emergency Unemployment Compensation (PEUC) claims rose, reaching 5.606 million, up from 5.158 million in the prior week. That program covers people who were unemployed before COVID but exhausted their state benefits. Extended PEUC benefits, which were included in the American Rescue Plan bill, totaled 492,999.
The total number of all state, federal, and PUA and PEUC continuing claims rose to 17.405 million, up 491,674 on the week. The last two weeks are also the lowest since very early in the pandemic period, except for that holiday week in January. This grand total is also not seasonally adjusted. (Haver)

FLASH PMIs
Eurozone expansion gathers pace as manufacturing enjoys record boom
Eurozone business activity grew at a stronger rate in April, the rate of increase accelerating to the fastest since last July as a record expansion of manufacturing output was accompanied by a return to growth in the service sector for the first time since last August.
The headline IHS Markit Eurozone Composite PMI® rose from 53.2 in March to 53.7 in April, according to the preliminary ‘flash’ reading, which is typically based on approximately 85% of final responses.
Output has now risen for two months after four months of decline, with the latest expansion the second-largest recorded since September 2018.
Manufacturing output grew for a tenth straight month, expanding at a rate unsurpassed in over two decades of survey history. Germany led the factory upturn, its rate of increase easing only slightly from March’s all-time high to remain the second-strongest on record. France’s factory expansion also slowed slightly, though remained the second best seen over the past three years. Record manufacturing output growth was meanwhile seen across the rest of the region as a whole.
The service sector continued to lag behind, principally reflecting further efforts to contain the spread of COVID-19 in many member states, though nevertheless reported the first expansion of activity since last August, albeit growing only very modestly. The return to service sector growth seen in Germany during March came close to stalling after new lockdown measures were introduced to control further waves of the virus, but both France and the rest of the eurozone saw marginal expansions for the first time since last summer as companies prepared for better times ahead.
Other survey indicators brought promising signals for coming months. New order growth across the eurozone hit the highest since September 2018, led by a second-successive record increase in new orders for manufactured goods. In contrast, new orders for services fell for a ninth successive month, though came close to stabilising.
Backlogs of work grew for a second month in a row, rising to an extent not seen since January 2018, as firms struggled to cope with the influx of new business. A survey record increase in manufacturing backlogs was joined by the first increase in outstanding business in the service sector since the pandemic began.
Future expectations also improved, climbing to the highest since comparable data were first available in mid-2012. Although sentiment slipped slightly lower in Germany, it remained close to March’s survey high. In contrast, firms in France and the rest of the region as a whole grew more optimistic, the latter reaching unprecedented levels as virus recovery hopes continued to build.
Companies responded to the accumulation of uncompleted orders and brighter outlook with a third successive month of net hiring, with employment growing at the steepest pace since November 2018. Manufacturers saw headcounts rise at a rate not seen since February 2018 while a far more modest rate of job creation was seen in the service sector, although even here the rise was the largest since the onset of the pandemic.
The return to growth was accompanied by a further increase in inflationary pressures as demand revived and costs increased.
Average input prices across both manufacturing and services rose at the sharpest rate for ten years. Factory input cost inflation accelerated to a new decade-high, often linked to supply shortages. Supplier delivery times lengthened to the greatest extent in the survey’s 23-year history. However, service sector input cost inflation also picked up to hit a two-year high.
Higher costs were often passed on to customers. Average prices charged for goods and services rose at the fastest rate since January 2018, fueled by a record increase in goods prices. Prices charged for services rose only modestly by comparison, though showed the biggest increase since the start of the pandemic.


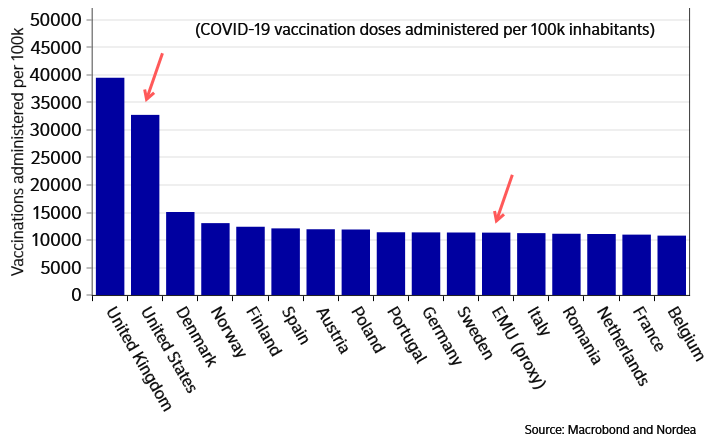
To give us a sense of how the service sector reacts when vaccination reaches 50%:
UK service providers indicated a steep and accelerated rise in business activity during April. At 60.1, up from 56.3 in March, the seasonally adjusted IHS Markit/CIPS Flash UK Services PMI® Business Activity Index signalled the fastest pace of expansion for more than six-and-a-half years. By sub-category, by far the strongest momentum was seen among consumer services, driven by the reopening of some customer-facing parts of the economy in England and Wales. Business services also increased at a strong pace in April, reflecting rising confidence towards the UK economic outlook.
Forward bookings for hotels, restaurants and other consumer services in response to the roadmap for lifting pandemic restrictions helped to boost new business volumes across the service economy in April. Measured overall, the latest increase in new work was the steepest since March 2015.
In contrast to the persistently weak employment trends seen in the second half of 2020, the latest survey indicated that service providers responded to rising demand by hiring additional staff at a robust pace in April. The rate of job creation accelerated to its fastest since August 2017. Despite efforts to rebuild business capacity, backlogs of work were accumulated to the greatest extent for nearly six years, which suggested that pent up client demand will continue to boost activity in the months ahead.
Japan: Renewed expansion in private sector output
The headline au Jibun Bank Japan Manufacturing Purchasing Managers’ Index™ (PMI)® rose from 52.7 in March to 53.3 in April, signalling the strongest improvement in operating conditions since April 2018. Both output and new orders expanded at a solid pace, with the pace of growth for both variables the quickest since the first half of 2018. Moreover, new export business growth accelerated in April. New orders from abroad increased for the third consecutive month and at the fastest pace since January 2018. Business optimism strengthened in April, marking the eleventh consecutive month of positive sentiment among Japanese manufacturers.
At 48.3 in April, the au Jibun Bank Flash Japan Services Business Activity Index was unchanged from March to signal a sustained deterioration in business activity across the service sector. New business contracted for the fifteenth month in a row. Despite subdued demand conditions, Japanese service providers noted a further expansion in workforce numbers in April, although the pace of job creation softened from March. Concerns of a resurgence in COVID-19 cases meant business expectations eased to the lowest since January in the latest survey period.


- Japan to impose new state of emergency as Covid-19 cases rise Restrictions to be put in place in big cities 3 months before the Olympics are due to begin
The U.S. flash PMI will be released later today. There is no flash PMI for China, but we have its Sales Managers Index:
China Sales Managers Index at Near 4 Year High in April
(…) Overall the SMI headline index for both Manufacturing and Services sectors shows a rise to a level of 52.7, significantly above the “no change” level of 50 which indicates modest but significant growth.
Second, the number is at a 45 month high, meaning that the Chinese economy is not just growing faster than recently (howsoever defined) but is growing at a good rate compared with recent years.
Looking at the data in more detail, the Sales Growth Index, which reflects growth in the latest month compared with the previous month, shows a reading of 54.4, indicating that the Chinese economy is not just returning to levels of previous years, but really is growing rapidly.
The Business Confidence Index is up at 53 in April, suggesting Keynes “animal spirit’s” have mostly emerged from the horrors of Covid.
Finally the Staffing Levels Index, based on a reading designed to reflect the buoyancy of the job market compared with one year ago, shows a very modest reading just over the “no change” level indicating that employers continue to stay cautious about recruitment, even if experiencing returning confidence.
Other elements of the survey suggest that manufactures are generally experiencing greater problems in the return to normality than service sectors. The Service Indicators are almost all at higher levels than the corresponding Manufacturing ones. The Prices Charged Indexes show a sharp differential with some manufacturing prices still reflecting hesitant demand or supply problems, whereas services prices reflect the faster recovery patterns possible where restarting operations is not dependant on sometimes long restocking cycles.

U.S. Existing Home Sales Fall in March as Supply Remains Tight
The market for previously owned homes weakened last month after sales declined in February. The National Association of Realtors (NAR) reported that sales of existing homes fell 3.7% (+12.3% y/y) to 6.010 million (SAAR) during March after declining to 6.240 million in February, revised from 6.220 million. The Action Economics Forecast Survey expected March sales of 6.10 million. Data are compiled when existing home sales close.
A tight housing supply continues to restrain sales. The number of homes on the market improved 3.9% (NSA) to 1.07 million last month, the first m/m increase since last May. The number declined, however, by 28.2% y/y and remained near the record low of 1.03 million units. (The figures date back to January 1999.) The months’ supply of homes on the market remained near the record low at 2.1 months, below a recent high of 4.6 months in May of last year.
Sales declined across the country last month. Existing home sales in the West weakened 8.0% (+15.5% y/y) to 1.270 million, the third decline in four months. In the South, sales decreased 2.9% (+15.9% y/y) to 2.700 million units after falling 5.8% in February. Sales in the Midwest were off 2.3% (+0.8% y/y) to 1.28 million, down for the fourth month in the last five. In the Northeast, sales eased 1.3% (+16.9% y/y) to 760,000 units, also down for the fourth month in the last five.
The median price of an existing home increased 5.9% (17.2% y/y) to a record $329,100. The median home price in the West rose 3.2% (16.8% y/y) to $493,300. In the Northeast, prices improved 1.9% (21.4% y/y) to $364,800. The median home price in the South rose 5.0% (15.6% y/y) to $283,900. In the Midwest, prices strengthened 7.2% (13.5% y/y) to $248,200. The average sales price of all existing homes rose 3.8% last month (12.4% y/y) to $355,200. The price data are not seasonally adjusted.
Sales of existing single-family homes weakened 4.3% (+10.4% y/y) to 5.300 million units after falling in three of the prior four months. Sales of condos and co-ops improved 1.4% (29.1% y/y) to 710,000 units after falling 6.7% in February.


CalculatedRisk has a better illustration of the market dynamics: “This was the highest sales rate for March since 2006, and the 4th highest sales rate for March on record (behind 2004, 2005, and 2006).”
Preview for April from Redfin:
Key housing market takeaways for 400+ U.S. metro areas during the four-week period ending April 11:
- Pending home sales were up 22% from the same period in 2019.
- New listings of homes for sale were down 13% from the same period in 2019.
- Active listings (the number of homes listed for sale at any point during the period) fell 47% from the same period in 2019 to a new all-time low.
Redfin’s homebuyer demand index is up 4.3% from a month ago, revealing that house hunters are still out in full force. They’re jumping on low mortgage rates, which are sliding back down toward 3%, and bidding up prices of the homes that do hit the market. The good news for buyers is that they should start to see more homes listed now that Easter is behind us.

Americans Are More Optimistic About Their Retirement Savings About three-quarters of U.S. workers and retirees believe they will have enough money for retirement, an increase from a year ago, a new survey shows.
(…) Among workers, 72% are somewhat or very confident in their ability to live comfortably in retirement, up from 63% last March and 69% in January 2020. Today’s level is close to the survey’s record of 74% in 1993, three years after the survey began. (…)
Among retirees, 80% are optimistic about their financial prospects during retirement, up from 76% last March. The 82% registered in 2019 is the survey’s highest. (…)
Change Afoot for Oil Market as Asian Demand Wanes, Iranian Supply Rises Signs are emerging of a shift underway in the oil market, with demand weakening in Asia and picking up in the West just as supplies of Iranian crude have climbed.
(…) Iran pumped 2.3 million barrels a day in March, according to the International Energy Agency, its highest production level since the Trump administration embargoed Iranian oil sales in May 2019.
More oil is already flowing out of the Middle East. Loadings of crude onto vessels in the region have risen to 16.8 million barrels a day, from 16.1 million barrels a day in March, according to data and analytics firm Kpler. (…)
Now traders’ concerns that demand will fall in India are also weighing on prices of Middle Eastern crude. India reported over 314,000 new coronavirus cases in the past 24 hours, the health ministry said Thursday, the world’s biggest one-day jump in new infections. Fresh restrictions on business and social activity there are likely to deal another blow to the economy.
Indian imports of crude oil and petroleum condensates had been on the rise in March and early April. “But obviously given the new variant emerging there, and the sheer jump in cases, the import volumes moving forward are probably under threat,” said Jay Maroo, senior market analyst at Vortexa, which tracks cargoes of commodities. (…)
However, increases in demand in the U.S., parts of Europe and the Mideast will more than offset the expected fall in India, he said. (…)
Investors plough money into US inflation-protected bond funds Tips funds enjoy 29 consecutive weeks of inflows amid expectations of rising prices
Biden Aims at Top 0.3% With Bid to Tax Capital Gains Like Wages
The proposal could reverse a long-standing provision of the tax code that taxes returns on investment lower than on labor. Biden campaigned on equalizing the capital gains and income tax rates for wealthy individuals, saying it’s unfair that many of them pay lower rates than middle-class workers. (…)
(…) The White House plans to propose almost doubling the capital gains tax rate for those earning $1 million or more, to 39.6%, according to people familiar with the proposal. That wouldn’t affect many. Only about 0.32% of American taxpayers reported adjusted gross income of more than $1 million and capital gains or losses on their returns, according to Internal Revenue Service tax return data from 2018.
The move would send the top federal rate on the appreciation in assets sold by the rich as high as 43.4% when including a surtax to help pay for Obamacare. And it would upend a century-old precedent of under-taxing investment relative to wages and salaries. (…)
The new marginal 39.6% rate would be an increase from the current base rate of 20%, the people said on the condition of anonymity because the plan is not yet public. A 3.8% tax on investment income that funds Obamacare would be kept in place, they added. (…)
For $1 million earners in high-tax states, rates on capital gains could be above 50%. For New Yorkers, the combined state and federal capital gains rate could be as high as 52.22%. For Californians, it could be 56.7%. (…)
Other measures that the administration has discussed include enhancing the estate tax for the wealthy. Biden has warned that those earning more than $400,000 a year can expect to pay more in taxes. The White House has already rolled out plans for corporate tax hikes, which go to fund the $2.25 trillion infrastructure-focused American Jobs Plan. (…)
The capital gains increase would raise $370 billion over a decade, according to an estimate from the Urban-Brookings Tax Policy Center based on Biden’s campaign platform. (…)
Wall Street on Tax Plan: ‘It Will Incentivize Selling This Year’
FYI: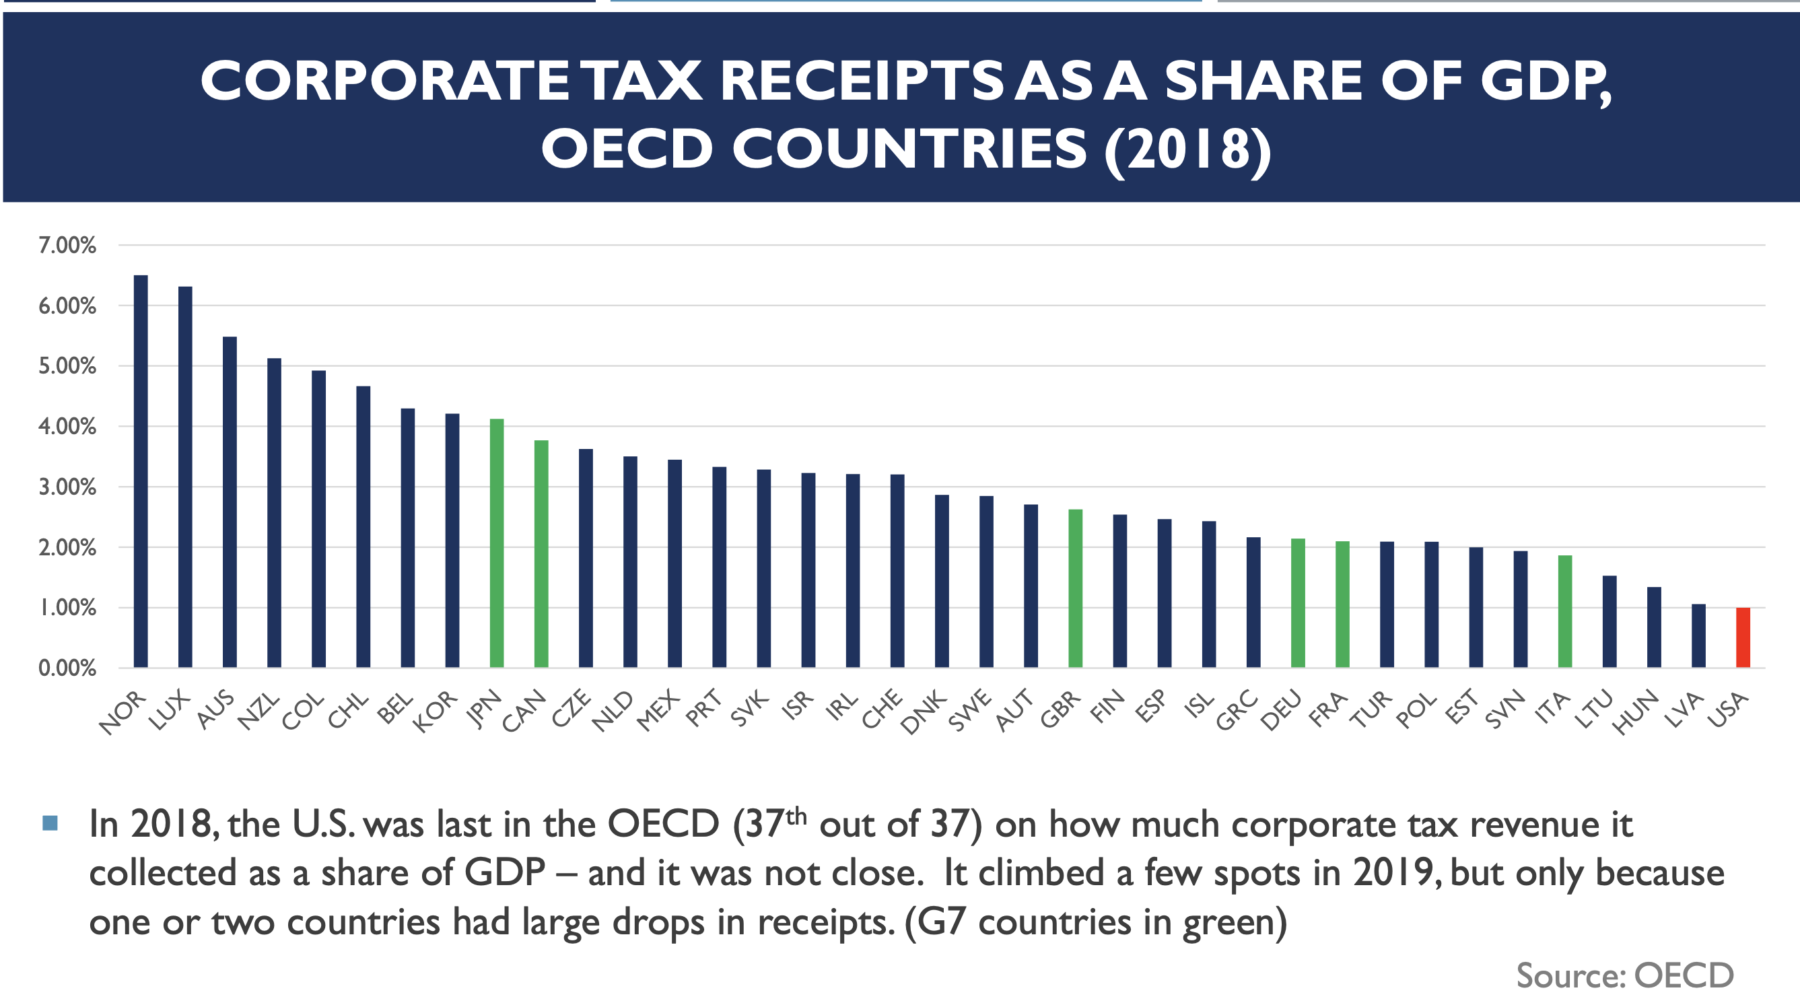
Source: OECD via United States Senate Committee on Finance (via Barry Ritholtz)
SPAC, CRACKLE AND POP!
The first in a probable series of such stories, with many more untold:
Robinhood, Three Friends and the Fortune That Got Away
(…) After the pandemic disrupted their livelihood taking school photos, the three California friends discovered the thrill of online trading—for a time, making more money than they ever thought possible. They looked ahead to building their savings and paying off debt. (…)
Messrs. Garcia, Norkin and Ela were among the retail traders who, emboldened by early wins and a community of online cheerleaders, took greater risks in a roller-coaster market. (…)
By the beginning of the year, all three friends were amplifying their bets using margin loans, money they borrowed from Robinhood to buy more securities. (…)
Over eight months, Mr. Ela, 30, poured his savings and big chunks of his pay into the market, about $30,000 in all. Mr. Norkin, who has three young children, invested a similar amount. Mr. Garcia, a new father, funded his account with $4,500 in savings and pandemic stimulus checks.
It seemed like they couldn’t lose. (…)
Mr. Norkin was initially wary of investing after losing money on technology stocks and gold many years earlier, he said. At first, Mr. Garcia said he also counted himself a conservative investor. Trading was something his parents, immigrants from Mexico, had never done.
They shared stock tips in group texts, and, by fall, the friends had a daily routine: At 5:30 a.m., they logged onto Robinhood and discussed potential investments before the market opened. (…)
Mr. Ela used his Robinhood-issued debit card to tap money from his brokerage account for a vacation to Mexico with his girlfriend. Mr. Norkin and his wife took a road trip to Yellowstone. He introduced her to the trading app, and they picked stocks together.
With their portfolios rising, the friends egged each other on to take bigger risks as 2020 drew to a close. (…)
Mr. Norkin wanted to buy a house and build his retirement fund after years of pouring money into his business. Mr. Garcia was expecting his first child and considered opening a Roth IRA for her. Mr. Ela planned to pay off his student loans and credit-card debt he accumulated while in college.
Mr. Ela read that a SPAC, or special-purpose acquisition company, planned to buy electric-vehicle firm Lucid Motors Inc. (…)
Starting in January, the friends bought shares of the SPAC, Churchill Capital Corp. IV, or CCIV. Mr. Ela used margin to bet 80% of his portfolio.
On Feb. 22, CCIV shares spiked in the morning, and Mr. Ela’s portfolio rose to a high of $89,000, about triple what he put in. The deal was announced after the market closed. The SPAC nosedived. Robinhood prevents users from trading after 3 p.m. Pacific Standard Time, leaving the friends powerless to get out.
Mr. Ela’s 30th birthday was the next day. He checked his account when he woke up and saw CCIV opened down 39% from the prior close—leaving him, on paper, about $50,000 poorer. The plunge prompted Robinhood to ask him for money to pay down the margin loan, a demand known as a margin call. He had to sell stock to make the payment.
“I just wanna throw up,” he texted his friends.
Messrs. Norkin and Garcia also took losses on CCIV and other electric-vehicle stocks over the next two weeks. Facing their own margin calls, they realized they hadn’t fully understood the debt they took on. The app prominently features a metric called “buying power” that includes margin. But they had a hard time finding any similar disclosure of what they might owe if their bets on stocks soured and triggered margin calls. (…)
“Time for us to not quit our day jobs,” Mr. Garcia texted his friends after their late February bust. (…)
Mr. Ela, the biggest risk taker, has pulled all of his money from the market and plans to start paying off debt. Mr. Garcia, once the most cautious, put all his money into Tesla, Coinbase Global Inc. and a SPAC run by hedge-fund billionaire William Ackman. Mr. Norkin is hanging onto his positions in hopes they will rebound.
Mr. Garcia is up close to $700 from his initial investment. Messrs. Norkin and Ela each lost about a third of what they put in.
“We all joked about having matching Lamborghinis,” Mr. Norkin said. “But at the end of the day, the three of us are grounded and rooted enough to just want to provide for our families.”
Many will not be so “lucky”. More to come, especially with current margin debt levels. A lot of the recent rise in stock indices was with borrowed money:

BTW, one of the fellow in the above story is said to have made 1,600 trades last year…They were all supposed to be free! Not really at the end of the year…
SPAC Surge Pumps Up Junk-Bond Market Some SPACs are targeting companies with below-investment-grade credit ratings; not since the dot.com-boom two decades ago has stock-market enthusiasm been hot enough to fuel such activity in debt markets.
(…) Companies with junk credit ratings are typically required to buy back their debt, often at a premium, when a change of control occurs via a merger. (…)
“There’s an oversaturation of SPACs right now,” Mr. Hakkak said. “It reminds you of when people bought multiple homes with no money down before the mortgage crisis.” (…)
“There have not been that many windows when leveraged credit issuers have been the beneficiaries of wide-open equity markets,” said David Daigle, co-manager of Capital Group’s $18 billion American High-Income Trust Fund and an analyst of high-yield bonds for 26 years. Stock valuations are rarely high enough to finance acquisitions or debt repurchases for junk-rated companies without significantly diluting existing shareholders, he said. (…)
“The biggest lesson for the leveraged finance market from the late 1990s is that no amount of equity can salvage a bad business model,” Mr. Daigle said. (…) “It’s the opposite of what we saw in the 1990s when the speculative lending was happening in the high-yield bond market,” he said.


 (…) We are going through a process where a narrative is tested against the market. If we reverse, it will come at the moment when that narrative can no longer create its own reality, and instead has to succumb to it.