The enemy of knowledge is not ignorance, it’s the illusion of knowledge (Stephen Hawking)

It ain’t what you don’t know that gets you into trouble. It’s what you know for sure that just ain’t so (Mark Twain)

Invest with smart knowledge and objective odds

THE DAILY EDGE: 26 OCTOBER 2021

NABE Survey Panel Foresees Further Economic Growth Over Next 12 Months, While Shortages, Higher Resource Prices Start to Affect Firms’ Decision Making

• The net rising index (NRI) for profit margins—the percentage of panelists reporting rising profits minus the percentage reporting falling profits in Q3 2021—is 25, a strong reading, but also a marked decline from the Q2 2021 record high of 35. This is the fifth consecutive survey in which the NRI is positive. The services sector has the largest profit margin NRI for the quarter at 35.

• The NRI for prices charged during Q3 2021 rose 12 points to 40, up from the Q2 2021 reading of 28. No respondents indicate their firms charged lower prices during Q3, and none expect their firms to cut prices over the next three months. Goods-producing firms lead the increase in price hikes, with 85% of respondents from that sector reporting that their firms charged higher prices in Q3, and 92% expecting price increases during Q4.

• The NRI for materials costs in Q3 2021 rose to 70—up from 59 in the previous quarter, and the highest reading since Q2 2008. Seventy percent of respondents report cost increases in Q3, up from 61% in Q2. NRIs for all sectors are positive, led by the transportation, utilities, information, and communications (TUIC) sector at 100, and followed by the goods-producing sector at 92. The NRI for expected costs in the next three months rose to 69 in the October survey, up from 50 in the July survey.

• The percentage of respondents indicating that wages rose in Q3 increased to 58% from 51% in the July survey. This is the fifth consecutive increase in the NRI for wages.

• Hiring decelerated during Q3 2021, resulting in the NRI for employment declining from 28 in the July survey to 23 in the October survey. Thirty percent of respondents cite increased employment at their firms during Q3, with 7% reporting declines.(…) The forward-looking NRI for employment fell to 24 in the October survey, down from 36 in the July survey. (…)

• According to panelists, the biggest downside risk to their company’s outlook is increased cost pressures, cited by 33% of respondents. (…)

• Almost two-thirds (65%) of respondents indicate that their firms will implement a flexible/hybrid work environment even after the pandemic subsides— up from 61% in the July survey.

• None of the panelists indicates that their firms’ labor shortages (if applicable) will abate by the end of 2021. Thirty-six percent of panelists expect this will happen sometime in 2022, and 14% specify it will happen in 2023 or later. Compared to results in the July survey, these shares are up from 18% and 10%, respectively. Nearly a quarter (24%) of panelists cites “Don’t know/NA,” indicating the uncertainty in the labor market.

• Half of the panelists indicates that their companies are experiencing delays or shortages in receiving materials or other inputs, up from 40% in the July survey, with those from the goods-producing sector accounting for the largest share holding this view. (…)

• Despite the increase in shortages and delays compared to those reported for Q2 in the July survey, panelists indicate that their firms are slightly less willing to push the higher costs on to customers. Indeed, 19% of panelists indicate that their firms are passing along these higher costs to their customers, down moderately from 22% in the July survey, with the largest share coming from the goods-producing sector. Twenty-one percent of panelists indicate that their firms are experiencing shortages, but not passing along the higher costs, up from 17% in the July survey.

Thirty percent of panelists—led by those from the more labor-intensive services and FIRE sectors—anticipate that if their firms are experiencing higher input costs, they expect them to be permanent. This is up from the 22% who cited this in the July survey. Twenty-one percent of respondents anticipate that the increase in costs will be only temporary, down from 34% in the previous survey, and led by respondents from the more materials-intensive goods-producing sector. Nearly one-third (32%) of respondents indicates that their firms are not experiencing any significant cost increases, up from 27% in the July survey. (…)

Markit:

Average input costs consequently rose at record rates in the US, UK, Eurozone and Australia, with input costs in Japan rising at a pace not seen since 2008. Faster rates of increase were registered for both manufacturing and service sector costs across the major economies.

Prices charged also rose at accelerated rates as these higher cost burdens were passed down to customers, with rates of inflation reaching new survey highs in the US, Eurozone and UK and rising to the highest since 2018 in Japan.

unnamed (88)

Inflation Pinches Restaurants, but Customers Seem Willing to Split the Check Casual-dining stocks such as Brinker International are logging a major hit to profits from food and labor costs but should be able to pass more of it through in the future

Brinker International, EAT -0.18% owner of Chili’s, said last Tuesday that it earned 34 cents a share on an adjusted basis in its fiscal first quarter, which ended in September—far below Wall Street analysts’ estimate of 68 cents a share.(…) For Brinker, labor expense as a share of total revenue was up 1.5 percentage points from a year earlier while the share of food costs rose 0.6 percentage point.

That damaged the bottom line despite continued strong   demand: Total revenue grew by 11% from the same quarter two years earlier, before the pandemic began. That growth could have been even stronger if it weren’t for the spread of the Delta variant during the summer. (…)

Brinker shares are down by about one-third over the past six months while Cheesecake Factory stock has shed about 28% over that period and BJ’s shares have lost about 36%. (…)

Brinker is raising prices by 3% to 3.5% this year to address higher costs. Pricing power is limited in the restaurant industry, but there is reason to believe that strong customer demand will absorb higher costs in the months ahead. (…)

From recent conference calls (courtesy of The Transcript):

  • “In this Q3, also as we expected, we probably saw the highest inflation increase ever year-over-year. I mean 6.5% which is sitting in the Q3 P&L. Frankly, in 22 years, I never had a single quarter with that kind of inflation…going forward, we don’t expect that the inflation will quickly fall off and will be short term. But by definition that it will carry over into next year.” – Whirlpool (WHR) CEO Marc Bitzer
  • “…as oil and gas prices increased, we are seeing improved energy sector demand. These positive market dynamics are driving strong steel demand across the platform. The steady demand, coupled with continued historically low absolute inventory levels throughout the supply chain, continue to support strong steel selling values, especially within the flat rolled steel market.” – Steel Dynamics (STLD) CEO Mark Millett
  • “…it does feel like there is a lot of legs to this inflation story. I always hesitate to predict the macro, but in terms of innings it still feels like relative early innings, and I say that, because of product scarcity, with what’s happening with freight and with — what’s happening with labor the extreme shortages. It just seems like there is still ways to go and that’s consistent with most folks that I talked to. So I would say still relatively early innings of the story” – MSC Industrial Direct (MSM) CEO Erik Gershwind
  • “…we anticipate significant supply chain inflation in fiscal 2022 due to higher cost related to raw materials, packaging and logistics.” – Simply Good Foods (SMPL) CFO Todd Cunfer
  • “Despite higher prices, we are still sustaining a higher double-digit percentage retail pace currently than 2 years ago.” – Winnebago Industries (WGO) CEO Michael Happe
  • “I think the transparency around wages is very high. So workers know exactly what they’re being paid today and what opportunities they have nearby that would pay more. And that’s why you see this increase in quit rates because workers are looking at the opportunities.” – ManpowerGroup (MAN) CEO Jonas Prising
  • “PC demand remains very strong. And we believe that 2021 TAM will grow double-digits even as ecosystems shortages constrain our customers’ ability to shift finished systems. Dell, HP, Lenovo, along with other OEMs and ecosystem partners agree that PCs are now a structurally larger and sustainably growing market.” – Intel (INTC) CEO Pat Gelsinger
  • “…in the near term, the light vehicle outlook will mainly be determined by the evolution of the situation around semiconductors. In North America, the industry continues to struggle to meet consumer demand for new vehicles due to the shortage of semiconductors. Inventory of new vehicles in the U.S. ended September below 1 million units, the lowest level seen for at least 35 years.” – Autoliv (ALV) CFO Fredrik Westin
  • “In terms of some of the pressures year-over-year. I mean, it really is a lot driven by fuel. The cost per gallon and if I’m looking at it year-over-year is going to be up anywhere from call it 75 to 80%. And that’s just very tough to overcome, especially with flat volumes, because that’s essentially how we’re looking at things and you think about our volume guidance in the 5% for full year.” – Union Pacific (UNP) CFO Jennifer Hamann

CFOs Plump Salaries, Perks to Land Elusive New Employees Amid the ‘Great Resignation,’ companies have to offer compensation that stands out in order to draw new workers—and hold on to the ones they have

(…) Workers handed in a seasonally adjusted 4.3 million resignations in August, a record since tracking began in 2000 that came after months of elevated departures, according to the Bureau of Labor Statistics. Jobless claims last week dropped to the lowest level since March 2020.

The “Great Resignation” is exacerbating skills shortages across industries and forcing companies to pay more, driving up costs at a time of already high inflation. In a survey released last week, chief financial officers at U.S. businesses said quality and availability of labor was their No. 1 concern, with three-quarters of them stating they have difficulty hiring, according to Duke University’s Fuqua School of Business, which conducted the poll with the Federal Reserve Banks of Atlanta and Richmond.

Companies plan to keep hiring new workers and increasing non-wage compensation—for example, for healthcare and other benefits, the survey of 301 CFOs found. Wage bills are forecast to rise by 6.9% this year and next, while wages for new hires are set to rise by about 10%, according to the survey. (…)

“We expect these salary increases to be permanent,” Mr. Graham [professor of finance at the Fuqua School of Business] said. “And they absolutely increase costs for the firms, putting pressure on the firm to increase prices of their own products and thus increasing inflation.” (…)

“It feels like the balance of power has changed from the recruiter to the recruit,” CFO Debbie Clifford said. “I have never seen a market like this in my career.” (…)

Salary growth at companies in the S&P 500 has been flat in recent years, with median compensation per employee totaling $70,496 in 2020, up from $68,410 in 2017, according to MyLogIQ, a data provider. (…)

Team Biden is making the situation worse (Nordea)

(…) Vaccine mandates are intensifying the distortions on the US labour market.

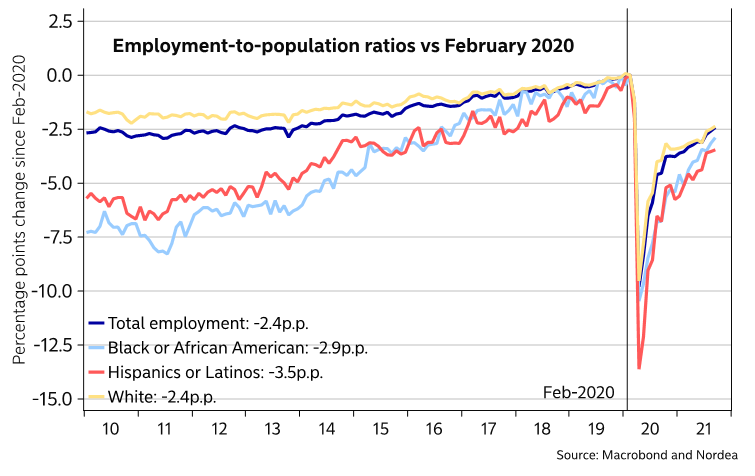
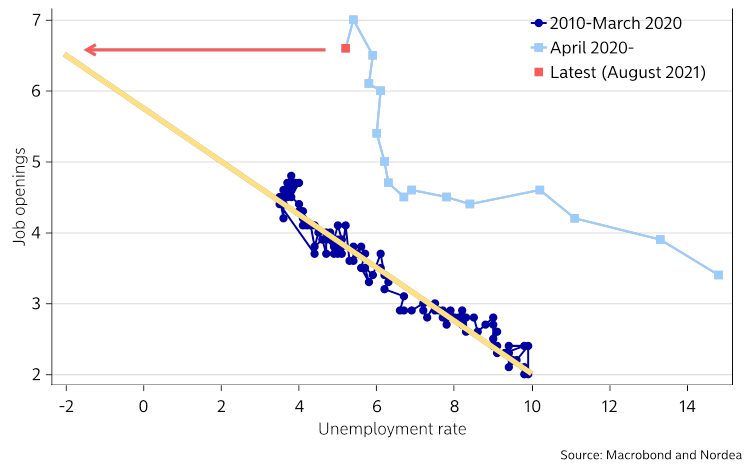
While employment-to-population ratios suggests there should be lots and lots of wage-depressing slack in the labour market, an updated Beveridge curve suggests otherwise – that the equilibrium rate of unemployment/NAIRU (or whatever the economist priest-class calls it nowadays) has surged.

There should be massive slack according to EPOP ratios

Pre-pandemic Beveridge curve suggests an unemployment rate at -2%

The pre-pandemic relationship between job openings and the unemployment rate (the so-called Beveridge curve) suggests that we ought to have been seeing a -2% unemployment rate. However, with workers afraid of the virus, or having trouble to find child care, trying to move from the service sector to the goods sector, NAIRU will be higher at least for a while. Thousands upon thousands of workers have also been fired due to vaccine mandates, which is intensifying worker shortages in some regions (and reducing the flexibility of the US labour market). This is inflationary. Jobless New York nurses are of course welcome to Florida but relocating takes time and it boosts frictional unemployment and thus NAIRU – again at least temporarily.

  • Kentucky has the highest rate of job quitters in the nation. Kentucky has a large concentration of jobs in warehousing and transportation — two sectors that have seen employees flee for better working conditions and pay. The rate of job openings in Kentucky (8%) is among the country’s highest (second only to Alaska, 9%). At a national level, it’s 6.6%. There are two open jobs for every unemployed Kentuckian. That doesn’t beat out Nebraska, however, which has three available gigs for every jobless person. The place with the lowest quits rate? D.C. (Axios)

unnamed - 2021-10-26T074830.831

(Bureau of Labor Statistics; Chart: Will Chase/Axios)

Europe’s Power Prices Rise on Growing Cold Weather Predictions

German and French month-ahead power rise on cold weather predictions

EARNINGS WATCH

imageWe now have 119 reports in, an 83% beat rate and a +13.9% surprise factor. Deutsche Bank says that a large part of the beat so far is due to loan-loss reserve releases by banks. Excluding those, the surprise factor for the S&P 500 in aggregate is running at a more modest 8.0%, and for the median company at 5.2%, indicating that the headline beats have not been broad based.

Interestingly, with nearly 25% of companies having reported, overall margins are up significantly as blended earnings growth is seen at +34.8% against revenues up 14.4%.

So far, only 3 sectors are not showing improving margins: Consumer Discretionary, Staples and Utes, sectors at the very end of the price pipeline.

unnamed - 2021-10-26T084031.109

(FactSet; Chart: Thomas Oide/Axios)

TECHNICALS WATCH

Stocks’ Internal Momentum Has Turned Up

Large caps:

But not small caps:

Hence, NYSE not breaking out just yet:

Many times over the past couple of decades, we’ve discussed the idea that stocks are less likely to suffer a large drawdown in the following months when the advance/decline line breaks out to a new high. We typically use the NYSE Advance/Decline Line, but our version of that indicator hasn’t quite made it over the hump. It very well might on Monday if stocks have a good day.

Below, we can see that since 1928, the S&P 500 was three times more likely to suffer a 10% decline at some point within the next three months if the S&P’s Advance/Decline Line was not at a multi-year high. When it did break out to a new high, as it did on Friday, there was only a 4.6% probability of a 10% or greater decline within the next few months and less than a 2% chance of a 20% decline. Since 1928, the only two instances were the Black Monday crash in October 1987 and the pandemic crash in March 2020.

But The Market Ear notes a changing leadership:

Big tech remains unimpressed with the latest SPX all time high. Big tech (here represented by the FDN index) hasn’t even been able to try all time highs and continues fading the SPX since mid July.

Note that the FDN hasn’t moved since the euphoria highs in mid Feb, while SPX is up some 600 handles since then.

Can this market continue moving higher without the pillar of this market joining?

Chart 2 showing the top 10 components of the FDN index.

etf.com

Seasonality is positive for the next 2 months as Horan illustrates:

S&P 500 Seasonality Chart

LIQUIDITY WATCH

Maybe an early 2022 story:

Yellen ready to zap dollars while Powell is going taper (Nordea)

Treasury Secretary Yellen has stated that the debt ceiling needs to be fixed by early December, providing us with a new so-called X-date. Fixing the debt ceiling would enable the Treasury to rebuild its crisis account (TGA) at the Fed, which will zap more than 750bn of dollar liquidity over a couple of months – if the latest refunding estimate of a 800bn target for the TGA is to be believed. This boils down to quantitative tightening (QT).

At roughly the same time, the Fed is expected to start tapering its bond purchases. Assuming both processes unfold in December through March, Fed may add 340bn of USD via its QE program while the UST will sterilize >750bn of USD – a net negative of >400bn!

Less liquidity and more issuance could be factors which will underpin the USD in unexpected ways as Christmas starts to approach – perhaps even a Bad Santa Powell will pay you a visit?

  • The U.S. regulator is poised to rein in the $131 billion stablecoin market. A report this week will say the SEC has significant authority over tokens like Tether, people familiar said. It will also urge Congress to specify coins should be regulated like bank deposits. (Bloomberg)
Chinese Developer Modern Land Fails to Repay $250 Million U.S. Dollar Bond The Hong Kong-listed real-estate company that focuses on green projects, failed to repay the bond that matured Monday, adding to a string of missed payments by Chinese real-estate companies.

In a statement Tuesday, the Beijing-based company attributed the missed payment to an unexpected cash crunch caused by “factors including the macroeconomic environment, the real-estate industry environment and the Covid-19 pandemic.”

Modern Land didn’t say if the failure to repay the bond would immediately constitute an event of default, or whether it would trigger cross-default provisions on other debts. Credit analysts at Lucror Analytics called the incident a default in a note to clients. (…)

THE DAILY EDGE: 5 AUGUST 2021

U.S. Composite PMI: Softest rise in business activity since February

July PMI™ data indicated another robust expansion in U.S. service sector business activity. The upturn softened to the slowest since February, but was much quicker than the series average. Contributing to the less marked upturn in output was a softer rise in new business. Nonetheless, domestic and foreign client demand remained historically strong. In line with larger
inflows of new business, backlogs of work rose solidly and at the joint-fastest pace since August 2020. Efforts to ease pressure
on capacity was hampered by reports of a shortage of suitable
candidates.

Meanwhile, input costs and output charges rose substantially despite their respective rates of inflation softening again from May’s historic highs.

The seasonally adjusted final IHS Markit US Services PMI Business Activity Index registered 59.9 at the start of the third quarter, down from 64.6 in June. This was broadly in line with the earlier released ‘flash’ estimate of 59.8 in July. The latest upturn in business activity was marked overall, despite easing to a five-month low. Greater output was linked to strong demand conditions and a sustained increase in new orders. Some companies stated that capacity constraints hampered activity growth, however.

image

New business continued to rise in July, and at one of the fastest rates since data collection began in October 2009. The upturn was supported by a pick-up in client demand following vaccinations and the relaxation of COVID-19 restrictions. The robust expansion was one of the quickest in over three years despite softening to the slowest since February.

At the same time, new export orders increased for the fifth month running in July, amid the further reopening of key export markets. The expansion was solid overall but eased to a four month low.

Reflecting strong client demand and a further increase in new business, service providers registered a solid accumulation in backlogs of work. Pressure on capacity also reportedly stemmed from staff shortages and difficulties hiring new workers. As a result of challenges finding staff, the rate of job creation eased for the third month running.

On the price front, cost burdens increased at a substantial pace in July. Input prices rose due to supplier shortages, while service firms also highlighted greater fuel costs. The rate of inflation was much quicker than the series average, despite easing further from May’s historic peak.

Service providers sought to pass on higher costs to their clients where possible in July. Output charges rose markedly but, in a similar manner to input prices, the rate of increase softened.

Finally, expectations regarding the outlook for output over the coming 12 months remained strongly upbeat in July. Optimism was largely attributed to hopes of further boosts to demand following an increase in customer numbers as COVID-19 restrictions relax. The degree of confidence dropped to a five-month low, however, amid concerns about the strength of customer demand over the coming months.

The IHS Markit U.S. Composite PMI Output Index posted 59.9 in July, down from 63.7 in June and falling further from May’s recent high. The rate of expansion was the softest since March amid a slower upturn in service sector activity, but was quicker than the series average.

image

Private sector new order growth softened to a four-month low in July, despite manufacturers registering a faster upturn in new business. New export orders, meanwhile, continued to rise solidly.

Inflationary pressures remained substantial at the start of the third quarter. Input costs rose markedly, and at one of the fastest rates on record amid significant supplier delays and material shortages. Private sector firms noted further efforts to pass on higher costs, where possible, to their clients. As a result, output charges rose at the third-steepest pace since data collection began in October 2009.

At the same time, pressure on capacity following supplier and staff shortages worsened in July. Although manufacturers and service providers registered further expansions in workforce numbers, hiring was stymied by difficulties finding suitable candidates for vacancies.

Chris Williamson, Chief Business Economist at IHS Markit:

The pace of US economic growth cooled in July, according to the final PMI data, but remained impressively strong to suggest that GDP will rise robustly again in the third quarter. Stimulus measures combined with the vaccine roll out and reopening of the economy continued to boost demand for goods and services, most notably among households and especially in consumer-facing services such as travel and hospitality.

Some further easing in the rate of expansion is likely in coming months, however, as future growth expectations mellowed considerably during the month. This waning of optimism in part reflected the likely peaking of demand in the second quarter as the economy opened up, but also reflected a rising concern over the potential for the Delta variant to disrupt the economy again.

With the survey once again bringing signs that capacity is being constrained by a lack of raw materials and labour, inflationary pressures look set to persist in the coming months, though it is encouraging to note that the overall rate of increase of selling prices for goods and services continued to moderate from May’s recent peak.

WHAT RESPONDENTS ARE SAYING

  • “Peak demand while still facing challenges filling open positions.” [Accommodation & Food Services]
  • “The slow movement of container traffic has definitely impacted our business in the first half of the year. We expect the situation will take another year to correct itself.” [Agriculture, Forestry, Fishing & Hunting]
  • “Costs have risen dramatically in the last 45 days. Lodging, fuel, travel and supplies are all rising sharply. Costs for available labor are also rising, as demand increases in a diminished labor pool.” [Construction]
  • “Fuel prices are coming back down a bit. Labor shortage continues for drivers and general labor work. We have increased pay for many positions, but the shortage continues.” [Management of Companies & Support Services]
  • “Supply chain disruptions continue to impact sales.” [Professional, Scientific & Technical Services]
  • “Appliances, laptops and certain chemicals are still in short supply.” [Public Administration]
  • “Continued shortages in computer equipment (laptops and PCs) are challenging for fulfillment needs. Corporate travel has resumed, but we’re seeing many flight cancellations and car-rental shortages. Heating, ventilation and air conditioning (HVAC) repairs also impacted by longer than normal lead times for replacement units.” [Retail Trade]
  • “Ocean freight costs have created a negative impact to our business. The congestions at (the ports of) Long Beach/Los Angeles and Seattle have increased lead time by 15 days. Additional delays are occurring at the Chicago rail yard, (causing) two to three weeks of additional lead time.” [Wholesale Trade]
Wages Are Rising: How Far Will They Go?

This is from the Richmond Fed. The author complements my own Aug. 3 analysis of the ECI but adds even scarier data from their own recent survey:

(…) Recent increases in wages can be observed through national data. In June 2021 the Bureau of Labor Statistics (BLS) reported average hourly earnings of $30.40 an hour, above the pre-pandemic level of $28.51 from February 2020, and year-over-year wage growth of 3.6 percent, above the February 2020 rate of 3.0 percent.

The BLS also publishes a quarterly employment cost index (ECI), measuring the change in the cost of labor. The ECI looks at changes in employment costs within industries and occupations, making it free from influence of employment shifts among occupations and industries. Employment cost index data in the chart below show that national compensation costs (including wages and benefits) for workers rose by 0.7 percent in the second quarter of 2021, while wages alone rose by 0.9 percent. This followed strong growth in the first quarter, which saw total compensation growth of 0.9 percent and wage growth of 1.0 percent, the highest growth rates since 2007, shortly before the Great Recession.

3-month-growth-in-employ

In our Fifth District business surveys more firms have reported increasing wages than decreasing wages every month since August 2020. Furthermore, firms have reported accelerating year-over-year wage growth throughout 2021. Our July 2021 business surveys included special questions, asking firms about their expectations for wage growth going forward. Nearly 50 percent of respondents reported that they expected wage changes over the next 12 months to be greater than normal, with only 6 percent expecting them to be lower than normal.

Pointing up In July, firms reported that they expected to see, on average, 7.5 percent wage growth over the calendar year 2021 and 7.1 percent wage growth over the calendar year 2022. Overall, firms’ expectations for wage growth averaged between 6.5 percent and 7.5 percent across worker skill levels in both 2021 and 2022. (…)

No clues on how far wages will go but it’s pretty obvious a wage problem is developing in the U.S.. I doubt that Goldman Sachs’ David Kostin is incorporating such wage pressures in his most recent forecast that you will find below.

The Richmond Fed’s staff seems a lot more concerned of inflation than the FOMC officials and staff. This is from a July 13 research piece:

(…) May’s PCE price report also showed an acceleration in the prices people pay for housing, a development which might have more lasting implications for the path of core inflation ahead. Housing services prices rose 0.3 percent on a monthly basis, up from 0.2 percent in April, and are 2 percent higher on an annual basis. Unlike the price indexes for services like rental vehicles and air transportation, the price level of housing services did not fall sharply at the trough of the pandemic, making the recent increases more noteworthy. On a three-month annualized basis, housing services prices have risen 2.9 percent in May, up from 2.7 percent in April and increasing for the fourth straight month.

Two main features make shelter prices particularly eye-catching in this period of elevated monthly inflation. First is a significant contribution of shelter prices to aggregate inflation: Housing services make up about 16 percent of overall PCE and 18 percent of core PCE. The second feature is that housing services prices appear to be particularly sticky. The two main components of housing services are rent of primary residences and owners’ equivalent rent (OER), which refers to the price that homeowners would pay to rent their home in a competitive market, and is imputed from surveys of rental units. Rent prices change infrequently enough that the Bureau of Labor Statistics collects rent data for sample properties every six months rather than monthly or bimonthly as for most other items. And a study by economists at the Cleveland Fed found that one of the best predictors of OER inflation was previous OER inflation — in other words, high OER inflation tends to be followed by high OER inflation.

Because shelter prices are sticky, May’s higher prices could be a harbinger of elevated inflation to come. Alternative data also point to further increases ahead. An index of rental appreciation produced by Zillow, an online real estate marketplace, rose 2.3 percent in May — the fastest monthly growth rate in data that begins in 2014 — and now stands above its pre-pandemic trend. The Zillow index measures asking rents, which may not perfectly reflect what renters are currently paying. But the recent rise in average asking rents suggests landlords are feeling more confident about raising rents as business and consumer activity strengthens over the summer. As existing contracts are renegotiated and new leases are signed, this dynamic might eventually pass through to the housing services component of inflation, and it makes shelter prices an area worth watching as market participants try to understand the extent to which recent inflation is transitory or persistent.

  • First Walmart, now Target: The retailer will pay tuition for part- and full-time employees attending certain schools. (Reuters)
Interest-Rate Increases Could Come as Soon as Early 2023, Fed’s Clarida Says Significant fiscal stimulus should speed faster recovery to central bank’s goals, according to Fed vice chairman

Fed Vice Chairman Richard Clarida said he expects that, under his current projections for inflation and employment, “commencing policy normalization in 2023 would…be entirely consistent with our new flexible average inflation targeting framework.” (…)

Mr. Clarida prefaced his remarks by saying that interest rate increases are “certainly not something on the radar screen right now,” but he said that if his outlook for inflation and unemployment is realized, then the Fed’s thresholds for raising rates “will have been met by year-end 2022.”

(…) Mr. Clarida said Wednesday he could see the central bank announcing a reduction in the pace of purchases later this year.

Even though Mr. Clarida isn’t likely to be at the Fed at that time—his term on the board expires at the end of January—his comments are notable because his views are likely shared by a number of other Fed officials and because of his role in shaping the central bank’s current policy guidance. (…)

“It is important to note that while the ELB can be a constraint on monetary policy, the ELB is not a constraint on fiscal policy, and appropriate monetary policy under our new framework, to me, must—and certainly can—incorporate this reality,” he said. Mr. Clarida said fiscal policy this year, including more than $2 trillion in excess savings that haven’t been spent by households, “can fully offset this constraint.” (…)

Mr. Clarida said he thinks the risks of inflation running higher than he currently expects are greater than the risks of inflation running lower than his forecast.

Home sales in Toronto suffer fourth straight month of decline, as ‘sense of calm’ sets in

There were 9,390 home resales in the Toronto region in July, down 15 per cent from the same month last year, and down 2 per cent from June on a seasonally adjusted basis, according to the Toronto Regional Real Estate Board, or TRREB. Condos, with prices typically lower than houses, were the only type of property to see an increase in sales year over year.

Across the Toronto area, the average selling price of a home was $1,062,256, a 12.6-per-cent increase from July of last year and 0.9 per cent above June on a seasonally adjusted basis.

The home price index, which adjusts for volatility in pricing and sales, was $1,054,300, marking the second straight month of no movement after spiking 5 per cent in January. (…)

The number of new home listings was down 31 per cent year over year. But even though there was less inventory, there were also fewer buyers willing to get into frenzied bidding wars. “If it is going to be a bidding war, they are shying away and not wanting to compete. Buyers are coming in with lower offers,” she said. (…)

In other major Canadian markets, activity also slowed. On a non-seasonally adjusted basis, sales in the Montreal area dropped 18 per cent from the previous month, according to the local board. In the Vancouver region and B.C.’s Fraser Valley, sales fell about 11 per cent over the same period, according to their local boards.

Prices were essentially flat in the Vancouver area with the index price of a detached house at $1,801,100 in July. In the Fraser Valley, the index price for a detached house edged down 0.4 per cent to $1,319,200, while rising incrementally for townhouses and condos. In the Montreal metropolitan area, the median price of a single family home rose slightly to $508,000.

UK new car sales fall to lowest July level since 1998 British new car sales fell by 29.5% to their lowest July level since 1998 as the ‘pingdemic’ of people self-isolating alongside supply shortages hit demand, according to an industry body.

(…) “The next few weeks will see changes to self-isolation policies which will hopefully help those companies across the industry dealing with staff absences, but the semiconductor shortage is likely to remain an issue until at least the rest of the year,” SMMT Chief Executive Mike Hawes said.

RISK MANAGEMENT IN ACTION

Jean-Guy Desjardins, Chairman at Fiera Capital, is among the best asset mixers around. Together with Candice Bangsund, he sets the asset mix for Fiera’s clients whose assets total CAD$180B.

Fiera’s two main economic/financial scenarios changed 2 months ago from “Rapid” and “Subdued“ Recovery carrying probabilities of 60% and 25% respectively to “Reflationary Recovery” and “Inflationary Boom” with respective probabilities of 50% and 40%. A rather significant change with minimum inflation over the next 12-18 months ratcheted up from 1.5% to 2.25% and a 40% chance of 3.0%+ inflation in the “Inflationary Boom” scenario.

A growing risk to our base case scenario is that these so-called transitory pricing pressures become more engrained and de-anchor inflation expectations, which risks triggering a hawkish turn from central banks and an earlier-than expected withdrawal of monetary policy support. In this overheated scenario, the near-term spike in pricing pressures proves more enduring than expected, and lasts long enough to become embedded in inflation expectations. Supply-chain dislocations take longer to correct, while shortages and subdued participation in the labour force become more long-lasting given lingering health-related fears of returning to work, the structural shift in demographics (ageing populations), or skills mismatches in the post-pandemic reality. In turn, the persistent shortage of workers sparks a wage price spiral that cuts into the profitability of corporations and partially counters the strong top-line growth. In response, policymakers pre-emptively step-in to curtail runaway prices, which reduces the visibility and the longevity of the economic cycle. As investors digest the fallout from a tighter policy backdrop and realign their expectations, bond yields soar higher and volatility ensues, which weighs on both the economy and stock markets alike.

In this 40%-probability scenario, the S&P 500 Index would return -8.0% through the end of 2022 as opposed to +4.0% in the ““Reflationary Recovery” scenario. Fiera’s strategists are raising cash from 0% to 10% and reducing U.S. and international equities by 5% each both to underweight vs their respective benchmarks.

And from the sell-side:

Strategists at Goldman Sachs on Thursday lifted their S&P 500 targets for both this year and next, citing better-than-expected earnings and lower-than-expected interest rates.

The investment bank lifted its year-end S&P 500 SPX, -0.46% target to 4,700 from 4,300 — implying a 7% advance to the end of 2021 — and moved its 2022 target to 4,900 from 4,600.

Strategists led by David Kostin point out that earnings per share growth has accounted for all of the major index’s 17% return this year. (…)

More from David Kostin:

We raise our EPS estimates to $207 (from $193) in 2021 and $212 (from $202) in 2022. These represent annual growth of 45% and 2%, respectively, and compare with bottom-up consensus estimates of $201 and $217. Relative to consensus, we expect stronger revenue growth and more pre-tax profit margin expansion as firms successfully manage costs and as high-margin Tech companies become a larger share of the index. Unlike consensus, we assume corporate tax reform passes and is a headwind to EPS in 2022 and beyond. In a scenario with no tax reform our EPS and price targets would be roughly 5% higher. (…)

Corporates and households will be the largest buyers of US equities. Share buyback announcements have totaled $683 billion YTD, the second largest total on record at this point in the calendar year. US money market funds have AUM of $5.4 trillion, more than $1 trillion above balances at the start of 2020.

In the near term, we expect upward revisions to EPS estimates and declining concerns about the Delta variant spread to drive equity upside, but the path of the virus and its economic impact have proven difficult to predict. Later in the year, uncertainty around fiscal and monetary policy will likely drive volatility.

Bond rally pushes global stock of negative-yielding debt above $16tn Tumbling yields defy expectations that Covid recovery would spark sell-off
  • Seasonality in US Treasuries…. Seasonality in US Treasury returns is opposite to that of equities which makes August and September difficult months for the latter.

Robinhood Catches Its Own Meme Stock Spotlight With Wild 100% Surge
COVID-19

Charts from NBF:image

image

image

Flirt male Finally, this might pique some people’s interest: Erectile dysfunction is 3x higher in covid positive men according to this study…Image