Boost to Household Income Primes Economy for Growth U.S. household income jumped 10% in January and spending grew 2.4%, priming the economy for a burst in growth this year.
Under a $900 billion stimulus program signed by former President Donald Trump in late December, the federal government has been sending one-time cash payments of $600 to most households. It also has been paying jobless workers $300 a week on top of their normal unemployment benefits. Meanwhile, job growth resumed in January after a drop in December. And higher-income households, unable to travel or dine out, have built up a high level of savings. (…)
Personal income increased $1,954.7 billion (10.0 percent) in January according to estimates released today by the Bureau of Economic Analysis (tables 3 and 5). Disposable personal income (DPI) increased $1,963.2 billion (11.4 percent) and personal consumption expenditures (PCE) increased $340.9 billion (2.4 percent).
Real DPI increased 11.0 percent in January and Real PCE increased 2.0 percent; goods increased 5.1 percent and services increased 0.5 percent (tables 5 and 7). The PCE price index increased 0.3 percent. Excluding food and energy, the PCE price index also increased 0.3 percent

Contributions to change in personal income levels versus February 2020 ($trn)
")
Source: Macrobond, ING
U.S. Initial Unemployment Insurance Claims Fall Sharply
Initial jobless insurance claims declined 111,000 in the week ended February 20 to 730,000 from 841,000 in the prior week, revised from 861,000. The four-week moving average of initial claims eased to 807,750, its lowest since early-December. The Action Economics Forecast Survey expected 828,000 initial claims for the latest week.
Initial claims for the federal Pandemic Unemployment Assistance (PUA) program declined to 451,402 last week from 512,862 in the prior week. These claims remained, nevertheless, near the recent high. The PUA program covers individuals such as the self-employed who are not included in regular state unemployment insurance. (…)
Continuing claims for regular state unemployment insurance fell to 4.419 million in the week ended February 13 from 4,520 million during the prior week, revised from 4.494 million. Continuing PUA claims for the week of February 6 eased to 7.519 million from 7.686 million in the prior week. The number of Pandemic Emergency Unemployment Compensation (PEUC) claims rose to 5.066 million in the week of February 5 from 4.062 million the week before. It was the highest level of claims for this program. It covers people who were unemployed before COVID but exhausted their state benefits and are now eligible to receive benefits through March 14, 2021.
The total number of all state, federal and PUA and PEUC continuing claims rose 701,102 to 19.043 million in the first week of February from 18.342 million the prior week. This grand total is not seasonally adjusted. (…)

- House Poised to Pass Stimulus as Minimum Wage Hike Dealt Blow
- Costco to Lift Minimum Hourly Wage to $16
U.S. Durable-Goods Climbed 3.4% in January New orders posted ninth straight month of gains and the largest percentage increase since July 2020
New orders for nondefense capital goods excluding aircraft—or so-called core capital-goods orders, a closely watched proxy for business investment—increased 0.5% in January from the previous month, to $72.9 billion. The gain was smaller than in recent months.
Excluding transportation, a category that can be particularly volatile, overall durable-goods orders increased 1.4% in January, down from a 1.7% gain in December.
The gains were pronounced in aircraft orders. New orders for defense aircraft and parts rose 63.5% in January after a drop of 1% the previous month. New orders for nondefense aircraft and parts shot up by 389.9% after a 56.7% decline the month before.
On a monthly basis, new orders are way above past cycle highs…

…thanks to the rebound effect. Looking at annual data, full year 2020 core new orders are up 1.6% while shipments are up only 0.2%. Manufacturing employment declined 5% in 2020 and was still down 4.5% YoY in January. Weekly hours worked in manufacturing declined 1.9% in 2020 but are up 0.2% YoY in January. Still, at 41.5, average weekly hours are way below the 42.1 level reached in mid 2018.

- Tesla Temporarily Halted U.S. Production Over Parts Shortage Elon Musk says car maker paused activity at its U.S. plant because of parts shortages but has restarted operations.
In a Flash, U.S. Yields Hit 1.6%, Wreaking Havoc in Markets
(…) “You put too many coals on the fire and we build the fire to a very intense level. People start to think the Fed won’t be able to keep rates where they are.” (…)

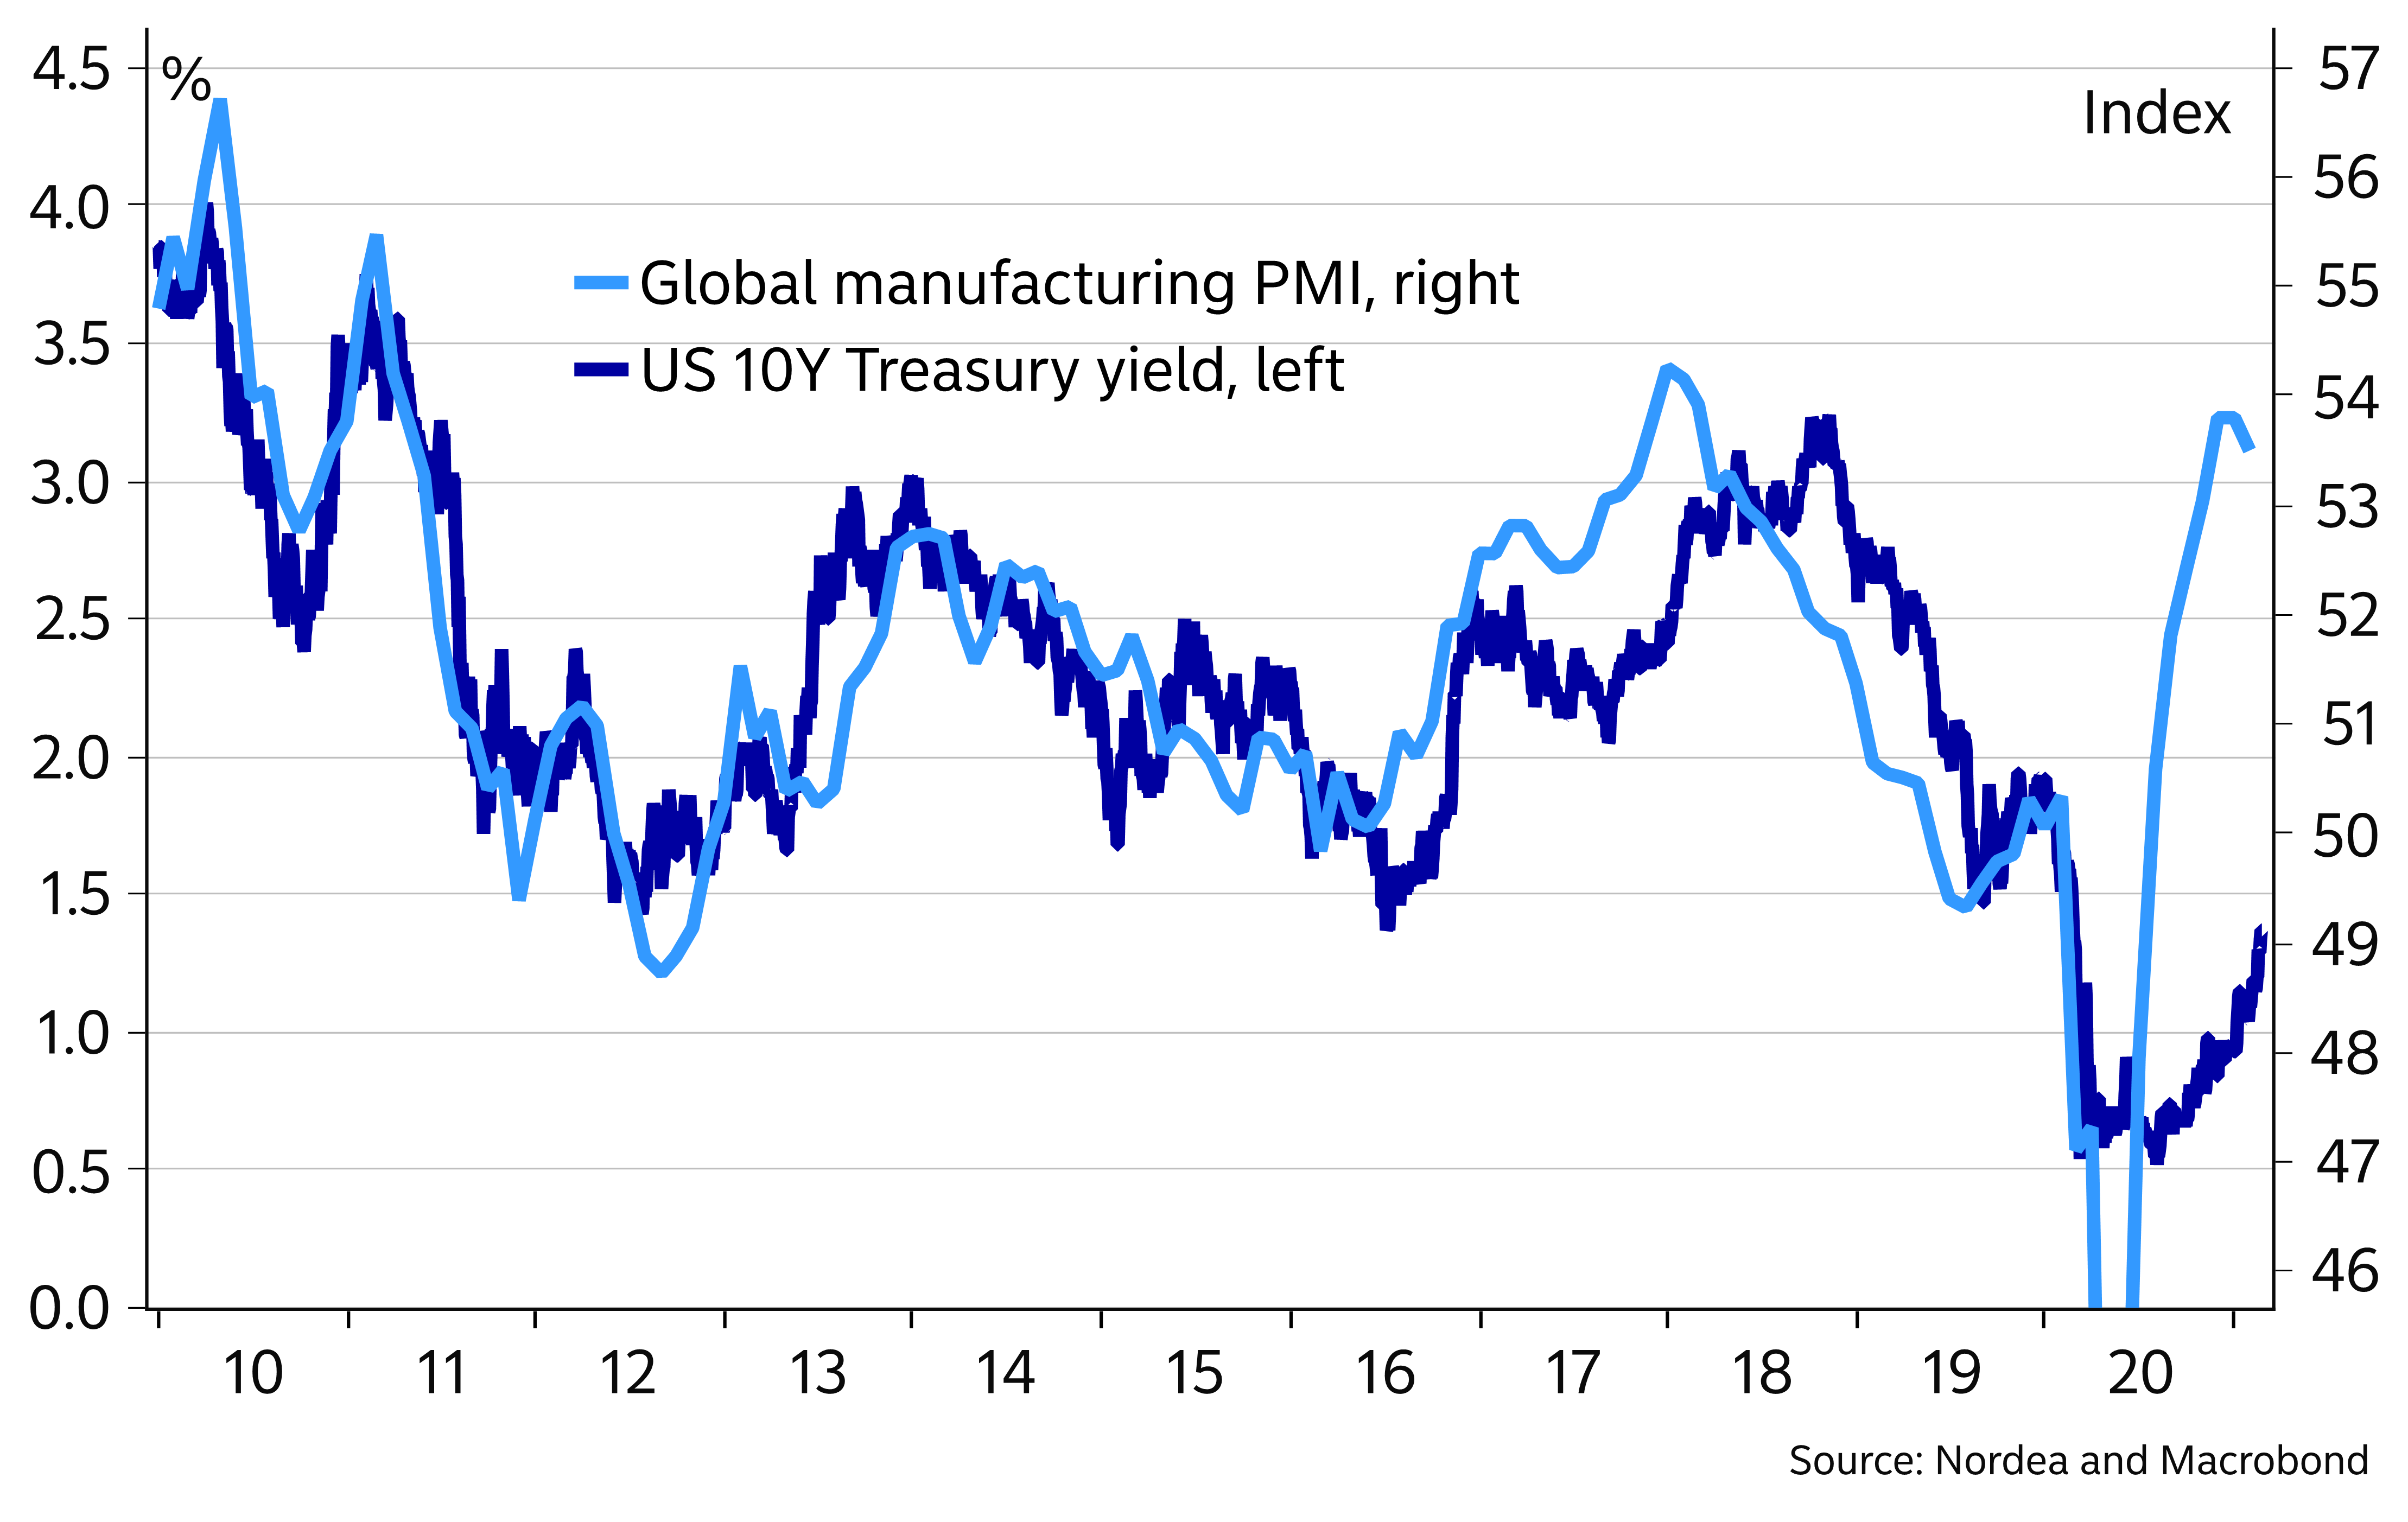
The general macro environment already suggests yields should be much higher (Nordea)
John Authers: Bond Tantrum Is a Big Test of Central Banks’ Mettle It’s their move now. They can win if they really want to.
(…) Yields are rising, especially in the often overlooked “belly” of the curve, between the closely observed two- and 10-year maturities. An unsuccessful auction of seven-year Treasuries certainly didn’t help, but the trend through the day was inexorable. This is what happened to the five-year Treasury yield:
Beyond the belly, however, which saw most action on Thursday, there has been a move away from duration, the technical term for bonds whose returns are most sensitive to changes in interest rates. Austria’s “century bond” issued in 2017 and not repaying its principal until 2117 is widely taken as the ultimate benchmark for duration; this is what has happened to its price:
(…) It isn’t evident that central banks need be too uncomfortable with yields at current levels, which remain low. But their success in quashing seemingly all activity in the bond market seems to be over. (…)
Higher U.S. rates are generally held to be bad news for emerging markets, as they attract flows away from the sector, and also tend to strengthen the dollar. That in turn can weaken emerging markets that are particularly reliant on dollar-denominated debt. (…)
The great concern is the impact that further rises in bond yields could have on other asset classes, especially U.S. equities and emerging markets. There is one great prior example of a bond market “tantrum,” which followed comments by then Fed Chairman Ben Bernanke about “tapering” bond purchases in May 2013. (…)
The reason yields aren’t much higher already is that markets assume central banks will act to keep them under control. Lagarde, Jerome Powell and a battalion of other central bank governors have all made that clear over the last week. (…)
For developed stock markets, the question is whether a spike in bond yields can upset valuations. Tech, which has benefited tremendously from the conditions of the last year, is obviously the source of greatest concern (although to be fair, investors are sitting on fat profits in the sector). SocGen’s Edwards, a well-known bearish commentator, offers this chart, which is an update of research by Dhaval Joshi of BCA Research. Over the last five years, the MSCI World as a whole has shown a tendency to hit a plateau and decline when tech earnings yields drop too far compared to 10-year Treasury yields. That choke point was passed a week ago, and has been followed with this week’s exciting events:
This is decent evidence that bond yields have reached a high enough level to thwart further advances in the stock market. It isn’t yet clear that they would on their own drive a major fall. (…)


And the Fed says:
Fed Officials Upbeat on Outlook, Bond Yield Rise Not Source of Concern Federal Reserve officials said they continue to see the U.S. economy in recovery mode, with several noting they aren’t concerned about the recent rise in long-term bond yields and see no need to use monetary policy to push against it.
(…) Long-term bond yields “have definitely moved at the higher end, the longer end, but right now I’m not worried about that,” Federal Reserve Bank of Atlanta President Raphael Bostic told reporters Thursday. When it comes to Fed actions that could counter higher yields, “I’m not expecting that we’ll need to respond in terms of our policy,” Mr. Bostic added. (…)
The main way the Fed would counter a rise in yields would be to increase its $120 billion a month in Treasury and mortgage bond buying, or the central bank could change the mix of securities it buys. Either approach would seek to cap a rise in yields and in theory limit the danger it chokes off a nascent recovery.
Fed officials, however, say current yield levels are only returning to where they were before the pandemic struck a year ago, and that borrowing costs on balance remain quite low. They also see rising yields as a natural development given the economy’s improving prospects.
“I think that the rise in yield is probably a good sign so far, because it does reflect a better outlook for U.S. economic growth and inflation expectations” that are converging on the Fed’s 2% target, Federal Reserve Bank of St. Louis President James Bullard told reporters Thursday. “That naturally, to me, suggests that yields should be somewhat higher than they would have otherwise been.”
Federal Reserve Bank of Kansas City President Esther George said she also wasn’t worried about a rise in long-term yields, noting she sees the increase as a sign investors are confident the economy is set to recover strongly. (…)
How much do mortgage rates need to rise to kill this market?

The Fed is facing its worst predicament yet. The current fiscal spending path will lead to record Treasury issuance this year. Foreign investors are unlikely to be the ones funding this operation. With 2020 as a guide, there are no buyers of any size for those securities outside of US banks and the Fed. Major foreign holders of US debt only bought about 5.2% of all Treasuries issued last year. In the face of this enormous new government debt issuance, the Fed faces the impossible task of continuing to prop up already historic asset bubbles while also preventing inflation. The current extreme fiscal imbalances put the central bank on a crash course to fail at both.
(…) the government had to issue $4.4 trillion of net new debt in 2020 to fund these programs. The Fed purchased $2.4 trillion of these Treasuries, or 54% of the total issuance, which equates to an average of $197 billion per month. This year, the Fed has announced that is committed to purchasing just $80 billion per month, but with fiscal spending likely to be significantly higher, it is simply not credible that the Fed is going to buy 60% fewer Treasuries than it did last year. The math does not add up.
The Biden administration is now planning on a two-stage stimulus package: rescue and recovery. The “rescue” will be close to $1.9 trillion which needs signing in the coming weeks before unemployment benefit programs are exhausted of money. The “recovery” part, still being discussed, could be as large as $3 trillion. That puts Biden’s rescue and recovery package cost close to $4.9 trillion for the American taxpayers, compared to the $3.1 trillion that was passed in 2020. In our analysis, the Fed will need to substantially increase its planned quantitative easing. By our math, the level of QE this year that will be necessary to stop interest rates from rising appears to be closer to $300 billion per month than the planned $80 billion. (…)
![]() “And I know it must be time to buy long-dated Treasuries at these levels because, quite frankly, the market has made me feel as stupid today as I was in the winter of 2000, the summer of 2007 and the fall of 2013.” (David Rosenberg)
“And I know it must be time to buy long-dated Treasuries at these levels because, quite frankly, the market has made me feel as stupid today as I was in the winter of 2000, the summer of 2007 and the fall of 2013.” (David Rosenberg)
Rosie also posted 2 charts showing that bond sentiment is at a 13-month low with a RSI reading “oversold”.
Meanwhile, the rout continues:

REFLEXIVITY?
Cathie Wood’s Main ETF Slips Again After $4.9 Billion Asset Drop
The ARK Innovation ETF (ticker ARKK) was down more than 3% in pre-market trading as of 6:28 a.m. in New York. The fund has lost 15% this week through Thursday, amid a tech selloff triggered by rising bond yields, which is putting pressure on pricier stocks.
The last time Ark founder Cathie Wood suffered a run this bad was almost a year ago, during the worst of the Covid-fueled mayhem. Her main fund is now 11 times larger than it was a year ago.
Assets in the ETF have slumped by $4.9 billion this week to $23.3 billion, according to data compiled by Bloomberg. That figure doesn’t include flows from Thursday, when ARKK dropped 6.4% for its worst day in six months. (…)
Bets on the ETF to decline continue to grow. Short interest now accounts for more than 4% of available shares, according to data from IHS Markit Ltd.


“IRRITATING BUBBLE”
As for SPACs, or special purpose acquisition companies, Munger said he thinks “the world would be better off without them,” adding that this “crazy speculation in enterprises not even found or picked out yet, is a sign of an irritating bubble.”
“It’s just that the investment banking profession will sell s— as long as s— can be sold,” Munger said.