
 The Great Debate Gets Resolved This Week, Maybe
- Poll: Economists Say Fed Will Stand Pat in September
- El-Erian Says Rate Move Close Call as Bonds Suggest Fed to Wait
- Markets read the Fed rate runes Interest rate futures indicate 28% chance of a rise this week
- Fed eyes markets as it mulls rate rise
- Fed guidance splits markets over rate rise
Conflicting messages from a divided body of Fed officials mean futures traders are betting against the possibility of a rate increase, while nearly half of economists surveyed by Bloomberg expect the Fed to pull the trigger next week. Other analysts think the US central bank could hold steady until 2016.
- Shenzhen Composite leads China sell-off Index falls 6.7% in worst session since August 25
 Fears grow over US stock market bubble Nobel laureate Robert Shiller highlights risks of overvalued stocks
A growing number of investors believe that US stocks are overvalued, creating the risk of a significant bear market, according to research by Yale University market scholar Robert Shiller.
The Nobel economics laureate told the Financial Times that his valuation confidence indices, based on investor surveys, showed greater fear that the market was overvalued than at any time since the peak of the dotcom bubble in 2000.
“It looks to me a bit like a bubble again with essentially a tripling of stock prices since 2009 in just six years and at the same time people losing confidence in the valuation of the market,†he said.
However, he made clear that it remained impossible to time any fall in the market, and cast doubt on whether stocks would drop should the Federal Reserve raise rates later this week.
“I’m not looking for any big effect,†he said. “It’s been talked about for so long, everyone knows that it’s coming. It’s just not much of a big deal.†(…)
From Yale’s web site:
Confidence in the valuation of the market trended downward for both individual and institutional investors between 1989 and 1999. The extreme low in Valuation Confidence was reached in 1999 (29.03% for institutional investors and 31.17% for individual investors), our last survey before the peak in the stock market in 2000, and this may have been a significant source of downward instability in the market that helped bring on the market crash after 2000. This downtrend in confidence was reversed after the peak in the stock market in early 2000, and confidence was soon back to levels typical of the 1990s. After the 2000 crash in the stock market, and until around the October 2002 post-peak low in the market, Valuation Confidence rose rapidly. Valuation confidence reached 79.85% as of October 2003 for institutional investors and 78.92% as of January 2003 for individual investors. Valuation confidence reached a peak around market lows shortly after the Lehman crisis in late 2008, but dropped sharply as the market catapulted upwards into after spring 2009, both for individual and institutional investors.
![]() The uneasiness on valuation does not translate in much lower one-year confidence from same investors:
The uneasiness on valuation does not translate in much lower one-year confidence from same investors:
Freight Shipment Volumes See Atypical (but Small) August Decline
The number of freight shipments fell 1.2 percent in August on the heels of a 1.2 percent decline in July. The August decline is a diversion from the normal pattern we see at this time of year. Generally, retailers are stocking up for fall sales, but high inventories and a rising inventory to sales ratio slowed ordering earlier this year. Inventory levels—for retail, wholesale and manufacturing—are well above the high point prior to the inventory drawdown at the beginning of the Great Recession. Inventories have been climbing during a period of low inventory carrying costs. Interest rates have been the lowest in recent history, warehouse space was
abundant and lease rates low, and taxes and insurance costs were flat.

From midâ€2010 to early 2014, the inventory to sales ratio, which measures inventory turnover, remained very steady around 1.27. It has risen 10 points in the last 18 months, an increase of 6.2 percent. The average for the last decade, including during the recession period, is 1.30.

![]() Santa better not be too frugal this year…
Santa better not be too frugal this year…
U.S. Producer Prices Unchanged as Inflation Remains Weak
The producer-price index, which measures the prices companies receive for goods and services, was unchanged in August after climbing 0.2% in July, the Labor Department said Friday.
Excluding the volatile food and energy categories, core prices rose 0.3% in August, the same pace as the prior two months. But much of that increase was due to a jump in the volatile trade-services category. (…)
Overall producer prices were down 0.8% in August from a year earlier, while core prices were up 0.9%.
The August figures reflect a divergence between higher prices for services and weaker prices for goods. Producer prices for services rose 0.4% last month, due primarily to a volatile measure of margins at apparel, footwear and accessories retailers, “presumably because the falling dollar has depressed wholesale import prices but retail prices have yet to respond,†Pantheon Macroeconomics Chief Economist Ian Shepherdson said in a note to clients.
Meanwhile, prices for goods fell 0.6%, two-thirds of which was due to lower gasoline prices, which posted their biggest decline since January.
Interestingly, PPI for Intermediate Demand-Processed Goods fell 0.6% in August after falling 0.2% in July, erasing the 0.7% June gain. This series is down 7.0% YoY.
CHINA
China Data Cast Doubt on Beijing’s Growth Target Two Chinese economic reports gave a glimpse of the challenge for Beijing in reaching its full-year growth target of about 7%.
(…) China’s industrial production grew 6.1% year-over-year in August, according to the National Bureau of Statistics. While this was marginally faster than July’s 6.0% level, it compared with an already very low reading in August of 2014 and fell well below a median 6.6% forecast by 12 economists in a Wall Street Journal survey.
Fixed-asset investment in nonrural areas of China rose 10.9% in the January-August period compared with the year-earlier period. This was also below expectation and slower than the 11.2% increase recorded in the January-July period.
Retail sales in China increased by a better-than-expected 10.8% year-over-year in August, accelerating from a 10.5% year-over-year increase in July. (…)
Housing sales rose 18.7% in the first eight months of the year, while real-estate investment rose 3.5% from January to August, down from double-digit levels recorded in recent years, the statistics agency reported. (…)
At a meeting of global business leaders in northeast China last week, Premier Li said achieving 7% growth in the first half “has not been easy†but added that systemic risk has abated and the economy remains on track to meet all major targets this year.
Nevertheless, in issuing Sunday’s data, the statistics bureau warned of continued headwinds. “The foundation for the recovery is not solid,†it said on its website. “External and internal demand for industrial products remains weak and industrial production still faces relatively big downward pressure.â€
CHINA FACTS
From Andy Rothman (Matthews Asia)
- Inflation-adjusted (real) retail sales rose 10.4% YoY in July, compared to 10.5% a year ago.
- New home sales (by square meters) rose 21% YoY in July, up from 16% in May and from a decline of 18% in July 2014.
- Passenger car sales slumped, down 7% in July, but SUV sales jumped 34%, on top of a 25% rise in July 2014.
- Apparent consumption of gasoline rose 10% in July, compared to a decline of 1% a year ago.
- Movie box office revenues rose 54% in 2Q15, compared to 21% in 2Q14.
- Chinese visitor arrivals in Japan rose 105% YoY in July, and, according to Japanese government data, Chinese spend twice as much as other visitors.
- Express parcel deliveries rose 47% YoY in July, up from 44% in May and compared to 49% last July. Illustrating the boom in online shopping, 10 billion packages were delivered during the first seven months of the year.
This is likely to be the third consecutive year in which services and consumption will be larger, and contribute more to China’s GDP growth, than manufacturing and construction. In the first half of this year, consumption accounted for 60% of GDP growth.
BTW: Bloomberg’s monthly China gross domestic product tracker was at 6.64 percent last month, barely changed from July.
BIS Highlights Trouble Spots for Global Economy Consortium notes risks of weaker Chinese growth, strong U.S. dollar for emerging markets
(…) “We are not seeing isolated tremors, but the release of pressure that has gradually accumulated over the years along major fault lines,†said BIS chief economist Claudio Borio. (…)
Another risk, Mr. Borio noted, is a slowdown in international lending to emerging-market economies, which could make it harder for those countries to finance large stockpiles of dollar-based debt, including corporate debt which has grown rapidly in recent years. When the dollar rises in value, it makes debt denominated in the U.S. currency more expensive to finance.
(…) the amount of dollar-denominated loans to borrowers in emerging markets, excluding banks, has nearly doubled since 2009 to more than $3 trillion.
“Much of it has found its way to corporates, raising serious questions about the financial vulnerabilities involved and the implications for self-reinforcing movements in exchange rates and credit spreads,†Mr. Borio said. (…)
Mr. Borio repeated warnings the BIS has made in recent years that financial markets have become too dependent on monetary policy to address the economic burden of weak productivity and high debt.
“This is also a world in which interest rates have been extraordinarily low for exceptionally long and in which financial markets have worryingly come to depend on central banks’ every word and deed, in turn complicating the needed policy normalization,†he said.
“It is unrealistic and dangerous to expect that monetary policy can cure all the global economy’s ills.â€
Has The Asian Currency Collapse Run Its Course?
The past four months have seen an unprecedented divergence in the performance of developed market and emerging market (EM) currencies, with Asian units getting sucked into the EM downdraft even though their manufacturing-heavy economies should, on paper, be beneficiaries of the commodity collapse. Or to be more specific the more than 10% decline in Asian currencies against the euro over the last four months has been a near two standard deviation event.

The question is whether the Asian currency rout is simply the result of the large scale redemptions hitting emerging market bond and equity funds. Or is it a more fundamental problem rooted in their ability to service debts? In the former case, the current panic offers an interesting buying opportunity, while in the latter scenario, Asian currencies, and asset prices, are probably not done falling.
In the floating exchange rate era, solvency crises have tended to come in two varieties, namely (i) a current account crisis which arises when foreign investors tire of giving hard currency in return for paper issued by profligate governments, or (ii) a banking crisis which usually stems from a money-market-funded property bubble that leaves banks which have excessively borrowed short, to lend long, horribly exposed.
In the first instance, the only real option is for a country to devalue its currency and restructure its foreign debt, while in the second case banks need to be recapitalized quickly, or a panic ensues. Clearly China (the current center of concern) does not face a current account crisis as it has run large surpluses, has US$3.56trn of currency reserves and the government has not borrowed much from foreigners. Instead, China fears have centered on the possibility of a banking crisis, even if, on closer inspection, China does not really fit the classic banking boom-bust paradigm. For a start, property prices seem to have stabilized (from their very high levels in 2013) without causing undue financial system stress. This may be because banks did not borrow much from money market funds as the domestic deposit base is still so big. Or it may be because banks are largely state owned, and so did not incur panicked withdrawals?
This reality brings us to the key argument for a true China crisis: the fear that Chinese investors and bank depositors will, en masse quit their currency and their country through a massive exodus of Chinese capital that will overwhelm attempts by the People’s Bank of China (PBOC) to maintain exchange rate stability. Nothing is impossible, but we think this a low probability scenario for the following reasons:
The math does not really add up. Most Chinese investors can get around 5% on low risk wealth management products. Thus, quitting China would mean forgoing this yield and paying currency transaction charges of 3-4%. To make the trade worthwhile, the average Chinese investor would have to be convinced that the renminbi will drop at least -10%, if not more.
- On the whole investors do not quit their country. For the last decade we have heard doomsday scenarios on how the Japanese were set to quit Japan and so drive JGB yields to 10% or more. This never happened. Or look at the recent Greek debacle when bank deposits reached €240bn in 2008. After five years of crisis and depression, that level by late 2014 still stood at €175bn! If nothing else, this proves Charles’ dictum that one is more likely to change spouses than to change banks!
- On balance we thus think the higher odds scenario is that the PBOC is successful over the coming weeks and months at holding the renminbi to the 6.40-6.50 line against the US dollar, even as foreigners liquidate renminbi exposure and hedge funds pile on the shorts on a “tail risk†bet that Beijing could resort to a -15% or more devaluation.
So assuming the PBOC does manage to hold the line, let us fast forward to November, and assume that the renminbi is accepted into the International Monetary Fund’s special drawing rights basket. The market will likely be forced to acknowledge that while China has slowed hard, the economy is not falling apart thanks to a rebound in real estate prices, rising wages, stronger consumption and a service sector that continues to expand. The fact that China’s trade surplus will have likely moved from US$30bn a month to US$50bn a month will also raise eyebrows.
And at this point, most investors short the renminbi will wonder why they are involved in a heavily negative carry-trade whose fundamentals are not as bad as they had hoped, and for which the imagined catalyst never materialized. It will then be time to cover the renminbi shorts; which will mean buying back a currency that absolutely no one will own any longer, from the country running the largest trade surplus in the world. Let us hope that PBOC Governor Zhou Xiaochuan will then be as generous in helping the shorts exit their positions as he has been in recent weeks in helping the longs.
Eurozone Industrial Output Rises
The European Union’s statistics agency Monday said output from factories, mines and power stations during July was 0.6% higher than in June, and 1.9% up compared with the same month a year earlier, the strongest performance since February.
The pickup in industrial production in July was spread across most of the eurozone, with France the main exception, as output there fell 0.8% from June, data Monday showed. There was a very strong rebound in Greece after three months of decline, with output up 4.3% on the month, second only to Ireland’s 7.2% gain.
IP has been very erratic and country specific in Europe this year. July’s +0.6% only offset May-June’s –0.5% which followed Feb-April’s +0.5%. Last six months: +1.2% annualized (Germany: +1.2%, France: –3.2%, Italy: +4.0%, Spain: +7.0%) (Eurostat)

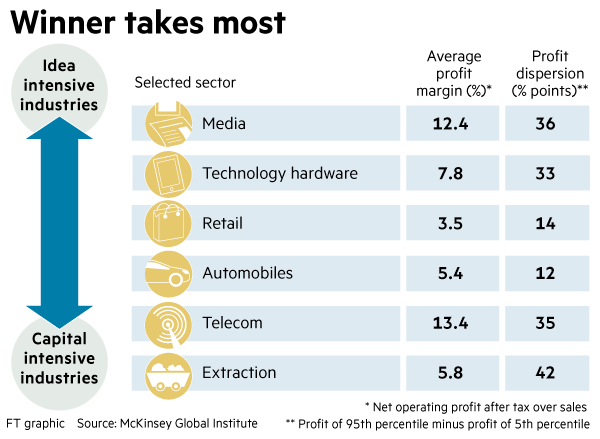
Corporate profits: the good times roll over A long-predicted downturn in profit margins may be about to start
(…) McKinsey, the consultancy, thinks that the fun is ending, wherever it came from. It cites labour’s growing mobility and negotiating power; demographics that will pinch sales growth; limited scope for further cost cuts; big emerging-market firms, more interested in growth than returns, undercutting competitors from developed countries; and tech companies upending industries with low-cost alternatives (think of Uber and the transport industry).
All this may prove true. But one wonders if predicting changes in global competitive dynamics is any different from the chancy business of predicting trends in technology or politics. The value of McKinsey’s work is in describing the changes that are happening now — in particular the way the profits are being distributed more and more unequally among companies in many different industries. That winners are taking more is increasingly clear; why that is so is a topic worth droning on about.
A New Worst Case for Oil
Analysts at Goldman Sachs Group Inc., known for its eye-popping oil-price predictions, said the benchmark U.S. oil price may have to tumble to as low as $20 a barrel—from current levels around $45—to clear out a global supply glut. (…)
While it has become increasingly clear in recent weeks that U.S. output is declining, market watchers are divided over how much the shale-oil boom will slow and how producers elsewhere will respond. Another wild card is Iran, which has said it will produce as much oil as it can if sanctions are removed. (…)
If production doesn’t decline as expected, available storage space for crude oil could fill up, meaning prices would have to immediately drop below the cost of production to prevent producers from pumping more oil. For some U.S. shale-oil producers, the cost of production is around $20 a barrel, according to the bank. (…)
OPEC Trims 2016 Estimates for Rival Supplies as U.S. Oil Suffers
The Organization of Petroleum Exporting Countries cut 2016 estimates for non-OPEC output by 110,000 barrels a day, its Vienna-based secretariat said Monday in its monthly market report. Still, the group sees non-OPEC supply expanding slightly next year, while the International Energy Agency on Friday predicted a contraction of 500,000 barrels a day, the biggest since 1992. Saudi Arabia told OPEC it curbed output in August to a six-month low.
“There are signs that U.S. production has started to respond to reduced investment and activity,†OPEC said in the report. “Indeed, all eyes are on how quickly U.S. production falls.†(…)
Supplies from non-OPEC nations such as the U.S., Canada, Russia and Brazil will increase by 160,000 barrels a day to 57.6 million in 2016, according to the report. In last month’s report, OPEC had projected that non-OPEC supplies would expand by 270,000 next year.
The organization reduced 2016 estimates for U.S. supply by 103,000 barrels a day, projecting the country’s total oil output at 13.97 million. (…)
As a result of the weaker outlook for non-OPEC supply, the organization increased projections for the amount of crude it will need to pump next year by about 200,000 barrels a day to 30.3 million. That’s still about 1.2 million less than the 31.54 million daily barrels its members produced in August.
Output from OPEC’s 12 members increased by 13,200 barrels a day in August, according to data the group compiles from media and other institutions. In separate data submitted directly by member nations, Saudi Arabia, the group’s biggest producer, reported that it cut production by 96,500 barrels a day to 10.265 million, the lowest level since February.
China to trumpet good news in GDP data
China’s economic data for September will not be collated until early next month, but the ruling Chinese Communist party has already decided they will bring cheering news.
“The focus for the month of September will be strengthening economic propaganda and . . . promoting the discourse on China’s bright economic future and the superiority of China’s system,†the party’s propaganda department said in a directive to national media outlets. (…)
A photograph of the latest directive was posted online by California-based China Digital Times, which monitors Chinese media and internet censorship. “They want to control how the media frames and interprets [economic data], making sure that they all focus on positive things,†said Xiao Qiang, CDT founder.
CDT also posted a notice from the chief editor’s office at the Xinhua news agency, dated September 7, that reiterated the need to “stabilise expectations and inspire confidenceâ€. The Xinhua notice instructed staff to “please plan related reporting†and send their story ideas to the agency’s Creative Planning Center.

Dick Grasso: Today’s Markets Aren’t Fair The former head of the New York Stock Exchange says modern markets have sacrificed fairness for speed.
“Frankly, some of the things that went on that day need very close scrutiny,†Mr. Grasso said in an interview Friday with the Journal. “A day like that, where Facebook’s shares go from $86 to $72 to $84 in a matter of minutes will cause the public to lose confidence in the markets.†(…)


