The enemy of knowledge is not ignorance, it’s the illusion of knowledge (Stephen Hawking)

It ain’t what you don’t know that gets you into trouble. It’s what you know for sure that just ain’t so (Mark Twain)

Invest with smart knowledge and objective odds

THE DAILY EDGE (15 June 2017)

U.S. Industrial Production Holds Steady While Factory Output Declines

Industrial production was unchanged last month (2.1% y/y) following a 1.1% April jump, revised from 1.0%. Manufacturing sector output declined 0.4% (+1.4% y/y) after a 1.1% increase, revised from 1.0%. Utilities output increased 0.4% (0.1% y/y). Mining output improved 1.6% (8.3% y/y), the  fourth month of strong increase this year.

Production of final products held steady (1.6% y/y) after a 1.6% jump. Consumer goods production rose 0.2% (1.2% y/y) after a 1.7% jump. Durable consumer goods output declined 0.7% (+3.8% y/y) after a 2.4% increase as motor vehicle output fell 1.0% (+5.8% y/y) following a 4.1% increase. (…)

Capacity utilization eased to 76.6% while factory sector utilization declined to 75.5%. Factory sector capacity rose a steady 0.7% y/y.

large image

image

Philadelphia Fed Factory Conditions Index Falls Sharply

The Philadelphia Federal Reserve reported that its General Factory Sector Business Conditions Index declined to 27.6 during June and reversed most of May’s jump to 38.8 in May.

The ISM-Adjusted General Business Conditions Index constructed by Haver Analytics fell slightly to 57.9 this month. This figure is comparable to the ISM Composite Index. During the last ten years, there has been a 71% correlation between the adjusted Philadelphia Fed Index and real GDP growth.

The decline in the overall index reflected a sharply lower shipments reading. That was accompanied by higher figures for new orders, unfilled orders, inventories and a higher delivery time index, which indicated the slowest delivery times since 2004.

The employment series eased to the lowest level since February. During the last ten years, there has been an 81% correlation between the jobs index and the m/m change in manufacturing sector payrolls. The average workweek reading slipped but remained near the March 2004 high.

Prices paid declined to the lowest level since October. Twenty-eight percent of respondents (NSA) reported paying higher prices, while four percent paid less. The prices received index increased to the highest level in three months.

large image
U.S. Housing Starts Fall for Third Consecutive Month in May U.S. housing starts decreased for the third consecutive month in May, a sign home builders are struggling to meet buyer demand.

Housing starts dropped 5.5% in May from the prior month to a seasonally adjusted annual rate of 1.092 million, the Commerce Department said Friday. This figure carries a margin of error of 11.9%.

Residential building permits, an indication of how much construction is in the pipeline, fell 4.9% to an annual pace of 1.168 million last month, the agency said. (…)

Starts fell in May for single-family and multifamily construction. Permits last month were down 10.4% for buildings with multiple units and down 1.9% for single-family homes.

Data on housing starts tend to be volatile from month to month and can be subject to sharp revisions. Looking past month-to-month fluctuations, starts in the first five months of the year were up 3.2%. Permits during this period increased 5.5%.
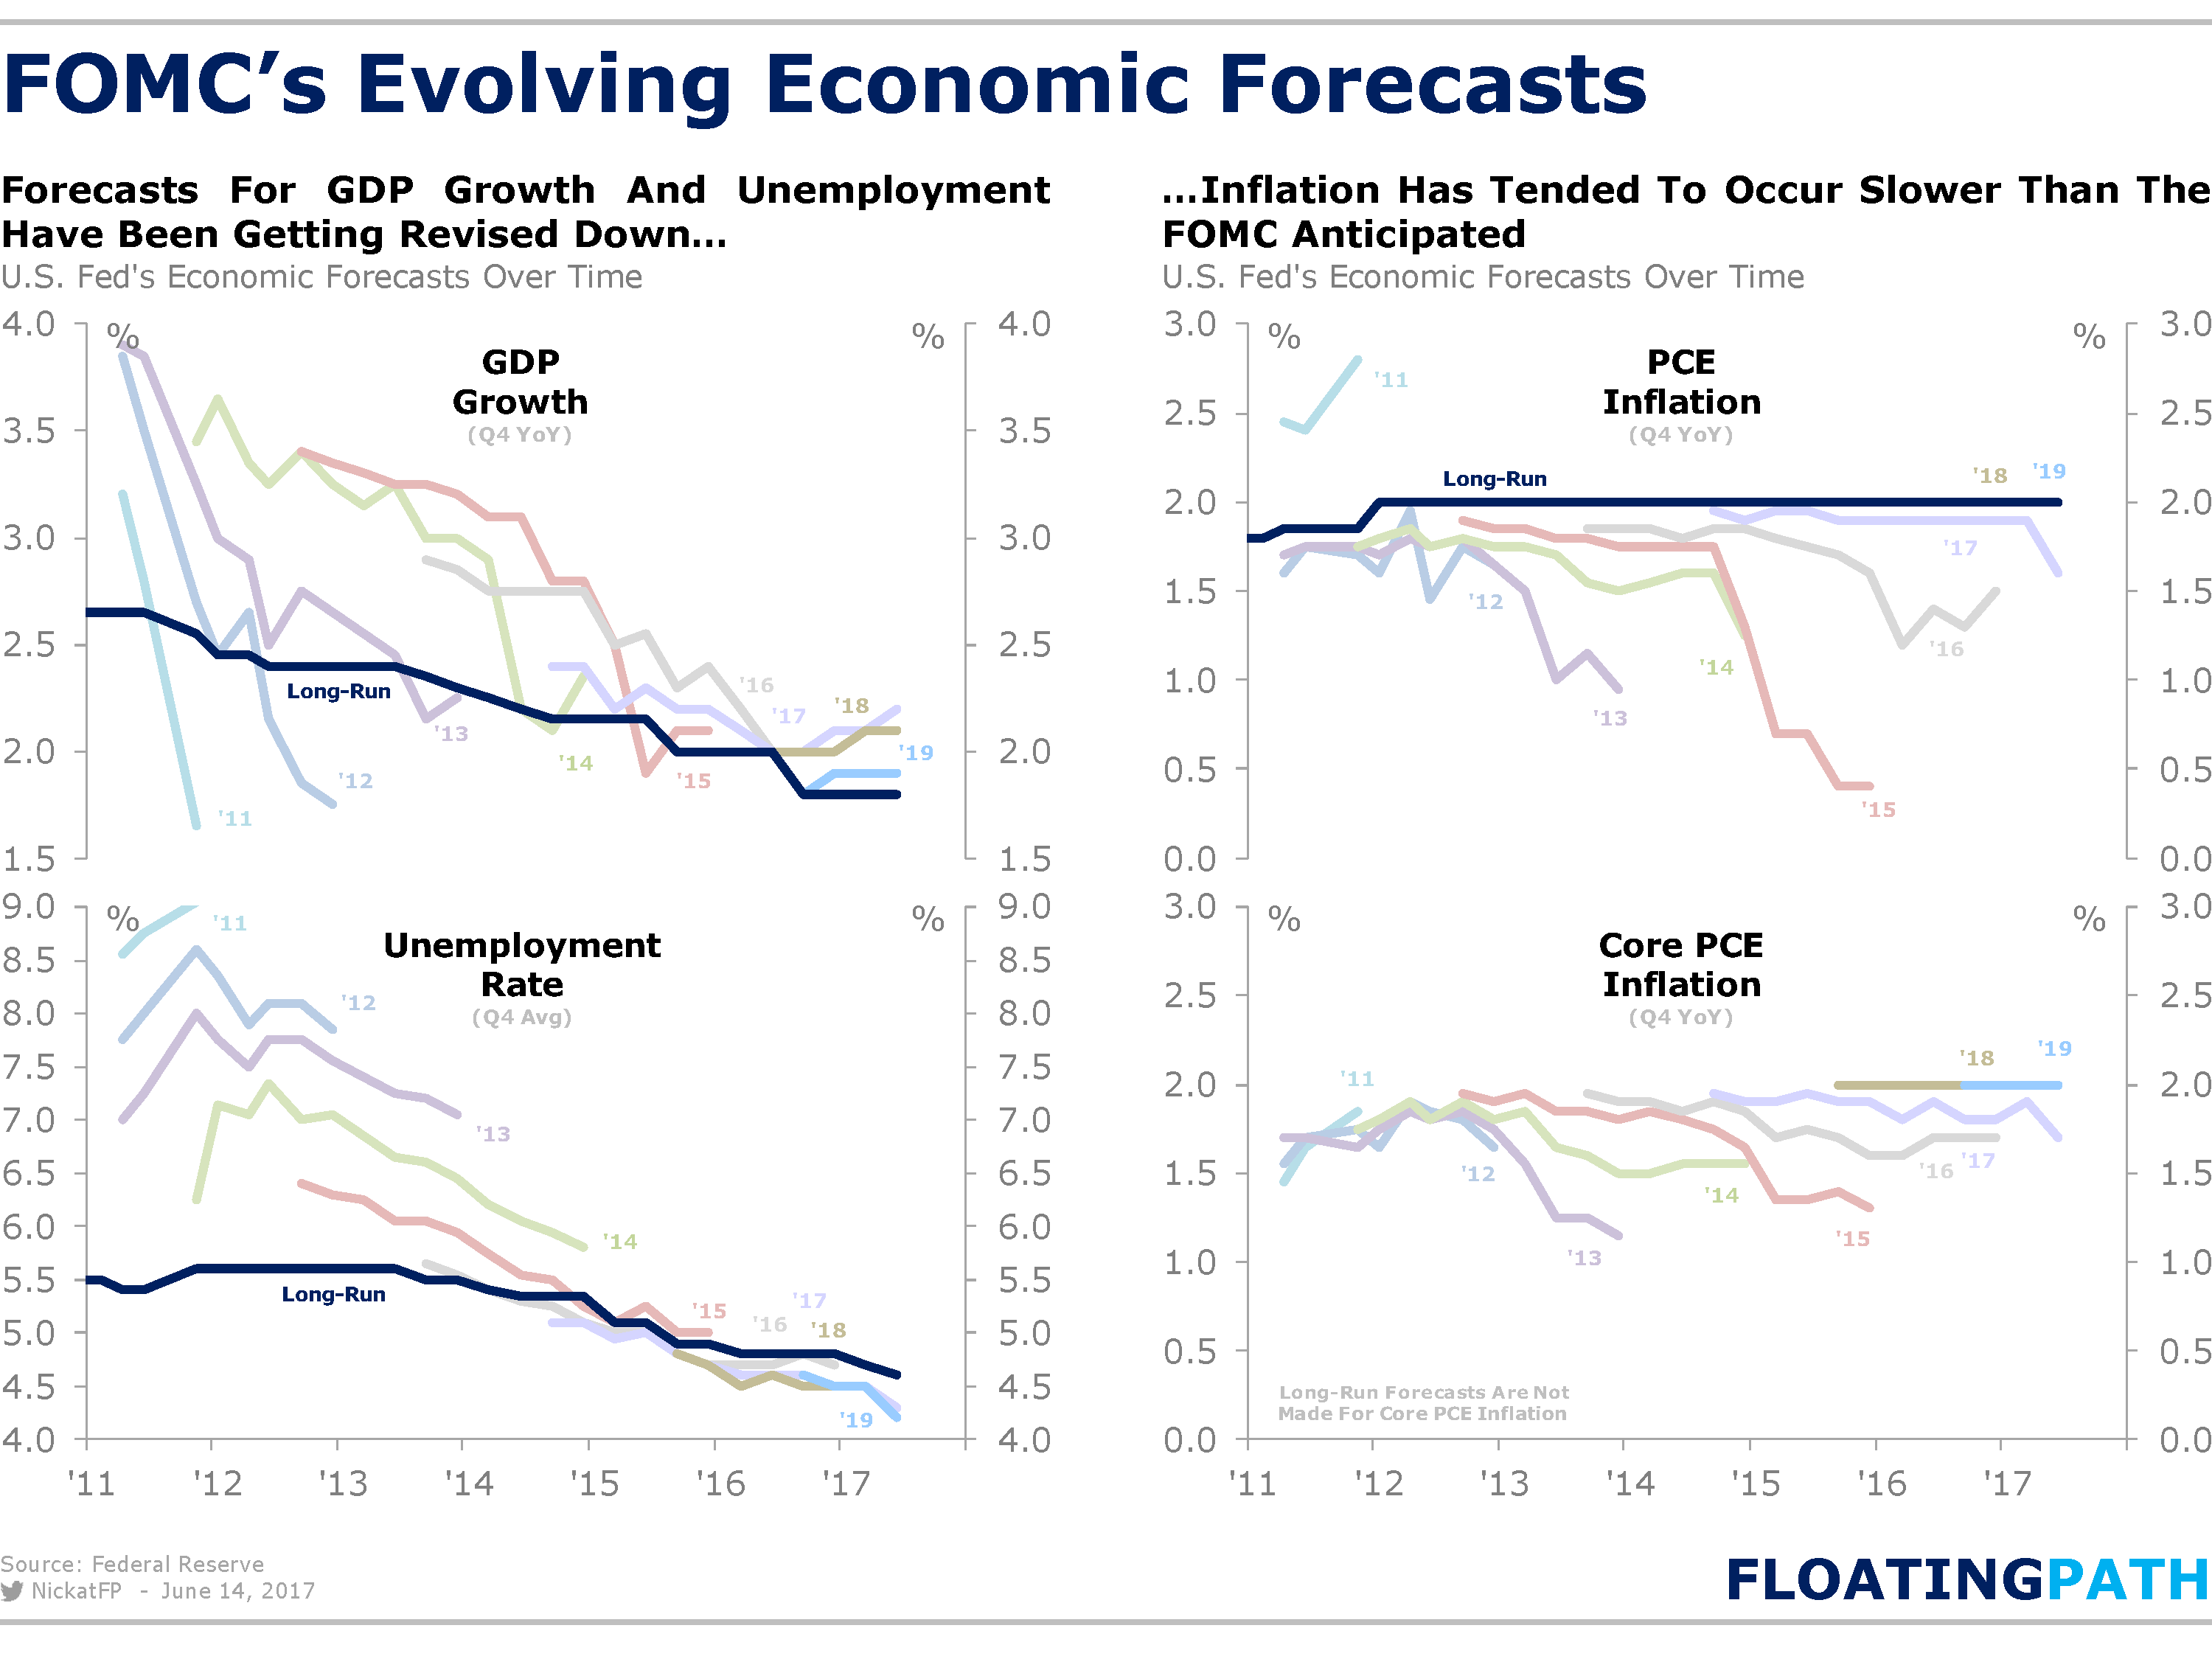
FED UP?

The Fed’s credibility is under assault from a lot of pretty smart people. This is from Robert Kessler:

Yesterday, the Federal Reserve’s statement added another contrary indicator suggesting the end of the expansionary cycle; their avoidance of economic weakness. Going back 10 years, in June of 2007, US Treasury yields had begun to drop precipitously after 100 bonds were downgraded by S&P; the latest sign of the burgeoning sub-prime crisis. In the midst of this, the Fed’s 6/28/2007 statement characterized the economy this way,

“Economic growth appears to have been moderate during the first half of this year, despite the ongoing adjustment in the housing sector. The economy seems likely to continue to expand at a moderate pace over coming quarters. Readings on core inflation have improved modestly in recent months. However, a sustained moderation in inflation pressures has yet to be convincingly demonstrated. Moreover, the high level of resource utilization has the potential to sustain those pressures. In these circumstances, the Committee’s predominant policy concern remains the risk that inflation will fail to moderate as expected. Future policy adjustments will depend on the evolution of the outlook for both inflation and economic growth, as implied by incoming information.”

No sense of any trouble, just worries about inflation. And yesterday, the Fed’s statement read (in-part),

“Information received since the Federal Open Market Committee met in May indicates that the labor market has continued to strengthen and that economic activity has been rising moderately so far this year. Job gains have moderated but have been solid, on average, since the beginning of the year, and the unemployment rate has declined. Household spending has picked up in recent months, and business fixed investment has continued to expand.”

No acknowledgement of the weakness we have seen in a whole bevy of indicators missing their expectations (Citi Surprise Index). A lot of us could see the storm coming in 2007 just as we do today. Don’t mistake the Fed’s statement for an all-clear on the economy. It is likely just the opposite. Echoing this sentiment are three articles in the newspapers today with a similar topic:

  1. Wall Street Journal Fed Moves One Way, Inflation Another
  2. Financial Times The Fed can only ignore the lack of inflation for so long
  3. Financial Times Investors wary of Fed’s newfound assertiveness

ECB next?

Eurozone employment rises to record high as economic recovery gains strength

Employment rose 0.4% in the first quarter, according to Eurostat, in line with survey evidence which also suggests the rate of job creation has accelerated further in the second quarter. PMI data showed private sector employment growing at one of the fastest rates for a decade in May, with manufacturing jobs being created at a pace not previously seen in the 20-year survey history.

The surveys show jobs are being created across all major euro member states, albeit led by Germany.

Industrial production meanwhile rose 0.5% in April, indicating a strong start to the second quarter. The upturn in official production data also tallies with PMI data, which have indicated a strengthening recovery of eurozone manufacturing in recent months. The IHS Markit Eurozone Manufacturing PMI rose to a 73-month high of 57.0 in May, up from 56.7 in April.

Eurozone industrial production

Official data now show the single currency area growing 0.6% in the first quarter, up from a prior estimate of 0.5%. The faster growth is in line with the signals from the PMI surveys, which had been indicating a 0.6% expansion as far back as February.

The first quarter expansion is no aberration. In fact, running at six-year highs, the PMI readingsfor April and May suggest that the rate of GDP growth will have picked up further in the second quarter, rising to 0.7%.

Money The weak euro appears to be providing a major stimulus to the manufacturing sector.

The Eurozone Manufacturing PMI survey’s new export orders index has been hitting six-year highs in recent months. A ranking of PMI export orders growth in May showed euro member nations dominating the global leader board, holding seven of the top eight places.

European PMI sector data meanwhile add to signs that business investment is rising strongly in the second quarter. Output growth in capex bellwethers such as machinery & equipment, technology equipment and construction & engineering have all seen marked upturns in recent months, with growth accelerating especially sharply in the tech sector to a near-record pace in May. The latter was also the fastest growing sector covered by the PMI, with machinery & equipment manufacturing in third place.

Employment, exports, investment and economic output all therefore appear to be growing at increased rates in the second quarter, representing an encouragingly sustainable-looking upturn.

THE DAILY EDGE (15 June 2017)

U.S. Retail Sales Decline; Nonauto Sales Weaken

Still strong overall:

image

U.S. Consumer Prices Down 0.1% in May

Excluding the often-volatile categories of food and energy, so-called core prices rose only 0.1% from April.

From a year earlier, consumer prices rose 1.9%, the third straight month annual gains have eased and the lowest reading since November. Prices were up 1.7% on the year when excluding food and energy, the weakest mark in two years. (…)

Food prices climbed 0.2% last month and were up 0.9% from a year earlier.

Shelter costs—which account for about a third of the overall price index—increased 0.2% on the month and rose 3.3% on the year.

Elsewhere, inflation was weak. Monthly prices fell for apparel, airfare, communication and medical care services, the Labor Department said.

A separate Labor Department report showed average weekly earnings for private-sector workers, adjusted for inflation, increased 0.3% in May from the prior month. From a year earlier, inflation-adjusted weekly earnings were up 0.6%.

Haver Analytics’ rundown is pretty telling about demand:

  • Prices for goods excluding food & energy declined 0.3% (-0.8% y/y), down for the fourth straight month
  • Recreation goods costs eased 0.2% (-3.7% y/y) after a 0.5% decrease..
  • Apparel prices fell 0.8% (-0.9% y/y), down for the third straight month.
  • Prices for household furnishings & supplies fell 0.2% (-1.4% y/y), down for the fourth straight month.
  • New vehicle prices edged 0.2% lower (+0.3% y/y), the fourth consecutive monthly decline.

On the other hand, services prices remain firm, likely due to wage cost pressures:

  • Services prices less energy increased 0.2% (2.6% y/y), the strongest change in three months.
  • Transportation services prices rebounded 0.3% (2.9% y/y) following a 0.2% fall.
  • Shelter costs rose 0.2% (3.3% y/y) following a 0.3% gain. Rent costs improved 0.2% (3.4% y/y) and the owners’ equivalent rent of shelter prices rose 0.2% (3.3% y/y), the same as in three of the prior four months.
  • Recreation services prices improved 0.1% (3.1% y/y) following no change.
  • But medical care services prices dipped 0.1% (+2.5% y/y) following one month of stability. Education & communication services prices held steady (-2.3% y/y) following three months of decline.

Prices for energy products fell 2.7% (+5.4% y/y), the third decline in four months. Gasoline prices were off 6.4% (+5.8% y/y), also the third decline in four months. Fuel oil prices declined 2.5% (+10.4% y/y), but natural gas prices jumped 1.9% (12.8% y/y). Electricity costs rose 0.3% (2.7% y/y).

 large image large image

According to the Federal Reserve Bank of Cleveland, the median Consumer Price Index rose 0.2% (2.2% annualized rate) in May. The 16% trimmed-mean Consumer Price Index rose 0.1% (1.2% annualized rate) during the month.

A big gap has developed since March between the median and the trimmed-mean CPI. The outliers are on the weak side:

image

Displaying

The U.S. auto industry is bracing for a long, slow summer

General Motors Co. will extend its traditional seasonal shutdown at certain U.S. factories to deal with slumping sales and bloated inventory, the WSJ’s Mike Colias reports, the latest sign that the industry is shifting into a lower production gear. That’s tough news from a field that’s provided the U.S. industrial sector much of its engine power in recent years but now is clearly pulling back. U.S. car sales, after hitting a record in 2016, have fallen nearly 2% over the past three months and automobiles are piling up at dealer lots. GM, with its inventory almost 44% higher from a year ago, will idle a factory near Kansas City, Kan., for five weeks starting this month, and may face more job cuts. Auto-related shipments at U.S. railroads are down nearly 5% this year through May and the downshifting at factories suggest the traffic won’t pick up anytime soon. (WSJ)

Surprised smile The stream of negative economic surprises sent the Citi US Economic Surprise Index to a two-year low. (The Daily Shot)

Fed Lays Out Plan to Unwind Years of Asset Purchases The Federal Reserve said it would raise short-term interest rates and spelled out in greater detail its plans to start slowly shrinking its $4.5 trillion portfolio of bonds and other assets this year.

Fed Raises Rates, Sets Out Plan to Shrink Holdings(…) “The economy is doing very well, is showing resilience,” said Fed Chairwoman Janet Yellen at a news conference following the Fed’s two-day policy meeting.

The Fed said it would increase its benchmark federal-funds rate on Thursday by a quarter percentage point to a range between 1% and 1.25% and penciled in one more increase later this year if the economy performs in line with its forecast.(…)

Plans revealed by the Fed on Wednesday would start reducing the central bank’s holdings gradually by allowing a small amount of net maturities every month. It would start by allowing up to $6 billion in Treasury securities and $4 billion in mortgage bonds to roll off without reinvestment, and let those amounts rise each quarter, essentially setting a speed limit for the wind-down.

The limits would ultimately rise to a maximum of $30 billion a month for Treasurys and $20 billion a month for mortgage-backed securities.

Ms. Yellen said if the economy performed in line with the central bank’s forecasts, the Fed could set those plans into motion “relatively soon,” which market strategists believe could mean September or October. (…)

“The plan is one that is consciously intended to avoid creating market strains and to allow the market to adjust to a very gradual and predictable plan,” Ms. Yellen said at a news conference Wednesday. (…)

Officials now expect prices excluding food and energy to rise 1.7% this year, from a projection of 1.9% in March. They lowered their unemployment rate forecast to 4.3% for the end of 2017 and to 4.2% at the end of 2018 and 2019, down from March projections of 4.5% for each of those years. (…)

The FOMC dot plot shows that the central bank expects another hike this year. The futures-based probability of a third rate hike is 43%.

Displaying

About that “predictable plan”:

  • The Fed Is Flying Blind The U.S. central bank isn’t sure why inflation is staying so low—but it’s raising rates anyway, risking a recession.

BI Economics is impressed by the aggressiveness of the Federal Reserve’s intentions, as the cap will start at $10 billion per month and accelerate to $50 billion per month. The Fed previously indicated that it wanted balance-sheet policy to operate quietly and passively in the background — as one member quipped, it should be “like watching paint dry.” This intention may be jeopardized by such a rapid intensification. Although, depending on the market reaction, the reinvestment phase-out could be watered-down at some future date.

CANADIAN DOLLAR

The loonie is so dirt-cheap that domestic industry unit labour costs, in U.S. dollar terms, are now 26% below the levels stateside. The implications of this gap for foreign direct investment into Canada and manufactured exports are hugely bullish. (…)

I don’t ant to get ahead of myself here, but the last two times Canada had such a cost advantage over the United States was in late 2008 and before that the spring of 2005 – in the former, the Canadian dollar rallied from C$1.21 to C$1.06 within the span of a year; in the latter period, the loonie went from C$1.24 to C$1.12. (David Rosenberg)

OPEC Stumbles in Face of Oil Glut Production cuts aren’t drawing oil out of storage and U.S. shale producers are humming, fueling the idea that OPEC and its allies missed the mark.

(…) In the U.S., the Energy Information Administration said Wednesday that crude stockpiles fell last week by 1.7 million barrels, less than the 2.6 million drop forecast by a Wall Street Journal survey. At the same time, gasoline inventories rose by 2.1 million barrels, compared with the survey’s expectation of a 700,000 decline, underlining worries about the oversupply extending to crude oil’s products. (…)

The IEA said U.S. crude supply will grow almost 5% on average this year [480,000 bbls/d], and nearly 8% [780,000 bbls/d] in 2018, potentially vaulting American producers ahead of Saudi Arabia in daily output. (…)

In 2018, non-OPEC production is set to increase by 1.5 million barrels a day, the IEA said, more than the 1.4 million barrels of growth forecast for world consumption. That means OPEC could have to sacrifice more market share over a longer period to maintain its output cuts.

  • Gasoline stockpiles are now above the 5-year high for this time of the year. (The Daily Shot)

 
ANIMAL SPIRITS

Satisfaction with Direction of US by Party Affiliation

Confused smile U.S. and Qatar Move Toward $12 Billion Arms Deal The U.S. and Qatar signed a preliminary agreement for the sale of dozens of Boeing Co. F-15 fighter jets to the Persian Gulf monarchy, in a transaction that risks further ensnaring the Trump administration in an escalating dispute between leading Arab countries.
Crying face By one definition, the GOP baseball shooting is the 154th mass shooting this year