U.S. Import Prices Decline; Export Prices Rise
Import prices declined 0.4% during June (+4.3%) following a 0.9% rise in May, which was revised from 0.6%. A 0.1% uptick had been expected in the Action Economics Forecast Survey. These figures are not seasonally adjusted.
Weakness in import prices was broad-based last month. Petroleum import costs declined 0.8% (+37.9% y/y) following two months of strong gains. Nonpetroleum import prices eased 0.3% (+1.4% y/y), the first decline in six months. Prices of foods, feeds and beverages fell 2.6% (-2.1% y/y) after a 0.4% rise. Industrial supplies and materials prices excluding petroleum increased 0.4% (8.0% y/y) following a 0.1% gain. Capital goods prices slipped 0.1% (+0.6% y/y) for the second consecutive month. Prices of computers, peripherals & semiconductors fell 0.2% (+0.2% y/y). Capital goods prices excluding computers, semiconductors & peripherals eased 0.1% (+0.8% y/y) after holding steady for two months. Prices of motor vehicles and parts fell 0.1% (0.0% y/y), down for the third month in the last four. Prices of consumer goods excluding automobiles declined 0.3% (+0.3% y/y) after rising 0.1% for each of the last two months.
Export prices increased 0.3% (5.3% y/y) last month after an unrevised 0.6% strengthening. A 0.2% rise had been expected. (…)

- We continue to see rapidly rising prices of imported building materials. (The Daily Shot)

-
More housing headwinds (via The Daily Shot)


- US industrial production data are likely to rebound from a decline in May, after PMI surveys showed the goods-producing sector faring well in June. However, we argue that ISM numbers continue to overstate the recent pace of manufacturing growth, and that the IHS Markit surveys show a more accurate picture of the sector losing growth momentum. (Markit)

- The New York Fed Staff Nowcast stands at 2.8% for 2018:Q2 (left) and 2.6% for 2018:Q3.


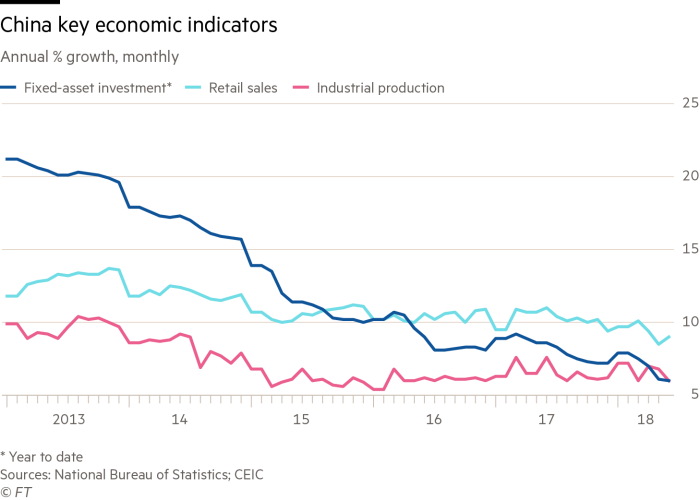
China Growth Slows Slightly Ahead of Effects From U.S. Trade Fight The economy grew 6.7% in the second quarter from a year earlier
(…) For the first half of 2018, the economy grew 6.8% from a year earlier. (…)
Quarter-on-quarter, growth looked steadier, rising to 1.8% in the second quarter from the first, the statistics bureau said. The pace in the first quarter was 1.4%.
Still, signs of slowdown in the second quarter abound. Investment in buildings, factories and other fixed assets continued to weaken, rising 6.0% in the first half of the year, decelerating slightly from the 6.1% rate in the first five months. (…)
Industrial output grew 6% in June from a year earlier, markedly slower than the 6.8% pace in May.
Retail sales bucked the trend, rising 9.0% in June from a year earlier, compared with 8.5% in May, though in recent months household consumption has also shown signs of fading.
Adding to the headwinds, many exporters crammed orders into the first half of the year to beat the tariffs, suggesting that factory activity is likely to be more relaxed in the coming months. (…)
Zhu Haibin, an economist at JPMorgan Chase & Co., estimates that nearly one million people in China’s exports sector could lose their jobs if the tariffs on $200 billion in goods come to pass and damage business and investment confidence. Growth in exports could fall by 9 percentage points, he said. (…)
Last week, the central government gave the go-ahead to subway and other rail projects in urban areas that it had halted because of debt concerns. Commercial banks have also stepped up lending over the past month to spur business activity. (…)
(…) Given that China generates as much as a third of global growth, that’s adding to signs that the best world expansion in years is plateauing. (…)
If the U.S. goes ahead with tariffs on $250 billion worth of imports, the hit to China’s growth could mean a drag of 0.3 percentage point, according to Morgan Stanley. There’s also the risk of an indirect hit to China arising from supply chain complexities which could subtract another 0.3 percentage point from growth. Bloomberg Economics estimates that the tariffs would shave 0.5 percentage point off GDP growth. (…)
TRADE
Trump’s Strategy Very Clear
Many international observers didn’t know what to make of President Trump’s approach at first, whether he was just shooting from the hip or attempting to satisfy his base, Swiss-based [Felix] Zulauf stated, but it’s become very clear now that Trump has a strategy and may end up being successful in his efforts.
That strategy, Zulauf said, is very simple: Trump wants to level the playing field on trade and reduce the US trade deficit.
“Of course there are risks that this could break out in a real trade war,†Zulauf said. “That’s a problem. But I do believe that Trump has a fairly good chance to get a good deal before the midterm elections. His timing to really jump on the Chinese is really (strong), because China is in a delicate situation. I respect the Chinese government very highly … they were prepared for some trade problems, but probably not to the degree that has come up.â€
The first $50 billion in tariffs the Chinese imposed were actually moderate, Zulauf stated. Trump doesn’t want retaliation, but is instead trying to force a deal, and he’s signaled that he’s willing to escalate further to make his point.
This has put a lot of pressure on China, which was already slowing down. It has a big problem with private corporate sector debt, which has left these corporations in a funding crisis to the tune of about 20 percent of GDP.

Source: China’s debt time bomb?
“There will be a point in the second half of this year when the Chinese authorities have to make up their mind whether they want to help support their currency or whether they want to support their economy,†Zulauf said. “I expect the (Chinese) economy to slow down from over 6 percent to maybe a 3 or 4 percent, which for China is almost recession-like.â€
Ultimately, the Chinese will come to some sort of deal with the US, but the situation may look like it is escalating first, which would drive bearish sentiment in the markets.
On the other side of the equation, Trump likely has to strike a deal leading into the midterm elections to help solidify his political position. That means he has to increase the pressure between now and then.
“Before we get the good news, we will get bad news. This is happening against the backdrop of a declining and slowing world economy. The world economy is very split. We have the US economy, which is supported and accelerating due to the fiscal push, and we have virtually the rest of the world that all depend on China. And China slowing pulls everybody down.â€
-
DOLLARS AND SENSE
Evergreen/Gavekal’s EVA treats us this week with a most interesting piece from Louis-Vincent Gave, “a man with the unique pedigree of being raised in Europe, educated in the United States and China, and spending many of his working years in Hong Kong. As you will read below, Louis – who has also been dubbed the “Smartest Man in Asiaâ€â€“ has reason to be bearish on the economy and US dollar.â€
Read it here.
U.S. and Allies Consider Possible Oil-Reserve Release The Trump administration is assessing whether to dip into the U.S.’s emergency oil stocks while it pushes other countries to boost their output amid rising prices.
(…) Any draw down of the so-called Strategic Petroleum Reserve isn’t imminent, according to people familiar with the matter. (…)
Meanwhile, Fatih Birol, director of the International Energy Agency, a group that advises industrialized nations on energy policy and coordinates emergency oil releases globally, told a private dinner last month that a release was an option if supply outages worsen, according to people at the dinner. (…)
There have been just three IEA-coordinated releases—the most recent was in 2011 at the height of the Arab Spring.
A number of big, recent supply disruptions, however, have combined with rising oil demand to send prices marching to a series of 3 ½ year highs. A collapsing economy in Venezuela has cut production there. U.S. sanctions against Iran threaten to bottle up that country’s exports. (…)
According to people familiar with the debate inside the Trump administration, any major release from the U.S. would be contingent on a further, steep rise in oil prices from today’s levels—more than 10%. A release would also only come if it became apparent that Saudi Arabia, Russia and other big producers were falling short of replacing lost production in Venezuela and Iran, they said. (…)
SENTIMENT WATCH
U.S. Investors Defy Trade Fears Trade fears have slammed markets around the world, but U.S. stocks are rising as strong profits and spending lead investors to overlook the risks of a downturn.
The S&P 500 and Dow Jones Industrial Average have gone up all but one day since the U.S. and China imposed tariffs on $34 billion of each other’s goods on July 6. The S&P 500 is now up 4.8% for the year.
However, international markets have taken a hit: the Shanghai Composite has dropped 14% for the year, South Korea’s Kospi Composite Index has shed 6.3%, Germany’s DAX has lost 2.9% and Japan’s Nikkei Stock Average has declined 0.7%. (…)
Should global trade slow broadly or the prices of goods jump, that could in turn cut into spending by consumers and businesses. A 10% rise in import costs could hurt foreign sales and chip away 3% to 4% from per-share earnings growth, Bank of America Merrill Lynch analysts found in a report. (…)
The U.S. is in a better position to withstand economic downturns, some analysts said, even if other countries are hit, making the U.S. market a relative haven. Even after a nine-year stock rally, U.S. corporate earnings are strong and consumer confidence is robust. That stands in contrast to the global growth outlook, which has cooled as business activity has slowed and a strengthening dollar has roiled emerging-market debt and currencies.
Goldman Sachs estimates exports to China make up 1% of U.S. gross domestic product. That makes it unlikely tariffs will have a material impact on the earnings growth of U.S. multinational companies, according to the firm. (…)
But so far, the markets are “ascribing a very low probability†of a worst-case scenario panning out, said Keith Parker, chief U.S. equity strategist at UBS.
“There’s too much at stake on both sides to let relationships deteriorate to that point,†Mr. Parker said.
Near-Term Headwinds
There are two big catalysts that could push equities into correction mode later this year. The coming blackout period for stock buybacks during the Q2 reporting season, which is going to be kicking off this week and next week, could constrain markets, as the end of record corporate buybacks are slated to take some liquidity out of the markets.
Also, the Fed is ramping up its balance sheet reduction to the tune of $30 million a month, then $40 million a month this quarter, and eventually ramping up to $50 million beginning Q4, meaning even more liquidity is slated to be drained from markets.
The US is still strong now, and Puplava isn’t calling for an end to the bull market yet, but we also need to note the stress in emerging markets. We may be looking at a “and then there was one, and then there were none,†scenario, with the US market being the last to roll over.
 Source: Bloomberg, Financial Sense® Wealth Management.
Jeffrey Gundlach Says We’re Getting Closer to a Recession Why he likes loans and commodities, and thinks Republicans will keep both houses of Congress
(…) The one indicator that is somewhat negative is the yield curve, which has flattened pretty relentlessly for the past year or two as the Fed has been tightening. There’s a narrative out there that says the flattening yield curve isn’t sending any message about a recession, and that couldn’t be more wrong. In fact, with rates so low, the yield curve signal is even stronger than usual. (…)
It is flashing yellow. It needs to be respected. The other reason to think 2019 might be more problematic is that quantitative tightening has just started. The Fed has started to let bonds roll off its balance sheet [the central bank isn’t buying new bonds when many current holdings mature]. Several billion dollars of bonds per month are coming due, but by October the amount will be up to $50 billion per month.
At the same time, the Fed has said it intends to keep raising interest rates, probably twice more this year. That, together with the signal from the yield curve and perhaps $600 billion of quantitative tightening, and a budget deficit that is growing, is an issue. (…)
I expect the 10-year yield to be range-bound for the rest of the year. Rates should be much higher, based on nominal gross domestic product, which probably ran around 5% in the second quarter. But weirdly, again, in this era of quantitative easing, if you average nominal U.S. GDP and the German Bund’s 10-year yield, that’s where the 10-year Treasury yield is. The German 10-year yields 30 basis points. Average that with nominal GDP of 5% and you get about 2.65%. So, 2.65% is my year-end number. (…)
Trade war fears blunt growth in global ETF industry Inflows into exchange traded products fall more than a third to $223bn in first half
(…) The sharp decline in growth comes after four consecutive years of record inflows into ETFs, which have attracted the bulk of new money in the global asset management industry. (…)
-
Rising debt leaves EM at epicentre of worries Flow data shows investor retreat from sector as dollar has strengthened

EARNINGS WATCH
Factset’s weekly summary:
Overall, 5% of the companies in the S&P 500 have reported earnings to date for the second quarter. Of these companies, 89% have reported actual EPS above the mean EPS estimate, 4% have reported actual EPS equal to the mean EPS estimate, and 7% have reported actual EPS below the mean EPS estimate. The percentage of companies reporting EPS above the mean EPS estimate is above the 1-year (75%) average and above the 5-year (70%) average.
In aggregate, companies are reporting earnings that are 2.1% above expectations. This surprise percentage is below the 1-year (+5.6%) average and below the 5-year (+4.4%) average.
In terms of revenues, 85% of companies have reported actual sales above estimated sales and 15% have reported actual sales below estimated sales. The percentage of companies reporting sales above estimates is above the 1- year average (73%) and well above the 5-year average (58%).
In aggregate, companies are reporting sales that are 1.2% above expectations. This surprise percentage is equal to the 1-year (+1.2%) average but above the 5-year (+0.7%) average.
The blended, year-over-year earnings growth rate for the second quarter is 19.9% today, which is slightly below the earnings growth rate of 20.0% last week.
The blended, year-over-year sales growth rate for the second quarter is 8.8% today, which is slightly above the sales growth rate of 8.7% last week.
Thomson Reuters’ tally shows earnings up 20.9% in Q2, 17.1% ex-Energy.
 GUIDANCE & REVISIONS WATCH
Much more important at this time given potential labor, tariffs and FX pressures.
Actually, Factset searched the transcripts of the 23 earnings conference calls held so far:
Foreign exchange has been cited by the most companies (12) in the index to date as a factor that either had a negative impact on earnings or revenues in Q2, or is expected to have a negative impact on earnings and revenues in future quarters.
After currency, the next four factors with the highest number of companies citing a negative impact are related to costs. If these four “cost†categories (raw material, transport, labor, and oil/gas) were combined, the total number of companies citing a negative impact from at least one of these four categories would be 14, as several companies cited a negative impact from more than one of these factors during their earnings calls.
It is interesting to note that the term “tariff†has been mentioned during the earnings calls of six S&P 500 companies to date. However, only one of these six companies (Lennar) cited a direct negative impact from tariffs. With the imposition of additional tariffs in recent weeks by both the U.S. and China, more companies in the index will likely discuss this topic on earnings calls for the second quarter over the next few weeks.
For Q3, the currently estimated earnings growth rate per TR accelerates to 23.2% (+23.4% on July 1), 20.0% ex-Energy. Factset tells us that 5 companies have issued guidance for Q3, four negative.
TR tracks analysts revisions to the current fiscal year earnings estimates. Last week’s revisions were meaningfully tilted to the downside for S&( 500 companies…

…while mid and small caps fared better with 49% down revisions (net of large caps) vs 44% the previous week and 54% and 57% the two weeks before respectively.

About a third of last week’s 1205 revisions on S&P 500 companies impacted Financials and 55% were down revisions. Only 2 sectors saw net up revisions last week (Utes and Energy).
Earnings grew 12.6% during April and May when compared with the same two-month period in 2017, nearly double the 6.2% growth pace recorded in the January-February period, according to the Golub Capital Altman Index. (…)
More from Golub Capital:
The Golub Capital Altman Index (“GCAIâ€), which is produced by Golub Capital in collaboration with renowned credit expert Dr. Edward I. Altman, is the first and only index based on actual revenue and earnings (defined as earnings before interest, taxes, depreciation and amortization, or “EBITDAâ€) for middle market companies. It measures the median revenue and earnings growth of more than 150 private U.S. companies in the loan portfolio of Golub Capital, a leading middle market lender.
The companies in the GCAI operate in a wide range of industries. Results are provided for the total universe of GCAI constituents and by industry segment. Given the index’s limited exposure to Financials, Utilities, Energy and Materials, comparisons are made to the S&P 500 and S&P 600 as well as to “adjusted†versions of those indexes that exclude the aforementioned sectors.


Bears are quick to dismiss the 2018 earnings strength on tax reform and buybacks, even though neither are non-recurring. But the reality is also that American companies are enjoying very strong revenue growth (+11% in Golub Capital’s private companies and +8% in S&P 500 companies) and rising margins (Golub Capital’s companies’ EBITDA is +12.6% in Q2). In effect, the estimated +7% overall earnings accretion from tax reform is supported by the above numbers.
TR calculates that trailing EPS are now $146.75. If we pro forma for 12 months of tax reform (+7% accretion), trailing EPS are closer to $152, on their way to the full year estimate of $161.20.
Fair P/E per the Rule of 20 is around 17.5 (20 – 2.5% inflation +/-), giving 2660 on the S&P 500, potentially rising to 2820 next February if estimates are met and inflation has stabilized.
In effect, equities are fully discounting current 2018 earnings estimates. Upside from here would need to come from positive revisions and/or improving investors sentiment, although it is currently pretty good as this Investors Intelligence chart (via Ed Yardeni) shows. The Bulls are as numerous as they generally are but the shortage of bears is wxtreme, which may explain the constant decline in Lowry’s Selling pressure Index (more on this below):

TECHNICALS WATCH
Lowry’s Research dismisses any comparison with the 1972 or 2000 market tops as many bears suggest. Market breadth is not deteriorating, it is expanding rather, and in all market segments, small, mid and large caps. Lowry’s assessment of demand and supply forces also keeps strengthening. Buying Power has remained range bound throughout Q2 but Selling Pressure has cratered to a 70-year low!
U.S. small and mid caps have outperformed lately but are only back to or near their early 2107 relative level while their relative earnings have outperformed. (Charts from Ed Yardeni)


