U.S. Durable Goods Orders Decline Unexpectedly in February
Manufacturers’ orders for durable goods declined 1.1% (+3.2% y/y) during February following a 3.5% January gain, revised from 3.4%. A 0.6% Improvement had been expected in the Action Economics Forecast Survey. The latest decline followed nine consecutive monthly increases.
Orders for nondefense capital goods excluding aircraft fell 0.8% (+9.1% y/y) following a 0.6% January rise, initially reported as 0.5%. The decline also followed increases in each of the nine prior months.
In the major categories of the report, primary metals and fabricated metals orders weakened, posting 0.5% (+6.4% y/y) and 0.9% (+6.5% y/y) declines, respectively. Machinery orders eased 0.6% (+5.9% y/y) while computer & electronic product orders weakened 0.5% (+8.9% y/y) for a second consecutive month. Orders for electrical equipment rose 0.2% (7.3% y/y) but transportation equipment bookings declined 1.6% (-5.8% y/y), reflecting an 8.7% drop (-3.0% y/y) in motor vehicle & parts orders.
Shipments of durable goods fell 3.5% (+1.5% y/y) following sharp increases in the prior two months. Shipments of core capital goods fell 1.0% (+7.7% y/y) in February, also after two months of strong gains. Shipments of transportation products declined 8.2% (-7.3% y/y) as auto and aircraft shipments fell sharply. Shipments excluding transportation weakened 1.2% (+6.1% y/y) after increasing in each month since May.
Unfilled orders for durable goods surged 0.8% (-5.8% y/y) in February after a 0.2% January increase. Order backlogs, excluding transportation, rose 0.9% (5.7% y/y), following nine consecutive months of gains.

U.S. Flash PMI
New order growth fastest in 6½ years, but supply chain disruptions limit manufacturing output
Private sector companies across the U.S. registered a further substantial increase in business activity at the end of the first quarter. The expansion was largely driven by service providers, as input shortages and supplier delays limited the expansion of manufacturing production capacity.
Adjusted for seasonal factors, the IHS Markit Flash U.S. Composite PMI Output Index posted 59.1 in March, down slightly from 59.5 in February, to signal the second-fastest private sector upturn for six years.
Although capacity pressures stemming from extensive supply shortages constrained manufacturing output growth to the slowest for five months, goods producers reported the sharpest rise in new orders since June 2014.
Service providers meanwhile recorded the steepest increase in new business for almost three years amid stronger client demand and looser coronavirus disease 2019 (COVID-19) restrictions. The combined increase in manufacturing and service sector new orders was the strongest since September 2014.
Export orders also continued to rise at private sector firms, up for the third month running, albeit with only a slight gain in service sector exports.
The marked uptick in new business led to a further accumulation in backlogs of work in March. The rise was driven by manufacturing firms who recorded the quickest build-up of uncompleted work since data collection began in May 2007, amid severe input delays. Service providers noted broadly unchanged levels of outstanding business, however.
Meanwhile, unprecedented supply chain disruptions pushed price gauges higher once again. The overall rate of input cost inflation accelerated to the fastest on record as raw material, PPE and fuel prices reportedly soared. Stronger demand conditions allowed for the partial pass-through of costs to clients, with the overall pace of selling price inflation also hitting the sharpest on record.
Business confidence picked up in March, running at a level rarely exceeded over the past seven years. Greater optimism stemmed from positive progress in the vaccine roll-out and hopes that firms will soon be able to fully reopen, plus stronger demand conditions and news of additional fiscal stimulus.
Subsequently, goods producers registered a strong increase in employment during March. Service sector firms, meanwhile, recorded the quickest rise in staff numbers in the year-to-date, resulting in the steepest overall jobs gain since December.
The seasonally adjusted IHS Markit Flash U.S. Services PMI™ Business Activity Index registered 60.0 in March, up from 59.8 in February to signal the strongest service sector output expansion since July 2014.
Contributing to the upturn in business activity was a steeper rise in new orders amid stronger client demand and the loosening of COVID-19 restrictions in some states. Moreover, the increase in total new sales was supported by a renewed expansion in new export orders.
Reports of ongoing supply chain issues led to marked hikes in input costs across the service sector during March. The rate of input price inflation was the sharpest since data collection began in late-2009. Firms were able to partially pass higher costs through to clients, however, as selling prices rose at the fastest pace on record.
Greater new business led firms to expand employment in March, and at the quickest pace since December 2020. The increase in staff numbers resulted in broadly unchanged backlogs of work from those seen in February.
At the same time, service providers were buoyed by stronger client demand and hopes of a return to normal business operations amid expectations that COVID-19 restrictions will loosen throughout 2021. As a result, business confidence picked up.
Goods producers registered a robust improvement in the health of the manufacturing sector in March, as highlighted by the IHS Markit Flash U.S. Manufacturing Purchasing Managers’ Index™ (PMI™) posting 59.0 at the end of the first quarter, up from 58.6 in February. The improvement in operating conditions was the second-fastest since April 2010 amid stronger client demand, but data also highlighted the most severe supply chain disruption on record (since May 2007).
Sustained deteriorations in vendor performance noticeably impacted manufacturing production capacity in March, as firms commonly reported slower output growth due to a lack of raw materials to fulfil new orders. The rate of production growth was the slowest since last October.
Nevertheless, the upturn in new business accelerated to the sharpest since June 2014, with new export orders rising solidly. Restrictions on production, however, meant that backlogs of work were accumulated at the steepest pace since data collection began in May 2007. Although manufacturers expanded workforce numbers at a strong rate, the pace of job creation eased slightly as many firms highlighted struggles finding suitable candidates to fill vacancies.
Amid substantial supplier shortages and input delays, manufacturing firms registered the fastest rise in input costs for a decade in March. At the same time, firms sought to partially pass greater input prices through to clients, with the rate of charge inflation the sharpest on record.
Finally, business confidence remained historically upbeat in March, as firms expect output to rise over the coming year amid stronger new order inflows and hopes of an end to the pandemic.

Higher inflation? From Markit’s Eurozone PMI:
The return to growth was accompanied by a further increase in price pressures. Average prices charged for goods and services rose to a degree not seen since January 2019, with goods prices rising particularly steeply, posting the largest gain for almost a decade. Prices rose far more modestly in the service sector, yet the increase was notable in being the first since the pandemic began.
Higher charges often reflected rising costs. Average input prices across both manufacturing and services rose in March at the sharpest rate for a decade. Factory input cost inflation struck the highest since March 2011, often linked to supply shortages. March saw supplier delivery times lengthen to the greatest extent in the survey’s 23-year history.
However, service sector input costs also grew sharply, rising at the fastest pace since February of last year, reflecting higher materials, food, PPE and fuel prices, plus rising wage pressures.
Higher costs were observed across the board, with Germany reporting the steepest increases (and also the most widespread supply chain delays).

Powell Says Rise in Bond Yields Reflects Optimism About Economy Federal Reserve Chairman Jerome Powell says he’s not concerned about the recent increase in long-term bond yields, calling it “an orderly process.”
(…) Mr. Powell on Wednesday said he “would be concerned if it were not an orderly process or if conditions were to tighten to the point where they might threaten our recovery.” (…)
“In the near term, we do expect, as many forecasters do, that there will be some upward pressure on prices,” Mr. Powell said. “Long term we think that the inflation dynamics that we’ve seen around the world for a quarter of a century are essentially intact. We’ve got a world that’s short of demand with very low inflation…and we think that those dynamics haven’t gone away overnight and won’t.” (…)
March Vehicle Sales Forecast: Bounce Back from Weather Impacted Sales in February
From WardsAuto: U.S. Light Vehicle Sales & Inventory Forecast, March 2021: The Wards forecast of 16.5 million SAAR, would be up about 5% from last month, and up 45% from a year ago (sales collapsed in March 2020).

Canadian Housing Boom Raises Concern, With Homes Selling Far Above Prices Asked Some Canadian homes are selling for near double their asking price, causing the country’s pandemic price run-up to lead G-7 countries and spawning worries about real estate’s outsize role in economy.
(…) According to housing data collected by the Federal Reserve Bank of Dallas, nominal house prices in Canada rose at an annual rate of about 16% in the fourth quarter from the previous three-month period, outpacing the U.S., the U.K. and elsewhere.
While in the U.S. there are few concerns about a bubble or a 2008-style crash, that’s not the case in Canada, where some analysts and economists worry about real estate’s outsize role in the country’s economy that could be exposed in the next downturn. Canadian housing as a share of gross domestic product was 9.3% as of the fourth quarter of 2020, up from 7.5% a year earlier and from 6.6% a decade ago. In the U.S., housing is 4.6% of GDP, and the U.S. level at the height of its housing boom reached only 6.7%, according to data from BMO Capital Markets. (…)
While governments around the world last year doled out roughly $12 trillion to minimize the economic damage from restrictions in place amid the pandemic, Canada has been especially generous, with spending that accounted for roughly 19% of its total economic output. Government outlays during the pandemic helped lift after-tax household income last year by 10%, versus 2019, according to Statistics Canada.
The country’s central bank has indicated it believes monetary stimulus will need to remain in place, and the federal Liberal government is also contemplating a fresh fiscal stimulus, of about 4% of GDP or C$100 billion. (…)
Bank of Canada Gov. Tiff Macklem said last month that there were early signs of “excess exuberance” in the country’s housing market and that officials would be monitoring trends closely. A spokesman for Canada’s finance department said officials there were also keeping tabs on the “health and stability” of the housing market. (…)
(…) “Demand is exceedingly strong, inventories are generally low, and property values have soared to levels far outside historical norms,” Robert Hogue, an economist at RBC, wrote in a research note published Wednesday. “Making matters worse: buyers and sellers expect prices to continue to escalate.” (…)
- National Bank CEO cautions banks to monitor mortgage market
- With Negative Rates, Homeowners in Europe Are Paid to Borrow The Covid-19 crisis pushed key benchmarks deeper into negative territory, widening the pool of mortgage holders who receive interest rather than paying it.
(…) Portugal’s state-owned Caixa Geral de Depósitos SA said about 12% of its mortgage contracts currently carry negative rates. The number of such contracts rose by 50% last year, according to a person familiar with the situation. (…)
Spain, where most mortgages are also linked to Euribor, faced a similar situation. But the country passed a law that prevents rates from going below zero. Portugal did the opposite, passing a bill in 2018 that requires banks to reflect negative rates. (…)
In Denmark, more borrowers have seen their rates turn negative, although in most cases they are still paying their banks because of an administration fee charge. (…)
Nykredit, Denmark’s biggest mortgage lender, said more than 50% of its loans with an interest period of up to 10 years have a negative interest rate before the fee. That proportion is rising because mortgages tend to have their rates adjusted every few years. (…)
EQUITIES
Peak momentum?

- Markets brace for large shift from stocks to bonds in fund shake-up Quarter-end rebalancing at asset management firms to reverberate across global markets
Not happening just yet:

Data: Investment Company Institute; Chart: Axios Visuals
Brazil Rate Hike: A Sign for Emerging Markets?
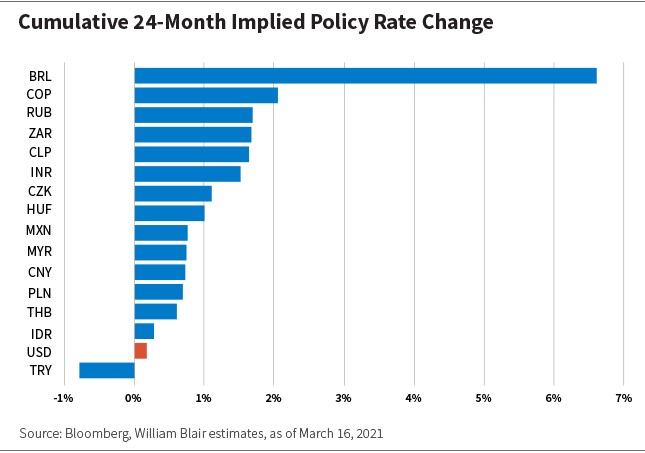
From William Blair:
(…) While Brazil is among the first major EMs to tighten, we certainly do not believe it will be the last. The chart below shows implied policy rate changes over the next two years.
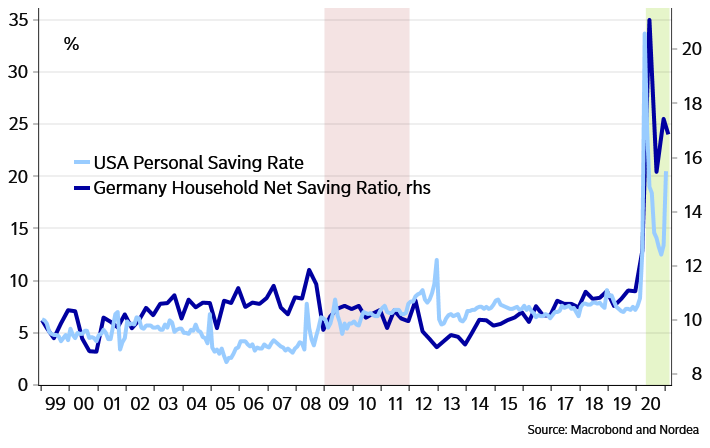
But as EMs bounce back from pandemic lows to above-potential growth rates—at least in the short term—we expect surging demand, lingering supply shocks, and commodity prices to drive inflation higher. But next year and beyond, growth levels should normalize and fiscal consolidation should keep longer-term inflation expectations in check.
China Stocks’ 15% Rout Shows What Happens When Stimulus Ends
The CSI 300 Index has lost 15% since climbing to a 13-year high last month as concern about tighter monetary policy replaced optimism about the economic recovery. Like elsewhere, the rally had been led by investors chasing a small number of stocks, many of whom piled in at the top as a frenzy grew. Now the gauge is trailing MSCI Inc.’s global benchmark by the most since 2016 this month and the most popular mutual funds are getting crushed. (…)

- U.S.-Listed Chinese Stocks Fall Into Bear Market A technology-heavy gauge that includes Alibaba, JD.com and electric-car maker Nio tumbled 6.4%.
The S&P/BNY Mellon China Select ADR Index tracks the American depositary receipts for 48 major U.S.-listed Chinese companies. The technology-heavy gauge includes e-commerce companies Alibaba Group Holding Ltd. and JD.com Inc., and electric-car maker Nio Inc.
The benchmark tumbled 6.4% Wednesday, leaving it 23% below a record hit on Feb. 16. (…)
Chinese tech stocks are partly struggling because of the threat of delisting, as well as heightened regulatory risk at home, said Wei Wei Chua, a portfolio manager at Mirae Asset Global Investments in Hong Kong. In addition, investors are rotating into more economically sensitive sectors, and higher bond yields have put pressure on the valuations of fast-growing companies. “It’s a perfect storm” of negative news, Mr. Chua said. (…)
Some other gauges tied to Chinese tech have also tumbled. Hong Kong’s Hang Seng Tech Index has dropped 27% from a peak in February. The 30-stock benchmark includes Tencent Holdings Ltd., Alibaba, and smartphone maker Xiaomi Corp. In Shenzhen, the tech-heavy ChiNext Index has fallen 22% from a recent high-water mark.
ARK’s Tesla model gish gallops to $3,000 per share
On Friday evening ARK Invest, the tech focused investment manager and ETF provider du jour, published its latest update to its Tesla model. (…) Accompanying the blog post was an Excel sheet uploaded to GitHub, which you can download and toy with here. (…)
The article follows with critics of several debatable assumptions on “Tesla’s almost non-existent insurance business”, capital requirements, etc…