CPI for all items rises 0.4% in February as gasoline index continues to rise
The Consumer Price Index for All Urban Consumers (CPI-U) increased 0.4 percent in February on a seasonally adjusted basis after rising 0.3 percent in January, the U.S. Bureau of Labor Statistics reported today. Over the last 12 months, the all items index increased 1.7 percent before seasonal adjustment.
The index for all items less food and energy rose 0.1 percent in February. The indexes for shelter, recreation, medical care, and motor vehicle insurance all increased over the month. The indexes for airline fares, used cars and trucks, and apparel all declined in February.
The all items index rose 1.7 percent for the 12 months ending February, a larger increase than the 1.4-percent reported for the period ending in January. The index for all items less food and energy rose 1.3 percent over the last 12 months, a smaller increase than the 1.4-percent rise for the 12 months ending January. The food index rose 3.6 percent over the last 12 months, while the energy index increased 2.4 percent over that period.

Core CPI is up only 0.1, or 0.4% annualized in the last 3 months. Core Goods is -0.2% in February, zero in the last 3 and 5 months!
America’s $5 trillion bet
From Axios’ Felix Salmon:
Once President Biden signs the latest relief bill into law, Washington will have spent more than $5 trillion in less than a year — far more than it has in past crises.
In a letter to colleagues Tuesday night, Senate Majority Leader Chuck Schumer wrote that the poorest 20% of Americans are estimated to see about a 20% boost in income from Biden’s bill, citing an analysis from the Tax Policy Center.
- 85% of households will get $1,400 in stimulus checks; the unemployed will receive an additional $300 per week through the fall; and families with children under 17 will get $3,000 per child.
- That’s in addition to increased rental assistance, food aid and health insurance subsidies. A recent Washington Post analysis found that 54% of Biden’s package provides direct aid to individuals, compared with 40% or less in previous packages.
This bill and the series of other COVID-19 packages passed in the last year work out to just over $43,000 per U.S. household — the type of spending that would have been unthinkable as recently as 2009, when Biden was last in office. (…)
Economists predict the economy will grow at a pace of well over 6% in both the second and third quarters of 2021 as Biden’s stimulus plan kicks in, according to FactSet.
- This time last year, the Wall Street consensus was that a coronavirus-addled economy would grow by only 2% in 2021.
- Congressional aides say that the expected economic boon, in conjunction with scientists promising a light at the end of the pandemic tunnel, mean this $2 trillion bill is likely the last mammoth COVID-related package we’ll see.
Small Business Optimism Improves Slightly in February
- Outlook at cyclical lows:

- Sales and earnings not recovering yet:


- Rising prices and hoping for even more:

- “Forty percent of owners reported job openings that could not be filled, an increase of seven points from January.” But keeping compensation low:

- Job openings rising but planned employed declining…

- While large companies’ confidence is at cycle highs:

THE INFLATION DEBATE
Double Line’s Jeff Gundlach expects headline inflation to be over 3% for a few months this summer. Contrary to David Rosenberg (discussed here An Inflated Post on Inflation), he finds a good correlation between ISM Prices aid and the CPI and says that one could plausibly see headline inflation exceeding 4%. “That would really spook the bond market.”
Andrew Cates (for Have Analytics) sees inflation as only transitory as stronger demand will be offset by improving supply:
(…) An intriguing chart that puts recent moves into context is shown in figure 3 below. It compares the yield on 10 year US Treasuries with an index that’s designed to measure the pace of global economic activity in commodity markets. The latter is calculated by the Dallas Fed and derived from a panel of dollar-denominated global bulk dry cargo shipping rates. It may be viewed therefore as a proxy for the volume of shipping in industrial commodity markets.
Figure 3: Global economic activity in commodity markets versus US 10 year Treasury yields

As an aside, check how the pandemic has impacted shipping rates (from DoubleLine):
Freight Container Rates (HK to LA)
The chart is intriguing because the correlation between the two variables – until recently – has been impressive (around 75% from 2007 to 2020). It’s intriguing though as well because some of the recent concerns about inflation stem in part from firmer commodity prices. It’s admittedly still difficult to draw strong conclusions from this because in theory there are many moving parts to gyrations in bond yields.
The chart nevertheless suggests that yields still appear to be quite low relative to the measured pace of activity in industrial commodities in recent weeks. Indeed the recent climb in yields looks entirely warranted relative to the rebound in activity and that a further increase ought to not necessarily come as a big surprise. That said ultra-loose monetary policy – and Central Banks’ bond buying programmes in particular – are a key factor that are suppressing long rates relative to the underlying pace of economic growth. Absent any major shift in these policies – which seems unlikely based on recent rhetoric – and a further sharp upward shift in long term rates seems unlikely.
The still unanswered element to this though is the degree to which firmer activity in these commodity markets heralds higher inflation in the period ahead. To some extent that seems inevitable given the strong links between higher oil prices and the energy components of headline consumer prices. There are some base effects from the plunge in activity – and some prices – that took place last year that will equally put upward pressure on CPI inflation in the coming months.
As we discussed in our last commentary (see Inflation Fears Are Probably Over-stated) what really matters now is how second round effects on wages and inflation expectations now play out. And that will largely hinge on issues such as spare capacity.
On that score though there was further evidence in the detail of the recent raft of purchasing managers’ surveys that suggest inflation fears may be over-stated. For example much of the recent sharp climb in the output price component of these surveys coincided with supply chain disruption and delivery delays as well as rising cost inflation. Indeed average supplier lead times lengthened to the second greatest extent in the global manufacturing survey’s history with almost all of the nations covered reporting an increase (see figure 4 below).
This supply chain pressure though has not – judging by other components of this index – been a manifestation of soaring demand. Instead it seems much more likely to have been a consequence of the pandemic and the tighter restrictions that have been placed on the movement of factors of production (including labour).
Figure 4: Global manufacturing PMI: Output prices and supplier delivery times
If that’s right it implies that as vaccines take effect, as fear unwinds, and as government lockdown restrictions ease these supply chain pressures also ought to ease. Indeed just as the onset of the pandemic triggered both a negative demand and a negative supply shock so the easing of the pandemic ought to trigger a positive demand and a positive supply response. And the latter ought to mitigate some of the inflationary consequences that could stem from the former.

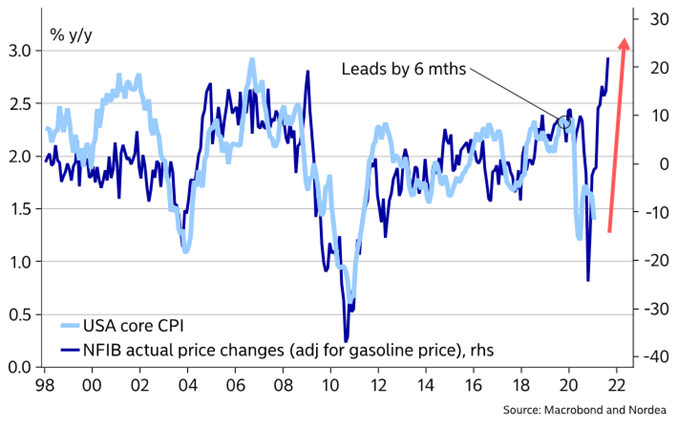
With yesterday’s release of February’s NFIB, Nordea updated this chart and commented:
Our, slightly manicured NFIB price survey, hints of 2.75-3% core inflation already over the next six months. Inflation will accordingly likely print markedly above the Fed target, also in core terms, already before summer. The Fed is only partially aware of it, and it will be tricky for Jay Powell and his lieutenants to handle the rhetoric around the average inflation target regime once inflation starts overshooting markedly. It is so much easier to defend AIT when inflation runs below target.
Brace yourself. Core inflation is coming
Flood of New Debt Tests Weakening Bond Market Supply is seen as one factor driving Treasury yields higher as investors anticipate an economic resurgence fueled by vaccinations and government stimulus.
Treasury Bond Sentiment
Source: Bloomberg, Rosenberg Research
Who’s Buying Treasuries?
Source: DoubleLine
7-year Treasury Auction:Foreigners Retreated Sharply Last Week

Source: Bloomberg, DoubleLine. UST -U.S. Treasury.
Meanwhile:

Data: Investing.com; Chart: Axios Visuals
Royal Bank CEO Dave McKay expects faster recovery to pressure central banks to raise rates as early as next year
(…) With rising input prices for labour and commodities, it could create a challenge for central bankers, Mr. McKay said in a webcast speech at the RBC Capital Markets Financial Institutions Conference.
“We see inflationary pressure building earlier than later on those goods and services,” Mr. McKay said.
“We do see a challenge to the policy and, therefore, central banks having to respond to this in 2022, the latter half of 2022, with rate increases. Versus where you might have thought – late 2023, even 2024 – six months ago.” (…)
For U.S. Farmers, China Is Back and Bigger than Ever Record exports follow a painful trade war, but concerns remain: ‘We can’t just be reliant on one partner’
(…) U.S. agricultural exports to China in 2020 rose to 55.5 million tons and comprised one-quarter of all farm shipments, according to U.S. Agriculture Department data. China is now buying more farm goods than it did before the trade war, and U.S. agricultural officials expect Chinese demand to grow further. (…)
China’s race to fatten its hogs helped drive a 53% jump in U.S. soybean exports to the country last year compared with 2019, representing the second-highest volume on record and more than half of all soybean shipments, according to USDA. Corn exports soared more than 20-fold to a new high. (…)
In the first eight weeks of this year, Chinese buyers have purchased nearly triple the amount of U.S. soybeans compared with the same period a year earlier. Prices for the oilseeds are up 64% from year-ago levels. In response, U.S. farmers are expected to plant a record 182 million acres of corn and soybeans this spring, boosting soybean acreage by seven million from 2020, according to a USDA forecast.
Grain-trading giants that are pumping out feed ingredients for Chinese hog farmers say they expect the strong demand to continue. Chinese purchases are helping draw down U.S. corn and soybean stockpiles, prompting domestic processors to rush to lock in supplies and boosting some food prices for consumers. (…)
States Expected the Pandemic to Bring Widespread Tax Shortfalls. It Didn’t Happen. Despite the pandemic’s crushing toll on the economy, total state-tax revenues were roughly flat in 2020 from the year before, aided by stimulus checks and the stock-market recovery.
(…) Net new supply of two- to 30-year Treasurys is expected to reach $2.8 trillion this year, according to BofA Global Research, up from $1.7 trillion last year and around $990 billion in 2019. The Fed, meanwhile, is expected to purchase $960 billion of Treasurys, down from more than $2 trillion last year. (…)
One piece of good news for investors is that the Treasury Department may not need to increase the amount of notes and bonds it issues to fund the $1.9 trillion coronavirus relief package that President Biden is expected to sign shortly, analysts said, given its cash on hand and the size of current auctions. (…)
In recent weeks, congressional Democrats and the Biden administration have signaled interest in another multitrillion-dollar spending package to update the country’s infrastructure. (…)
The Treasury sold another $58 billion of three-year notes on Tuesday and is scheduled to issue $38 billion of 10-year notes Wednesday and $24 billion of 30-year bonds on Thursday. A year ago, auctions of the same bonds totaled $38 billion, $24 billion and $16 billion respectively. (…)