Payroll employment rises by 235,000 in August; unemployment rate declines to 5.2% Total nonfarm payroll employment rose by 235,000 in August, and the unemployment rate declined by 0.2 percentage point to 5.2 percent, the U.S. Bureau of Labor Statistics reported today. So far this year, monthly job growth has averaged 586,000.
The change in total nonfarm payroll employment for June was revised up by 24,000, from +938,000 to +962,000, and the change for July was revised up by 110,000, from +943,000 to +1,053,000. With these revisions, employment in June and July combined is 134,000 higher than previously reported.
Average hourly earnings are up 4.3% YoY and 6.0% annualized in the past 2 months, +7.3% in the past month.
Eurozone still growing at considerable pace despite slight slowdown
The euro area economy recorded another marked expansion in business activity during August, with momentum only fading slightly from July’s 15-year peak. Jobs growth continued and was at one of the fastest rates seen in over two decades, as firms swiftly acted to boost operating capacities amid strong demand for goods and services.
After accounting for seasonal factors, the IHS Markit Eurozone PMI® Composite Output Index signalled another considerable month-on-month expansion in business activity during August. At 59.0, the headline figure was below 60.2 seen in July (which was the highest since June 2006), but still indicative of one of the fastest rates of growth seen in the past 15 years.
There were softer increases in output across both the manufacturing and service sectors in August. While goods production growth was sharp, it was the weakest in six months. Service sector output on the other hand increased at the second-fastest rate since mid-2006, behind July.
Of the monitored euro area constituents, Italy bucked the otherwise broad-based slowdown trend and registered the fastest output growth for over 15 years. Nonetheless, only France registered a softer increase in output than Italy in August. Ireland was the fastest-growing nation, followed by Spain and Germany.
August saw a strong rise in new work intakes at euro area businesses once again, despite the upturn easing slightly from July. Nevertheless, the expansion in demand was convincingly stronger than its historical average (since 1998). The sector split showed new business at manufacturers growing faster than at service providers.
This was also the case for new export orders, although a third straight rise in international sales at service providers marked the joint-longest sequence of export growth in that sector since 2018. Overall growth in foreign demand across the euro area was strong, but eased to a six-month low.
To accommodate the rapid uptake of new work, euro area employment rose markedly in August and at a rate that was only marginally weaker than July’s near 21-year high. Manufacturers recorded faster jobs growth than their services counterparts, although a slowdown at the former contrasted with the latter, where the expansion in employment was on par with July’s near three-year peak.
Despite increased recruitment efforts, work-in-hand continued to rise at a strong pace during August as businesses still struggled to meet demand in a timely manner. The rate of backlog accumulation was especially pronounced in the manufacturing sector, where ongoing material shortages and supplier bottlenecks constrained production.
Meanwhile, prices data signalled further substantial inflationary pressures in August. Input costs increased at a rate that was only fractionally below July’s near 21-year high, and was once again driven by the manufacturing sector. Meanwhile, charge inflation eased for the first time since fees started rising again in February, but was only outpaced over the series history by those seen in both June and July.
Finally, euro area businesses remained highly confident towards future output prospects in August, although the level of optimism eased to a five-month low.
The IHS Markit Eurozone PMI® Services Business Activity Index signalled a slight loss of growth momentum in August, falling from July’s 15-year high of 59.8 to 59.0.
Ireland service providers continued to outperform their euro area peers during the latest survey period, while those in France registered the softest expansion in service sector activity. However, with the exception of Italy where growth was unchanged, rates of expansion slowed in all nations from July.
Latest survey data signalled slower growth in new business intakes. Nevertheless, the increase was notably stronger than seen on average over the series history. Although export demand growth slowed, it was the second-fastest since the series began in 2014 (behind July).
Another strong increase in service sector employment was recorded in August. The rate of jobs growth matched that seen in July, which was the strongest since September 2018. Nevertheless, backlogs of work increased for a fifth successive month.
Price trends diverged in August, with a stronger increase in costs coinciding with a softer rise in selling charges. Input prices rose at the fastest pace in 13 years.
Finally, business confidence slid to a four-month low, but remained historically elevated as hopes of a continued recovery supported optimism.


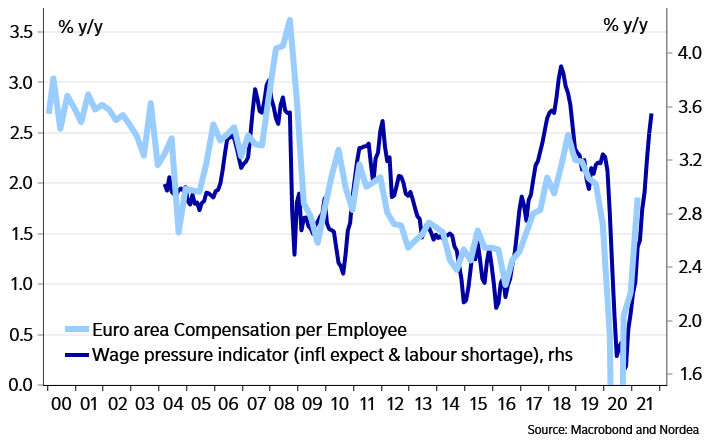
Nordea, “looking at the compensation per employee data out this week” finds it “very difficult to claim that there isn’t a rising trend [in wages]. (…) unemployment looks set for a new all-time low next year, labour shortages have already risen materially and taken together with inflation expectations it should all spell higher wage growth in 2022. But the ECB is clearly not there yet in its forecast of the future.
Labour shortages indicate upside wage pressures
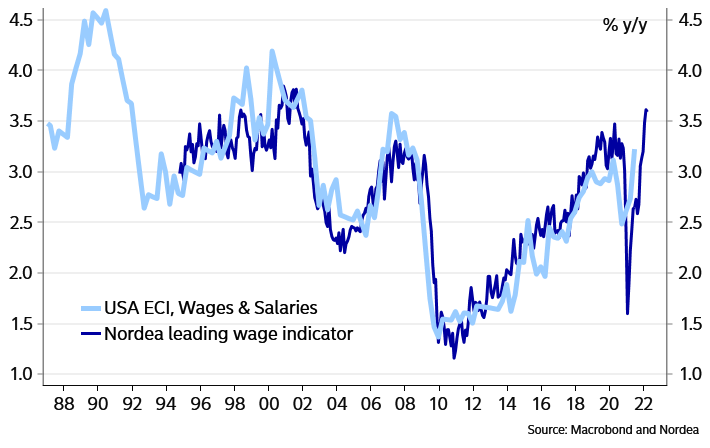
Nordea has similar views on U.S. wages:
Our models indicate highest US wage growth in 2022 since the late 1990s
Productivity increases 2.1% in Q2 2021; unit labor costs increase 1.3% (annual rates)
In manufacturing, productivity increased 8.0 percent and unit labor costs decreased 3.0 percent.
Unit labor costs in the nonfarm business sector increased at an annual rate of 1.3 percent in the second quarter of 2021, reflecting a 3.4-percent increase in hourly compensation and a 2.1-percent increase in productivity. Unit labor costs increased 0.2 percent over the last four quarters, as hourly compensation increased 2.0 percent and productivity increased 1.8 percent. (…) Over the past four quarters, nonfarm business sector output increased 15.8 percent and hours worked increased 13.7 percent. The output index is now 1.3 percent above the level seen in the fourth quarter of 2019, the last quarter not affected by the COVID-19 pandemic, while the hours worked index remains 2.7 percent below its fourth quarter 2019 level.

Booming sales sure help:

Nordea:
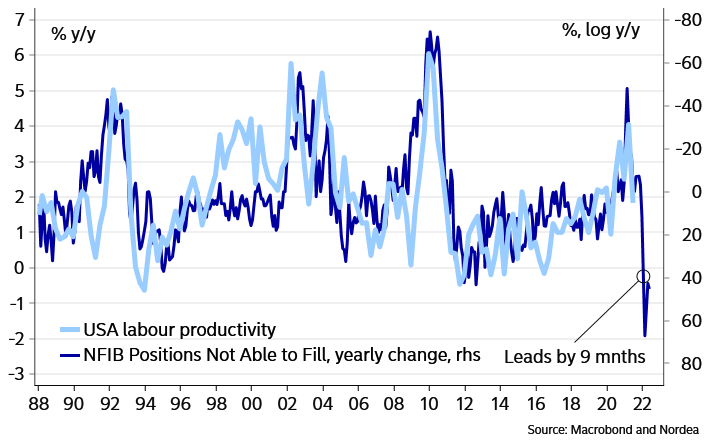
(…) all our models point to a higher wage pressure than in a long time. For cyclical reasons, and also since the people forced to return to work when the extended benefits now expire likely will be at the lower end of the productivity scale, productivity growth is set to weaken substantially in 2022. In other words, unit labour costs should rise to levels where the Fed has to admit that inflation probably wasn’t transitory.
US productivity growth should turn south in 2022
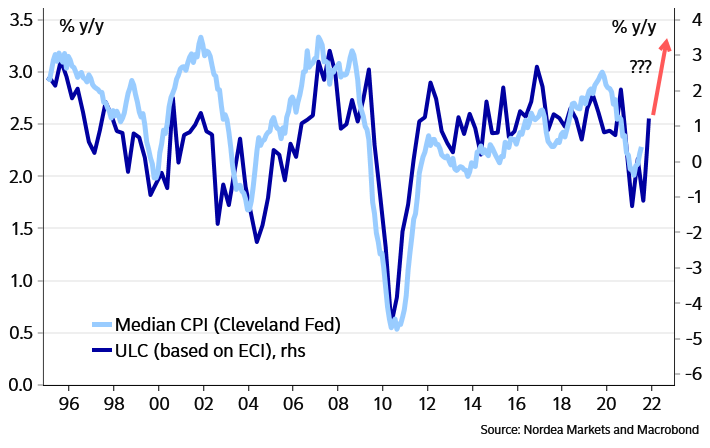
Labour costs should mean much higher median CPI the coming year
- Walmart to Raise Its Minimum Wage to $12 an Hour The country’s largest retailer by revenue is raising hourly pay at least $1 for more than 565,000 U.S. store workers as a tight labor market creates fierce competition for staff.
(…) Those workers will receive at least a $1-an-hour raise starting Sept. 25, the company said in a memo to staff, bringing Walmart’s overall average wage to $16.40 per hour for hourly workers.
The change will raise Walmart’s starting pay from the $11-an -hour floor Walmart established in 2018, a spokeswoman said. It is still below the $15-an-hour starting pay at rivals such as Target Corp and Amazon.com Inc. (…)
Walgreens-Boots Alliance Inc. said this week it will raise its starting wage for hourly employees to $15 an hour by November 2022. Pay increases will start in October and continue in phases over the next year. The pharmacy chain said the move will cost $450 million over the next three years. Earlier this month, CVS Health Corp. said it would raise its minimum hourly wage to $15 an hour effective July 2022. (…)
- Approval of Labor Unions at Highest Point Since 1965 Sixty-eight percent of Americans approve of labor unions. Though statistically similar to last year’s 65%, the current reading is the highest Gallup has measured since 71% in 1965.
Between 1936 and 1967, approval averaged 68% and included record-high 75% approval ratings in 1953 and 1957. Then, from 1972 through 2016, support eased, with few readings over 60%. This included the 48% all-time low recorded in 2009, the only time approval was below the majority level. Since 2016, approval has steadily increased and is now 20 percentage points above the historical low.
(…) approval is relatively high among young adults aged 18-34 (77%) and those with annual household incomes under $40,000 (72%).
Democrats are the most approving of unions. Their latest approval of 90% is the highest it has been in the past two decades and is up seven points since last year. At the same time, Republicans’ (47%) and independents’ (66%) approval is essentially unchanged. Each partisan group’s current approval of unions is more than 20 points higher than its lowest 2001-2020 rating. (…)
At 9%, U.S. adults’ self-reported membership in a labor union falls within the 7% to 12% range it has occupied over the past 20 years. Another 8% of Americans live in a household with a union member, meaning 17% of Americans reside in a union household.
(…) President Joe Biden has said he expects his administration to be one of the most pro-union in history. However, with former President Donald Trump’s appeal to many blue-collar workers, some Republican politicians have begun to support union issues.


- Senator Joe Manchin muddied the outlook for President Biden’s $3.5 trillion tax and spending package by demanding a “strategic pause” on the proposal. At an event in his home state on Wednesday and in a Thursday Wall Street Journal op-ed, Manchin argued that rising inflation and a soaring national debt necessitate a go-slow approach and a “significantly” smaller plan. Manchin is a linchpin vote in the evenly divided Senate, and his objections cap a politically painful period for Biden, who has been grappling with a chaotic withdrawal from Afghanistan, a resurgent pandemic and Hurricane Ida. (Bloomberg)
Caixin China General Services PMI
Chinese services companies signalled a renewed fall in business activity during August, as rising COVID-19 case numbers at home and abroad impacted operations and demand. Notably, it was the first time that output and new work had fallen since April 2020. At the same time, companies reported a slight reduction in workforce numbers, which contributed to a sustained rise in outstanding business. Prices data meanwhile highlighted a softer rise in input costs, while prices charged fell slightly due to efforts to secure new business.
The headline seasonally adjusted Business Activity Index fell from 54.9 in July to 46.7 in August, to indicate a renewed and solid decline in service sector output. The reading also marked the first reduction in business activity since April 2020. Panel members indicated that efforts to contain the recent resurgence of COVID-19 cases both at home and overseas impacted activity levels in August.
In line with the trend for business activity, total new orders received by Chinese services companies fell midway through the third quarter. Thought only slight, it marked the first fall in sales for 16 months. Survey respondents often mentioned that the pandemic had dampened customer demand. New export business was meanwhile broadly unchanged for the second month running.
Service providers in China signalled a slight reduction in employment for the second time in the past three months during August. Some firms commented on readjusting their workforce numbers in line with business activity, while others stated that they had not replaced voluntary leavers.
Lower staffing levels and pandemic-related disruption led to a second successive monthly rise in the amount of outstanding business at services companies. The rate of accumulation eased since July, however, and was only marginal.
August survey data signalled a slower increase in cost burdens faced by Chinese service providers. Input prices rose modestly overall, which was largely linked to higher staffing costs, but also increased transport fees.
Output prices meanwhile fell in August, following a solid increase in the previous month. Though only slight, it was the second time in the past three months that charges had declined. According to panel members, efforts to attract and secure new business had led firms to reduce their output prices over the month.
Services companies in China remained upbeat towards the year-ahead outlook in August, as firms generally anticipated activity would increase. That said, the degree of positive sentiment dipped from July and remained below the series average. While many businesses forecast that output will expand as the pandemic is brought under control globally, there remained concerns over how long this will take, and how long it will take for market conditions to normalise.
The Composite Output Index posted 47.2 in August, down from 53.1 in July, to signal a renewed fall in overall business activity across China. Though modest, it marked the first decline in output since April 2020. The dip in the headline index was driven by renewed falls in activity across both the manufacturing and service sectors, with the latter noting the steeper rate of decline.
Total new work also decreased for the first time in 16 months, albeit marginally. Manufacturers recorded a second successive monthly fall in new orders, while services companies recorded the first drop in sales since April 2020 amid reports that a resurgence of COVID-19 cases had dampened demand.
Composite employment fell slightly, driven by marginal job cuts at both manufacturers and service providers. Overall input costs rose at a softer, but nonetheless solid, pace, while output prices increased only slightly.


Ford and GM Curtail Production Amid Chip Shortage The auto makers are idling plants and reducing work shifts as the global computer-chip shortage continues to hamstring the industry.
GM on Thursday said it is idling its two main pickup plants, in Silao, Mexico, and Indiana. Both produce GMC Sierra pickups and Chevrolet Silverados. The company is also suspending production at three other factories for a couple of weeks, meaning no output of various SUV models, including the Chevy Traverse.
Ford is scaling back pickup production at its three truck plants starting next week. The company said Wednesday that it will halt production of the F-150 at its Kansas City, Mo., factory and operate one work shift instead of three at its F-150 plant in Dearborn, Mich. Its Kentucky truck plant, which makes Ford Expedition and Lincoln Navigator SUVs and Super Duty pickups, will operate with two work crews instead of three. (…)
Wards Intelligence estimates that auto-vehicle sales in the U.S. last month fell 14% from a year earlier. Excluding a few of the toughest months of the pandemic in 2020, Wards said August showed the lowest sales pace for the industry in a decade.
 (
(This chart from Bespoke shows the continued strength in goods manufacturing, even with vehicle plants idling:

(Bespoke)
Back to cars, McKinsey’s latest consumer surveys indicate that
Globally, consumers’ intent to purchase cars is close to pre-COVID-19 levels, fueled by positive outlooks in the United States and China:
- Intent to purchase new and used cars over the next 12 months is almost back to pre-COVID-19 levels (new cars at 94% versus pre-COVID-19 levels and up by 7% over September 2020; used cars at 97% versus pre-COVID-19 levels, up by 1% compared to September 2020).
- There are significant increases in purchase intent for EVs, particularly in Europe and China, motivated by government incentives and by increased consciousness about sustainability.
- Prospective buyers are less inclined to want to interact with sellers at car dealerships. That decline in preference is falling across all regions and age groups—especially for consumers between 55 and 70 years of age, who now consider online buying as a relevant alternative to visiting dealers.
- Interest in buying cars entirely online remains flat at 59% globally with regional variation.
- The outlook for aftermarket services continues to improve. In the last few months, more customers have been getting maintenance and repairs done rather than waiting. The next month shows significant uptake in net intent.

Vietnam’s Factory Shutdowns Tug at Apparel Industry’s Seams
(…) A broad basket of apparel companies—including Nike, Gap, Urban Outfitters, Steve Madden and PVH, the parent of Calvin Klein and Tommy Hilfiger—have seen their shares lose roughly 8% on average since July 9, when Vietnam’s Ho Chi Minh City entered its second large-scale shut down after a surge in Covid-19 cases. In the affected areas in Vietnam, most factories are still shut down, according to a spokeswoman with the American Apparel & Footwear Association, which is expecting at least another one to two weeks before reopening begins. (…)
Vietnam accounts for almost a third of U.S. footwear manufacturing and a fifth of U.S. apparel manufacturing by dollar value, according to the American Apparel & Footwear Association. (…)
That is likely to make holiday merchandising a bit of a gamble for clothing retailers, which typically buy half of their inventory in advance and then “chase” sales later depending on which items sell better. (…)
Footwear companies seem to have been spared the worst when it comes to this holiday season. They tend to place orders six months out compared with the three-month lead time that clothing sellers follow, according to Ms. Stichter. (…)
Larger companies with bigger order sizes are likely to take precedence over suppliers dealing with limited capacity. (…)
Already, retailers have been commanding full prices for products as inventory levels have remained low. In their most recent quarters, both Abercrombie & Fitch and Gap saw their best gross margins in at least a decade. Some of that boost in profitability might have to be sacrificed during the holidays, though. Airfreight, which companies will rely on even more to bypass supply chain delays, is about 12 times as expensive as ocean shipping compared with the multiple of around five times that was typical in recent years, The Wall Street Journal reported. (…)
Canada : Are consumers ready to stand on their own feet?
NBF examines the risk of a consumer strike post the coming expiry of pandemic income support. It finds that disposable income ex-pandemic rescue receipts was already above its historical trend in Q2. Combined with job growth and high savings (11.4% of GDP), the stage is set for “robust consumption and a rebound in real GDP growth after the Q2 disappointment.”

Exuberant bullishness?

Insiders not buying Asia Insider buying in the region is at lows sine 2013. Charts shows % of stocks with insider buying in AxJ, 4W rolling. Only upside from here?

(JPM Quant)
Algorithms have arrived in the bond market (Axios)
The corporate bond market has always lagged equities — by a lot — in electronic trading. But recent innovations in pricing algorithms have helped grease the wheels for a relatively new way of moving a basket of bonds.
That process, called portfolio trading, started picking up steam in 2019 — and is similar in concept to program trading for equities.
- The pandemic-era push to experiment with workflow has helped accelerate portfolio trading activity, which has grown to a 5% share of total corporate bond trades, up from just 2% in January, according to Tradeweb.
Liquidity has always been a pain point in the bond market. (…)
A trading desk runs an algorithm that spits out a clearing price for a basket of dozens or even hundreds of individual bonds. These portfolios can be anywhere from $100 million to over $1 billion in size, says Bob Summers, portfolio manager and senior trader at Neuberger Berman.
- Why this process didn’t develop earlier has to do with the sheer size and variety of the bond market. There are 100,000 individual corporate bonds compared to less than 5,000 public equities in the U.S.
Fund managers use the portfolio trading technique to quickly put large inflows to work — or to create the liquidity to fund large withdrawals. (…)
Because ETFs are buying and selling assets every day, the more a portfolio trade lines up with an ETF’s assets, the easier it is for trading desks to move the inventory, Bruner says. (…)
Speaking of algos:
- Fortune’s Eamon Barrett takes a close look at new regulations, proposed last Friday by China’s Internet watchdog, for recommendation algorithms: “If passed, the new law could dramatically limit the ability of social media apps to make money, increase the level of government oversight on the back-end tech powering Internet tech giants, and set a global precedent for managing the thorny issue of A.I. ethics.” Fortune
COVID-19
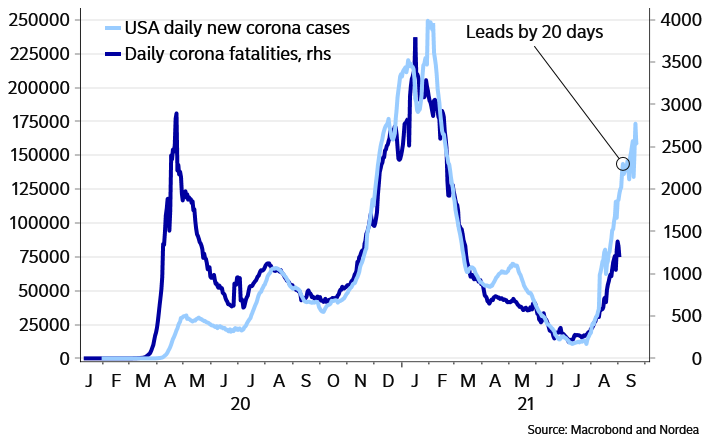
- Fatalities in the US have not decoupled from the increase in new cases in any material way, which could lead to voluntary lockdown behaviour. Turmoil in Afghanistan continued, and President Biden’s approval rating slumped. (Nordea)
Delta trend still worrying in the US
- Young Americans through age 17 are the only group showing an upward trend in per-capita hospitalizations, CDC data showed. (Bloomberg)
- China’s current COVID outbreak: unprecedented… Could this derail the turn-around? China’s current COVID outbreak is more prolonged and more dispersed than all the other previous ones.

(Bernstein)
![]()
![]()
![]()
![]() Officials at Renaissance Technologies, the hedge fund, settled a dispute with the IRS in which they’ll pay as much as $7 billion in back taxes — in what may be the largest tax settlement in history. (WSJ)
Officials at Renaissance Technologies, the hedge fund, settled a dispute with the IRS in which they’ll pay as much as $7 billion in back taxes — in what may be the largest tax settlement in history. (WSJ)
I hope they kept some spare cash, just in case…


