U.S. Inflation Hits 39-Year High Inflation reached a nearly four-decade high of 6.8% last month, as strong consumer demand collided with pandemic-related supply constraints.
The so-called core price index, which excludes the often-volatile categories of food and energy, climbed 4.9% in November from a year earlier. That was a sharper increase than October’s 4.6% rise, and the highest rate since 1991.
The increase in prices for new vehicles, which came in at 11.1% in November, was the largest on record, as were those for men’s apparel and living room, kitchen and dining room furniture. A 7.9% surge in fast-food restaurant prices last month marked the sharpest on record too.
The steady rise in restaurant prices during the past few months is a sign of pass-through from wages into higher prices, economists say. That dynamic is increasingly showing up in other industries. Wages tracked by the Atlanta Fed climbed 4.3% in November, up from 4.1% in October and the highest since 2007. (…)
On a monthly basis, the CPI increased a seasonally adjusted 0.8% in November from the prior month, about the same as October’s 0.9% increase. (…)
Sixty percent of small-business owners said they had increased prices in the previous 90 days, according to a November survey of more than 560 small businesses for The Wall Street Journal by Vistage Worldwide Inc., a business-coaching and peer-advisory firm. Eighty percent of the companies surveyed reported increased labor costs, while 72% said their suppliers had raised prices. (…)
Even sticky prices are fast unsticking, by the most in 20 years:

Jim Bianco shows that it’s not only the “reopening components” that are flaring up:

The breadth of inflation is not only seen looking at products, sticky and flexible, it is also seen in the number of biz people looking to raise prices to protect their profits:
NFIB survey highlights the breadth of price increases across American companies

(…) Shelter costs — which are considered to be a more structural component of the CPI and make up about a third of the overall index — rose 0.5% in November from a month earlier.
Compared with the same month last year, the 3.8% gain was the biggest since 2007. Housing costs are anticipated to drift higher next year as surging rents and home prices feed into the measure. (…)
Rising prices for necessities are adding up for Americans:
- Food at home rose 6.4% from a year ago, the most since December 2008
- Gasoline climbed 6.1% from the prior month, matching the October increase
- Rent of primary residence and owners’ equivalent rent both increased 0.4% from October (…)

The chart below plots Headline CPI (red), core CPI (black) and my own weighted CPI-Essentials (blue). It is no coincidence that sharply rising inflation on essentials impacts real expenditures and eventually leads to recessions. When half of one’s monthly expenditures spike, one generally needs to cut back on the other half, discretionary expenditures.

There is no base effect here. Prices of essentials have been accelerating since December 2020. They rose at a 10.4% annualized rate in the last 3 months following +6.8% and 5.6% in each of the two previous 3-month periods respectively. They rose 1.6% in 2020 and 2.4% in 2019.

The majority of American families are feeling the squeeze from food, energy and rent costs, the latter, 30% of average budgets, just starting to creep into the official stats. Nordea forecasts that CPI-Shelter inflation will reach 5-6% YoY in the first half of 2022, almost double its current 3.3% trend.
Nordea then looks at how faster wage growth generally leads to higher median CPI inflation. The blue dot is November’s median CPI. Unless we get a repeat of 1997-98 when oil prices collapsed 50%, median CPI could spike to 5% in coming months.
Broad wage growth leads to higher median CPI
Jay Powell finally shed “transitory” from his vocabulary. Let’s see if “temporary” survives.
And about that “labor slack”:
- Jobless Claims Fall to Lowest Level in 52 Years Initial unemployment filings fell to 184,000 last week. Layoffs remain low as employers hold on to workers in a tight labor market.
(…) Claims have now fallen below where they were in the year before the pandemic, when they averaged 218,000. The steady decline in filings is an indication that employers are reluctant to lay off workers as jobs are plentiful, consumer demand is high and the pool of prospective workers remains lower than before the pandemic. (…)

And about the supply shortages:
- California’s Ship Backlog Moves Farther Out to Sea The backup of container ships waiting to enter the nation’s busiest port complex isn’t letting up. But it has moved farther from shore.
(…) the backup at the biggest gateway for U.S. container imports remains as large as ever, with the lineup of vessels now stretching across the Pacific, signaling that big volumes of cargo are still heading for port terminals, warehouses and transportation networks that have been swamped by the imports.
(…) although the new system reduces the number of ships close to shore, near-shore congestion remains higher than it was before the pandemic. (…)
BTW:
- core goods inflation ex-used vehicles was 5.9% YoY in November. Last 3 months: +7.4% a.r.. Last 2 months: +8.7% a.r..
- core services inflation was 3.4% YoY in November. Last 3 months: +4.1% a.r.. Last 2 months: +4.9% a.r..
Gary Shilling, an excellent economist still in the deflationists camp, looks beyond the spending mountain and warns of a coming inventory glut if the mountain quickly turns into a valley:
Rising Inventories Are a Bearish Indicator Don’t be surprised if retailers are forced into heavy discounting and liquidation sales after enticing consumers to buy early this holiday season.
(…) Target reported a 17.7% rise in inventories from a year earlier in its fiscal third quarter ended Oct. 30, while sales rose less, or 13.2%. Similarly, Walmart had 11.5% more in stock, while sales increased 9.3%, and Home Depot Inc. inventories rose 27.4%, almost three times its sales growth. Without the rise in total private sector inventories in the third quarter, real gross domestic product would have shrunk 0.1% instead of growing 2.1%. (…)
Excess inventory-building exists beyond retailers. The Bank for International Settlements warns that building precautionary stockpiles of components by some manufacturers might be exacerbating shortages. This creates a false picture of underlying demand. Farm-equipment manufacturer Deere & Co., coming off the just-concluded five-week labor strike, plans to accelerate production to meet robust demand and rebuild inventories. (…)
Anchored ships laden with retail goods — “floating inventories” — will probably soon be unloaded and trucked to their destinations, adding to inventories. (…)
Then there are hidden inventories in the form of partially-built vehicles that will hit the market when computer chips arrive to complete them. Excess inventories may already be in consumers’ hands. During the pandemic, stay-at-home Americans bought hordes of goods ranging from TVs to kitchen appliances to bicycles, as durable goods purchases rose 7.7% last year. This year, adjusted for inflation, spending on long-lasting goods fell 26.2% in the third quarter from the second, at annual rates. (…)
It will soon become apparent if consumers’ pre-buying and heavy inventories collide. I suspect that Christmas sales during December may disappoint, forcing heaving discounting and inventory liquidations early in the new year. At the same time, all that floating inventory from China and other Asian countries will arrive, exacerbating the overhang. Also, many hidden inventories may be revealed, adding further to supplies. Economic softness in early 2022 could be exacerbated by the renewed spread of Covid-19. (…)
I’m not forecasting a 2022 recession — yet — but excessive inventories are a warning. Huge inventory build-ups that precipitated gigantic cuts in production resulted in the serious recession after World War I and in the early 1970s.
I have been warning about this possibility, seeing companies double and triple-ordering to beat the shortages and the costs increases while spending power was being eroded by rising prices.
Total expenditures are back on pre-Covid-19 trend but retail sales (goods), still 9% above trend, peaked last spring.

Americans tend to sync their spending with their labor income (payrolls = employment x hours x wages) which is still rising 9.5% YoY in nominal terms…

…but only 2.4% in real terms in November, down from 4-5% during the summer months. Real payrolls declined in each of the last 2 months at a 2.5% annual rate:

The Chase card spending tracker showed strong spending in November but sales peaked one week before Thanksgiving and have dropped back to 1.5% below their pre-Covid trend in the two weeks to December 5. The recent volatility indicates a more erratic behavior, suggesting a much less buoyant consumer. And keep in mind that the Chase data is in nominal dollars…

Gary Shilling could prove right.
During Apple’s October 28 earnings call, Tim Cook said that “from a demand point of view, demand is very robust.” But on December 1, Bloomberg informed us that “The company has told its component suppliers that demand for the iPhone 13 lineup has weakened, people familiar with the matter said, signaling that some consumers have decided against trying to get the hard-to-find item.” The only reason Apple warned its suppliers is because they have enough inventory and they want no more for now given the weakening demand for one of the world’s most popular product.
The December 10 issue of Grant’s Interest Rate Observer has this other story:
We wonder, too, if Nvidia Corp., the world-beating graphics-card maker, may be overextended, with management having splashed out to secure the parts it needs to feed the world’s ostensibly insatiable demand for the things of which it already has so many. As of Oct. 31, the company’s “future unconditional purchase commitments” of inventory summed to $6.9 billion, up from $2.6 billion at the same time last year.
“NVDA’s purchase commitments have assumed the continuation of the extraordinarily strong growth they’ve experienced recently,” notes the great Fred Hickey, proprietor of High-Tech Strategist, “but we’ll see what happens when the Fed tightening takes hold, the bubble(s) burst and recession ensues.”
Related or not, earnings pre-announcements continue to weigh more heavily on the negative side. In the last 2 weeks, of the 10 companies that have pre-announced, 8 were negative.

Analysts are unfazed, however, their Q4 earnings forecasts are for +22.0% growth, up from +21.7% on October 1. Their views for the following 2 quarters’ growth rates have even been raised by 2 percentage points.
It’s been a long, long time since we got such inflation rates, such an income squeeze and such a potentially developing inventory problem. Let’s hope the learning curve is not too steep nor too long.
So far nobody cares about inflation:

Really nobody, even those who should care the most:

Note that the 1974 and 1980 lows in real 10Y yields occurred at the very end of the recessions, when the economy was at its worst and the Fed had stopped tightening. In fact, monetary policy had been loosened for several months when these lows were reached. We are not even in the early tightening stage…
TECHNICALS WATCH
Fundamentals are one, important, thing, but technicals are another one, particularly when liquidity is so abundant. My favorite technical analysis firm remains cautious in spite of recent weeks behavior. The main points missing are strong measures of investor enthusiasm and continued “internal weakness”.
Ned Davis’ Volume Demand vs Volume Supply chart supports the weakish enthusiasm. Volume demand, although still above Volume supply, has declined even as the S&P 500 Index was rising.
 (NDR via CMG Wealth)
The problem is that fewer stocks are actually showing any strength. Unlike the SPY last Friday, RSP, the equal-weighted SPY, did not clock a new high since mid-November…

…while the Russell 2000 is struggling below its now declining 200-day m.a..

The Market Ear has this from Goldman Sachs:
Drawdowns tend to be larger after breadth narrows sharply (2nd chart).


BTW: FOMC Meeting. Two-day meeting, December 14-15. Press Conference. 4:15 p.m..
Already late catching up, the Fed needs to keep the bond vigilantes quiet…

…while main street is getting more and more worried that “temporary” is not a better word than “transitory”:
Inflation expectations continue to climb
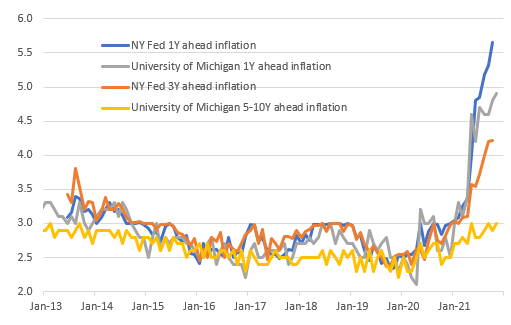
(ING)
John Authers: The Fed Needs to Seize Back the Inflation Agenda The Fed should be getting very anxious about stickiness in the inflation surge — and show that it’s serious. Markets seem far too complacent.
(…) there was plenty in the report to convince skeptics that this dose of inflation will not go away of its own accord (you can read my considered take from Friday here). It will need some changes to monetary policy to dislodge it, and that opens up the possibility of a mistake. (…)
The rises in sticky inflation and in sectors not directly affected by the pandemic are exactly the things that earlier this year the Fed hoped would not happen. It increases the pressure to craft a response. Despite this, long rates in the bond market suggest minimal concern that the Fed will need to tighten policy very much. The “terminal rate,” to use the jargon, remains very low at not even 2%. This looks overly hopeful to me. A central bank is nothing without a reputation. If consumers and investors don’t trust it to keep inflation under control, it has no alternative but to overshoot aggressively (as Paul Volcker did four decades ago). (…)
This was Bianco’s conclusion:
(…) If the Fed does not address inflation soon, they risk long rates shooting much higher. But if they follow the market’s lead in aggressively hiking rates, they risk hurting the economy. We understand the Fed’s paralysis given the massive uncertainty coming out of the pandemic. However, the longer they wait to address inflation, the worse this conundrum will become.
Mitigating circumstances include that companies and individuals are flush with cash at present; there is more of a cushion if the Fed decides to tighten than there usually is. Also, with the U.S. stock market at record levels, and with the yield curve still a ways from inversion, there is room for the Fed to push down the prices of stocks and short-term bonds without “breaking something,” although this risk is plainly rising. (…)
Omicron Update: Dec 13 (Katelyn Jetelina)
We now have 8 lab studies all largely saying the same thing: Omicron significantly reduces the number of neutralizing antibodies from a 2-dose mRNA series compared to previous variants.
Importantly, a “reduction in neutralizing antibodies” is not the same thing as “reduction in vaccine effectiveness”. This is because immune systems are adaptive and diverse thanks to other types of antibodies, B-cells (antibody factories), and T-cells (secondary line of defense). So it’s important to look at other data too.
In the UK, we got our first glimpse of “real world” vaccine effectiveness against Omicron. On Friday, the UK Health Security Agency released a comprehensive report in which they compared 56,439 cases of Delta to 581 cases of Omicron from Nov 27 to Dec 6, 2021. Vaccine effectiveness against Omicron infection was 30-40% after two shots of Pfizer. After a booster, effectiveness increased to 70-80%. This is nothing short of phenomenal. This also probably means that boosters continue to reduce viral transmission.
In the past week we also had 3 T-cell studies come out. T-cells are critical to our immune system because they are our second line of defense. If neutralizing antibodies can’t catch the virus before it infects our cells, then T-cells kick in. T-cell protection is harder for viruses to escape because their protection spans virtually the entire spike protein, whereas antibody responses tend to focus on relatively few regions. As hypothesized, the results from the studies look great— T-cells continue to work against Omicron. So even though the number of infections will substantially increase, we will largely stay out of the hospital.
With this data, the case for an Omicron-specific vaccine is becoming less and less apparent. This will be highly debated in the coming months, so it will be interesting to hear both sides of the argument.
(…) A week ago, a South African study found reinfection rates were 3 times higher with Omicron compared to Delta. This past Friday the UK confirmed with their own analysis: Of 329 individuals identified with an Omicron infection in this period, 17 (4.9%) were linked to a previous confirmed infection. This equates to an Omicron reinfection rate of 3-8x higher than Delta.
Omicron continues to flood South Africa. On Friday and Saturday it looked like cases peaked, but then on Sunday there was a huge case dump (Friday: 19,018; Saturday: 17,154; Sunday: 37,875 cases). South Africa clarified there was a lag in case reporting due to IT issues. Cases may still be increasing, we just need a few days for reporting to stabilize. Tracking 7-day case averages (opposed to day-to-day numbers) continues to be critical.
The number of COVID19 hospitalizations in South Africa is remaining low. But we’re coming up on the 3-4 week lag we typically see with hospitalizations, so coming to a conclusion is haphazard.
If hospitalizations continue to be low, then there is a clear indication that one of two things are happening:
Immunity works against severe disease (like we hypothesized above); or,
Omicron induces more mild disease.
We really need a more generalizable sample in order to differentiate between the two: How do older people fare with Omicron? How about those with no prior infection? Unvaccinated? We still don’t know.
If South Africa’s hospitalizations and deaths continue to remain low regardless of a high case rate, many would consider the crisis of SARS-CoV-2 in South Africa over. The virus will still ebb and flow, there will be people that will go to the hospital and die but it certainly won’t look like what we saw previously in the pandemic. Their hospitals will not be overrun; they have a large enough immunity wall. If this happens in South Africa, will it be the same story in other countries? Unfortunately we don’t know; we are at the mercy of time.
Thirty states have confirmed an Omicron case, although we can certainly assume it’s in all 50 states by now.
There’s now enough data to estimate the reproductive number (i.e. contagiousness) in the United States. And it’s not looking good: R(t)=3. With this high level of transmissibility, cases are doubling every ~3-4 days, so Omicron will easily be the dominant variant in coming weeks.
This R(t) is similar to other countries like Germany and South Africa. Nothing is stopping Omicron in its tracks. As time goes on, R(t) should differentiate itself across countries due to many factors: differing behaviors (public health mitigation measures), genetics, patchwork immunity, age distributions, etc.
Unfortunately, Omicron will be become dominant at a terrible time: For the first time in a few months, cases, hospitalizations, and deaths are all increasing.
Yesterday 1,288 souls died from COVID19. As Kaiser Family Foundation reported, 163,000 COVID-19 deaths since June 2021 would have been prevented with vaccinations. A true national tragedy.
Just like with Delta, the news of Omicron is increasing vaccinations, especially with boosters. A silver lining to new variants?
Bottom Line:Data is showing that immunity will keep a large proportion of people out of the hospital. But the million (billion?) dollar question remains: Is there a high enough immunity wall to keep our hospitals from flooding? Time will tell.