U.S. Consumer Price Inflation Firms in February; Core Prices Tame
The Consumer Price Index rose 0.4% (1.7% y/y) during February following an unrevised 0.3% January increase. The gain matched expectations in the Action Economics Forecast Survey. The CPI excluding food & energy edged 0.1% higher last month (1.3% y/y) after holding steady for two straight months. A 0.2% February gain had been expected.
Strong energy prices provided much of the lift to last month’s increase with a 3.9% jump (2.4% y/y), following January’s 3.5% rise. Gasoline prices surged 6.4% (1.5% y/y), strong for the third straight month. Natural gas prices strengthened 1.6% (6.7% y/y). Fuel oil prices surged 9.9% NSA (-0.5% y/y) following a 5.4% jump while the cost of electricity improved 0.7% (2.3% y/y) after easing 0.2% in January.
Food prices improved 0.2% (3.6% y/y) last month, after rising 0.1% in January. Food-at-home prices rose 0.3% (3.5% y/y). (…)
Goods prices excluding food & energy edged 0.2% lower (+1.3% y/y) in February after rising 0.1% for two straight months. Apparel prices fell 0.7% (-3.6% y/y) following three months of firm increase. (…) New vehicle prices held steady (1.2% y/y). Used car & truck prices fell 0.9% for the third straight month, but they were 9.3% higher y/y. Medical care product costs were off 0.7% (-2.5% y/y), the sixth straight monthly decline. (…)
Services prices rose 0.2% (1.3% y/y) during February after holding steady for two months. Shelter costs rose 0.2% after six straight months of stability. The 1.5% y/y gain was half the 2019 increase. The owners’ equivalent rent of primary residences increased 0.3% and rose a greatly lessened 2.0% y/y. (…) Medical care services prices improved 0.5% (3.0% y/y) for a second straight month. These gains came after three straight months of decline. The cost of public transportation fell 2.3% (-16.2% y/y).
The components of core inflation have converged to a +1.3% YoY increase:

On a MoM basis, core inflation has been below +0.2% in each of the last 6 months, averaging +0.1% per month. Core Goods prices declined 0.2% last month and are unchanged since September 2020. This is surprising given recent PMI surveys which all pointed to rising input costs being at least partially passed on to clients (other manufacturers, wholesalers, retailers). From Markit’s February U.S. PMI:
As a result, goods producers registered a severe uptick in cost burdens. The rate of input price inflation accelerated to the sharpest since April 2011. Higher raw material prices, notably for steel, and increased transportation costs were widely linked to the rise. The recent strengthening of demand allowed firms to partially pass on higher costs to clients through the fastest rise in charges since July 2008.
From Markit’s February Global PMI:
With rising demand for inputs chasing restricted supply, average input prices increased for the ninth month in a row. Part of the rise in costs was passed onto clients through higher charges. Rates of inflation in both price measures hit near-decade highs, with developed nations seeing (on average) sharper increases than emerging markets.
Since raw materials cost increases are real and well documented and given supply chain problems and surging transportation costs, there seem to be margins problems within the goods sector unless demand is strong enough to offset cost pressures without raising prices.
That could be the case at the retail level where December sales were up 5.9% YoY. However, sales at manufacturers (+0.1%) and wholesalers (+1.7%) seem too weak to provide much of an offset.

Another potential explanation is that Chinese goods, about 33% of goods sold in the U.S., are deflating. China’s non-food prices are down 0.2% YoY in February.
Another curiosity is that Core CPI is now rising more slowly than Core PCE, unseen since 2010:

The Atlanta Fed’s Underlying Inflation Dashboard details various inflation measures. Nothing to boost inflationists so far:

ING: US inflation: a long way to the top
(…) headline inflation is set to hit 3% in April as prices in a vibrant, reopened, supply constrained economy contrast starkly with those of 12 months before when the situation looked dire. Add in rising commodity, energy prices and freight costs that are still working their way through into CPI we expect to see inflation rise above 3.5% in May and June, possibly briefly touching 4%.
US annual inflation with ING forecasts
(…) we agree that 4% inflation isn’t sustainable. For that we would need to see considerable wage inflation coming through very quickly, which doesn’t seem likely when there are 9.5 million fewer people in work than before the pandemic.
That said, we are a little less relaxed than Jerome Powell who only last week suggested that high inflation readings will be “transitory” and the notion of “deeply ingrained” low inflation will not fade fast. We are of the view that inflation could stay in a 2.5-3.5% range for the next couple of years which, if correct, implies more upward pressure on longer dated Treasury yields.
Our more bearish inflation forecast is likely due to our significantly higher than consensus GDP prediction of 6.5% for 2021 and 4.7% for 2022 and our sense there will be lingering supply issues that improve corporate pricing power. It is also heavily influenced by the one-third weighting of housing-related items within the inflation basket.
A reopening economy that is benefiting from pent-up demand, a much improved household balance sheet, a $1.9tn fiscal stimulus coming after nearly $4tn last year and likely followed up by a $3tn+ Build Back Better infrastructure programme plus ongoing support from monetary policy, to us, suggests vigorous growth. It also likely means that the economy will be able to recover all of the lost jobs due to the pandemic well before the end of 2022.
This strong demand will then crash into initial supply constraints in many industries – think restaurants and bars that have gone out of business, airlines that have laid off pilots, companies needing to rework office space, hotels that need to train staff etc. That supply capacity cannot be rebuilt overnight and this means more corporate pricing power that will keep inflation higher for longer.
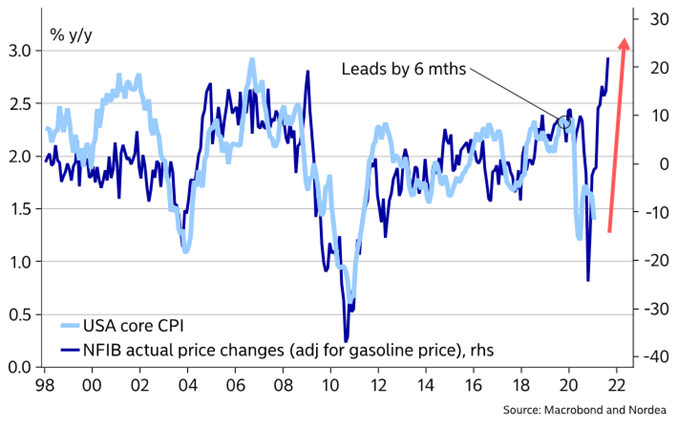
A prolonged period of rising energy and commodity prices won’t help either. Note that the NFIB (National Federation of Independent Business) survey suggested that a net 34% of small businesses have plans to hike prices in the next three months, matching figures not seen since briefly in the summer of 2008. You then have to go back to the late 1970s to find a higher proportion of companies looking to raise prices.
Rising house prices will translate into higher CPI housing inflation
Then there is the heavy weight of housing within the basket of goods and services. Primary housing rents and owners’ equivalent rent account for a third of the inflation basket. As the chart above shows, official house price changes tend to lead these housing components by around 14 months. Consequently, we strongly suspect that these housing components will turn higher soon and contribute positively to inflation for a significant period.
A final point to consider when looking at medium-term US CPI risks is that while there is significant spare capacity on the basis of employment being down 9.5 million on February 2020, employers don’t seem to be experiencing it.
The same NFIB small business survey showed that a record 40% of American small businesses had job openings they couldn’t fill. With Federal unemployment benefits being uprated to $300/week (as part of the $1.9tn stimulus) and extended out to September, on top of state benefits that average $347 per week, this could mean employers increasingly have to raise wages to try and fill positions.
This is a very different labour market to what we saw as we emerged from the Global Financial Crisis over 10 years ago and again suggests inflation moves higher for longer.
While the Federal Reserve remains relaxed, the bond market is understandably less confident that inflation will stick rigidly to 2% over the medium term. The prospect of inflation staying higher for longer argues for upward moves higher in longer-dated Treasury yields – 2% is an obvious next target, particularly if we start to hear some movement on QE tapering.
We also think this backdrop means it will be increasingly difficult for the Fed to argue that they will be leaving rates on hold until 2024. This is likely to remain the implication from next week’s updated Fed dot plot diagram, but we would not be surprised to see a few Fed officials start to move that forward into 2023.

")
The understatement of housing inflation in the consumer price index has reached a new milestone. As reported, the gap between the actual change in house prices and owners’ rent, as published by the Bureau of Labor Statistics (BLS), exceeds the “bubble” levels.
In February, BLS reported owner’s rent increased 2% over the last 12 months. House price inflation, as reported by the Federal Housing Finance Agency (FHFA), increased 11.4%. That gap over 900 basis points exceeds the 800 basis point gap recorded during the housing bubble peak.
The consumer price index was created and designed to measure prices paid for purchases of specific goods and services by consumers. The CPI was often referred to as a buyers’ index since it only measured prices “paid” by consumers.
The CPI has lost that designation. It no longer measures actual prices. For the past two decades, BLS imputes the owners’ rent series, using data from the rental market, no longer using price data from the larger single-family market.
Imputing prices for the cost of housing services make the CPI a hybrid index or a cross between a price index and a cost of living index. A hybrid index is not appropriate as a gauge to ascertain price stability, especially when the hypothetical measure of owner’s rent accounts for 30% of the core CPI.
The CPI missed the price “bubble” of the mid-2000s, and the economic and financial fallout was historic. History sometimes repeats itself in economics and finance. Policymakers forewarned.

Global food prices rose by 2.4% in February, according to the Food and Agriculture Organization’s Food Price Index. That marks the ninth straight month of price rises, causing the index — which is adjusted for inflation — to reach its highest level since July 2014.

Bank of Canada holds fast on rates, bond buying; sees economy gathering steam
The central bank kept its policy interest rate at 0.25 per cent, and reiterated that it does not expect to start raising rates until 2023. It also said that it would continue buying $4-billion worth of government of Canada bonds each week, giving few hints as to when it might begin to “taper” its quantitative easing program. (…)
“The economy is proving to be more resilient than anticipated to the second wave of the virus and the associated containment measures,” the bank said in Wednesday’s one-page statement. It noted that GDP growth in the fourth quarter of 2020 was 9.6 per cent on an annualized basis, twice what the bank had forecast in January, and that GDP is now expected to grow in the first quarter of 2021 rather than contract.
“Consumers and businesses are adapting to containment measures, and housing market activity has been much stronger than expected. Improving foreign demand and higher commodity prices have also brightened the prospects for exports and business investment,” it said.
At the same time, it noted that there is still considerable slack in the economy and uncertainty about the evolution of COVID-19. It said the labour market is “a long way from recovery,” noting that employment is still well below prepandemic levels, and that low-wage workers, young people and women have been hit the hardest.
(…) the bank said the year-over-year rate of inflation will likely tick up in the coming months, as current prices for goods and services – most notably the price of oil – are compared with prices depressed at the outset of the pandemic. Although it reiterated its view that inflation will moderate in the second half of the year, as “excess capacity continues to exert downward pressure.” It noted that measures of core inflation currently range from 1.3 per cent to 2 per cent.
A $60 billion surprise in the Covid relief bill: Tax hikes Democrats tucked in a trio of little-noticed tax hikes on the wealthy and big corporations.
One takes away deductions for publicly traded companies that pay top employees more than $1 million. Another provision cracks down on how multinational corporations do their taxes. A third targets how owners of unincorporated businesses account for their losses.
It’s surprising because Democrats were widely expected to put off their tax-increase plans until later. Many lawmakers are wary of hiking them now, when the economy is still struggling with the coronavirus pandemic. If anything, when it came to their stimulus plan, Democrats were focused on cutting taxes, not increasing them.
But they ran into problems complying with the stringent budget rules surrounding so-called reconciliation measures like the coronavirus legislation — especially after some wanted to add provisions like one waiving taxes on unemployment benefits.
If Democrats exceeded their $1.9 trillion budget cap for the plan, they would lose the procedural protections that were used to shield the entire measure from a Republican filibuster in the Senate.
The tax increases Democrats picked to help keep their plan’s cost in check had the political benefit of being arcane. Unlike things like raising the corporate tax rate or upping the top marginal tax rate on the rich, the ones they chose won’t produce many headlines. (…)
Congress Eyes Antitrust Changes to Counter Big Tech, Consolidation Both Democrats and Republicans have talked about a need to strengthen U.S. antitrust law. This year could test whether they are serious about hammering out legislation to make it happen.
Congress is considering the most significant changes to antitrust law in decades, including some proposals with bipartisan support. Lawmakers are looking at setting a higher bar for acquisitions by companies that dominate their markets; making it easier for the government to challenge anticompetitive conduct; and potentially forcing some giant tech companies to separate different lines of their businesses. (…)
The Senate will begin its discussion in earnest Thursday, when an antitrust subcommittee led by Sen. Amy Klobuchar (D., Minn.) holds its first hearing on possible reforms. (…)
“It’s not just tech, it’s cat food to caskets,” Ms. Klobuchar said. (…)
“There appears to be a broad consensus that the status quo isn’t working,” Sen. Mike Lee (R., Utah), the leading Republican on the Senate antitrust panel, said recently, though he warned against what he called a desire by some Democrats to “seize this moment to radically alter our antitrust enforcement regime.” (…)
Meanwhile, a House antitrust panel led by Rep. David Cicilline (D., R.I.) will conduct a hearing Friday to discuss a bipartisan proposal to allow local news outlets to join to negotiate with dominant platforms such as Alphabet Inc.’s Google and Facebook Inc. (…)
- EU struggles to build antitrust case against Amazon Regulators face difficulties gathering evidence against tech giant nearly two years after probe was announced
COVID-19
- The U.S. is on target to meet President Biden’s goal that every American adult who wants a vaccine will be able to get one by the end of May. (Axios) The U.S. is administering over 2 million shots per day, on average. Roughly 25% of the adult population has gotten at least one shot.
- Vaccine recipients wait to learn if they can still pass on Covid Researchers think vaccines reduce transmission but are still trying to understand by how much
- Pfizer-BioNTech Covid Vaccine Blocks Most Spread in Israel Study
- Denmark Suspends AstraZeneca Vaccine on Clot Concerns Decision comes after one person died following inoculation
- EU Governments Are Bracing for More Covid Vaccine Delays
- New Biotechnology Covid Treatment Reduces Risk of Death
- GSK Covid treatment shows ‘profound efficacy’ in initial trial Data from 583 patients shows 85% reduction in hospitalisation or death
- One in Five U.S. Adults Say They May Not Take Covid-19 Vaccine