U.S. Consumer Spending Fell 0.6% in December Amid Inflation, Omicron Commerce Department’s gauge of inflation rose 5.8% from a year earlier
Consumer outlays declined by 0.6% in December from the prior month, the first decrease since last winter, the Commerce Department said Friday.
Meanwhile, prices continued to climb. The Commerce Department’s personal-consumption-expenditures index measure of core inflation, which excludes volatile food and energy costs and is closely watched by the Federal Reserve, rose 4.9% from a year earlier. That marked the fastest year-over-year increase since September 1983. (…)
Friday’s report showed households’ incomes rose 0.3% in December, but the increase didn’t keep pace with rising inflation. Overall inflation, as measured by the PCE index, rose 0.4% for the month and 5.8% from a year earlier.
Adjusted for inflation, after-tax personal income declined 0.2% from November. It has decreased for five straight months and in eight of the last nine months, leaving households worse off. (…)
Goods spending fell 2.6% in December amid supply-chain bottlenecks and consumers starting their holiday shopping earlier. (…)
Here’s the main data from Haver Analytics:

Goods consumption is still 4-5% above trend but dropping rapidly while total consumption remains below trend:

Real DPI has slowed and is now below trend without much offset from the savings rate, even during Christmas. Americans don’t seem t be in a big spending mood.

The growing problem for most Americans:


- Goldman Sachs says that “40% of surveyed analysts report that firms in their sector will increase prices by more in January than in other months of the year, consistent with our expectation that January may bring further inflation pressures as a larger-than-usual share of firms reset wages and prices at the start of the year.”
- “Our GS shelter inflation tracker increased to +6.3%, pointing to a pickup in the official shelter series from its current +3.7% year-over-year rate.”
- Port Congestion Spreads Across More U.S. Import Gateways Backups have been rising at Charleston, S.C., and Oakland, Calif., as ports wrestle with continuing cargo surges and Covid-related worker absences
- Drugmakers Raised Prices by 6.6% on Average Early This Year Drugmakers often raise prices of their products during the first few weeks of a new year. Over the same period last year, drugmakers raised prices by an average of 4.5%.
- Restaurants Pull Back on Value Menus as Costs Rise Chains are reducing their menus of discounted items or shrinking portions, hoping it will bring less pushback from consumers than straight price increases.
- Aluminum Prices Can’t Keep Up With Energy Costs, Driving Wave of Closures Analysts predict supply of the metal will fall short of demand, creating another pinch point for industries such as auto manufacturing
All inflation numbers are much worse than expected, but no worries, “they’re still all transitory”: “We [GS] forecast core PCE inflation of 2.9% at end-2022 (vs. 2.5% previously), 2.2% at end-2023 (vs. 2.15% previously), and 2.25% at end-2024 based on our bottom-up inflation model.”
In the meantime, as the WSJ adds: “There are broad signs that consumers pulled back in January. Spending at restaurants, airlines and on travel bookings has cooled since late November, according to card transaction data from research firm Facteus, and it has been in decline this month at home-supply stores and wholesale clubs.”
Indeed:
- Chicago Fed Advance Retail Trade Summary: January 1–14, 2022 In the second week of January, the Weekly Index of Retail Trade increased 0.6% on a seasonally adjusted basis after increasing 0.5% in the previous week. For the month of January, retail & food services sales excluding motor vehicles & parts (ex. auto) are projected to increase 0.4% from December on a seasonally adjusted basis and to be unchanged when adjusted for inflation.
- The JPM Chase consumer card spending tracker of control retail sales has improved sequentially over a very weak December but remains below its pre-Covid trends as of January 23.
- On Friday, the Qurate Retail Group, a $4.5B in revenue group which owns seven retail brands (e.g. QVC, HSN, Zulily, Frontgate) “reaching approximately 218 million homes worldwide via 14 television networks and reaching millions more via multiple streaming services, social pages, mobile apps, websites, print catalogs, and in-store destinations” pre-announced:
Qurate Retail experienced lower-than-anticipated demand in the fourth quarter, negatively impacting expected sales and adjusted OIBDA. Qurate Retail revenue were down 8% – 9% in Q4 and adjusted OIBDA down 17% – 20%. Revenue performance at QxH deteriorated throughout the fourth quarter, deviating from initial trends indicated on our third quarter earnings conference call.
This comes after popular Lululemon on January 10, with likely more to come.
Meanwhile, there is this growing problem for most companies, particularly those with limited pricing power:
U.S. Labor Costs Grew at Fastest Pace in Two Decades Employers spent 4% more on compensation last year, an increase not seen since 2001, as they competed for workers in a tight labor market.
(…) Still, the figures offered a sign that labor-cost increases could be easing, with the Labor Department reporting a seasonally adjusted 1% rise in compensation for the fourth quarter, down from with a 1.2% increase the previous three months. (…)
It’s not advisable to hang one’s hat on a one quarter slowdown. In fact, nothing in the PMI and other surveys nor from corporate conference calls suggests an easing of wage pressures. The chart below plots private compensation and wages, up 4.4% and 5.0% YoY respectively. On a QoQ basis, total private compensation and wages rose at a 4.9% annualized rate in Q4.

The next chart shows how the FOMC reacted the last two times wages spiked on semi-annual basis. Next meeting: March 15-16.

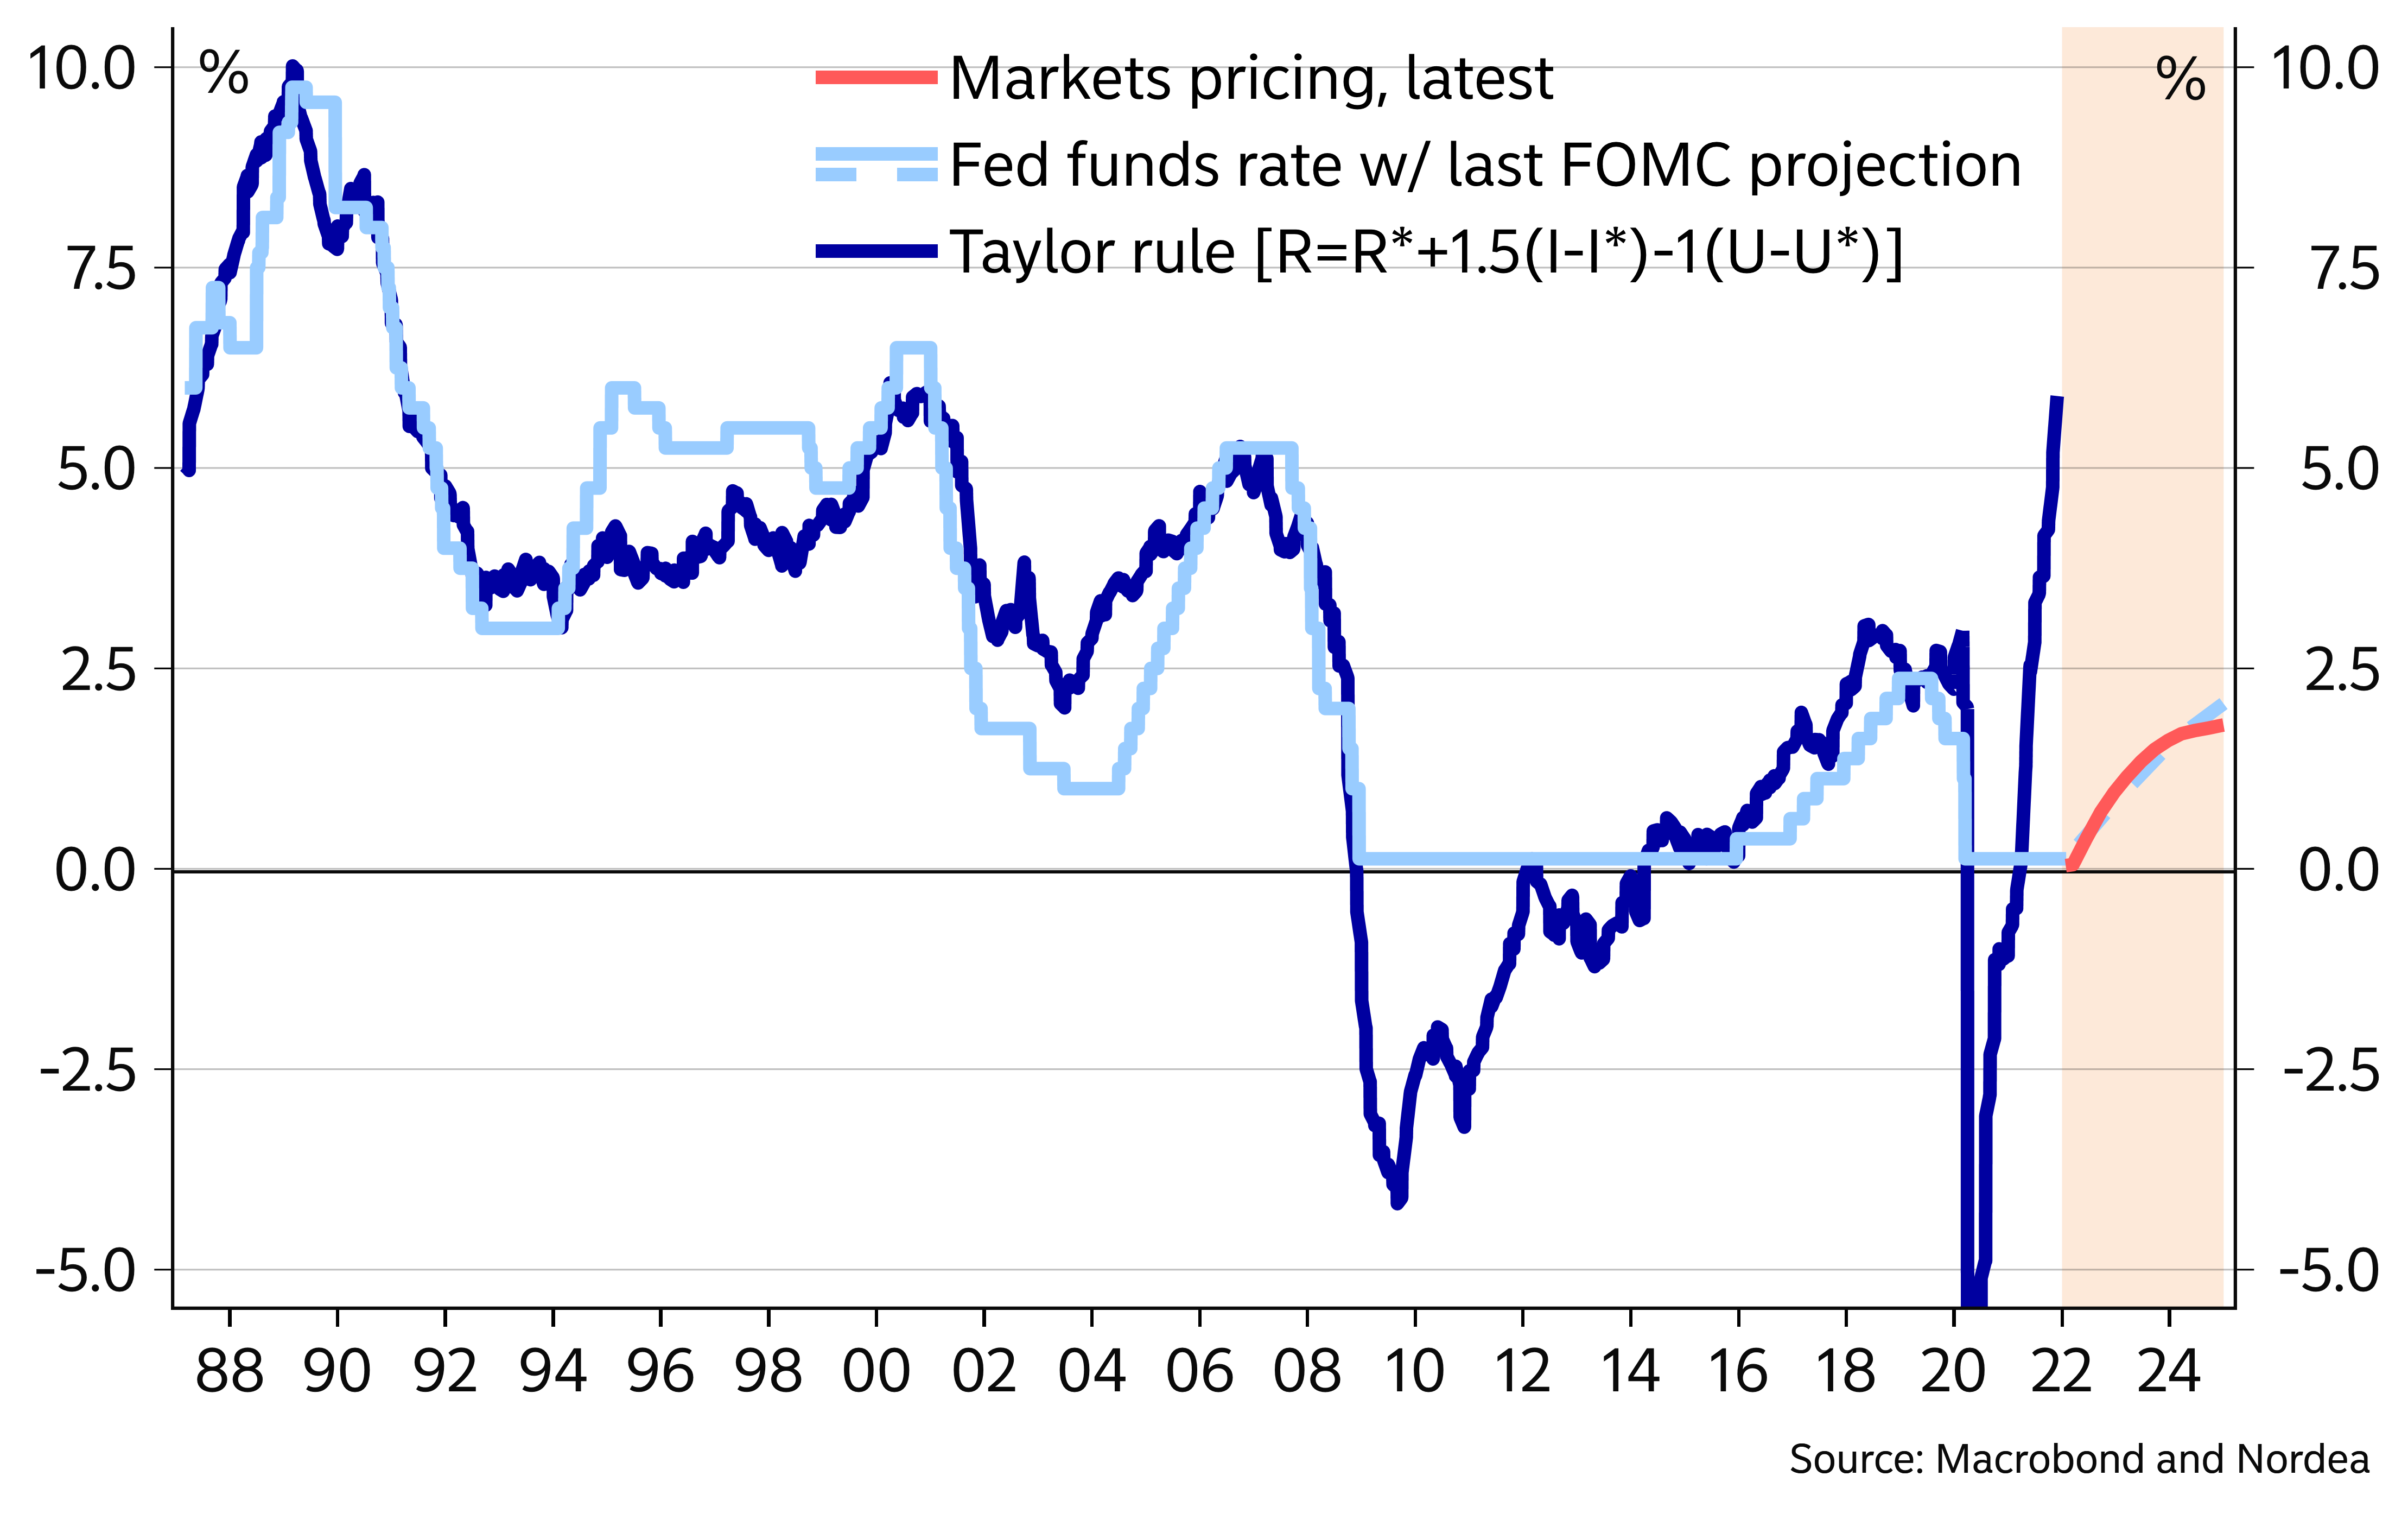
- Calculating a simple cross check by way of the Taylor rule using the latest inflation and unemployment figures gives an indication of the Fed’s tardiness (…) (Nordea)
The Fed funds rate is out of touch with economic conditions on the ground
Note that compensation in service-providing industries rose 1.1% QoQ (4.1% YoY) following a jump of 1.3% (3.7% YoY) in Q3, which was the largest quarterly rise in this series’ short history dating back to 2003. The positive spin highlights the somewhat slower Q4, but the reality is that wages in pandemic-affected services have nonetheless accelerated at a 4.9% annualized rate in the past 6 months. This when the unemployment rate in service occupations is still 5.6% (6.7% in Leisure and hospitality).
-
Restaurant workers are quitting in droves. This is how they are being lured back. Restaurant owners are resorting to new incentives to find workers while experts say it may permanently change the industry.
Restaurant owners are offering shorter workweeks, life insurance, mental health services, college tuition and more paths to career advancement. They are giving out free Spotify subscriptions, adding nursing stations for lactating employees, and promising signing bonuses and free food to anyone off the street who fills out an application. (…)
Workers are stepping away from the industry for good reasons, said Zulma Lowery, 44, a chef and single parent in the Bronx. She said the pandemic exposed how precarious hospitality work has always been. (…)
In 2021, restaurant jobs advertised on ZipRecruiter only received about 18 applicants on average, down from 61 back in 2019, said ZipRecruiter chief economist Julia Pollak. (…)
In response, 84 percent of restaurants reported raising wages, according to the National Restaurant Association (…) Many restaurants are adding benefits not traditionally offered in the industry. (…)
The GS low-wage wage tracker increased to +7.5% year-on-year, its highest level in at least three decades. Rising wages at the lower end of the scale inevitably pushes the whole scale up.

January’s Non-Farm Payrolls will be released Friday. As a preview, initial claims have turned up…

…and JPM’s job tracker is down big time:

HIKES? YIKES!
The new game in town:
Bank of America Fed Outlook Gets More Hawkish Amid Inflation Worries Bank of America has shifted its outlook for U.S. monetary policy in a decidedly hawkish direction, saying seven rate rises from the central bank are likely in 2022.
(…) “The Fed has all but admitted that it is behind the curve” when it comes to controlling inflation, and this monetary policy path “should affect the economy with a lag, weighing on 2023 growth,” Mr. Harris wrote. He said in his note he had trimmed his growth outlook for this year to a 3.6% increase, and he now sees inflation, stripped of food and energy costs, of 3% over 2022, up from a prior estimate of 2.6%. (…)
J.P. Morgan economist Michael Feroli said in a note to clients Friday his bank also expects more increases out of the central bank. “We are revising our Fed call to look for five rate hikes this year (previously four hikes), though we are now looking for only three hikes next year, one less than our prior expectations,” he wrote.
Also weighing in, Evercore ISI said data released Friday support an outlook of five rate rises, but there is a risk that the Fed could raise rates six or seven times depending on inflation. (…)
“With both wage and underlying price inflation spiraling out of control, no wonder the Fed is a lot less confident that this surge will be short-lived,” said economists at Capital Economics, in a note to clients. (…)
- Goldman Sachs Predicts Fed Will Raise Rates Five Times This Year
- Fed could use half-point rate rises if needed, says official Raphael Bostic insists all options on the table at central bank’s remaining seven meetings this year
Powell wants to keep inflation expectations at 2%. Price hikers see differently:

Eurozone energy inflation to drag on household consumption throughout 2022 The eurozone energy crisis lingers on as market gas prices remain elevated and Brent oil prices continue to trend higher. For the eurozone economy, this is bad news. The higher consumer and producer prices are resulting in negative real wage growth and squeezed margins, weighing on private consumption
While we expect nominal wage growth to pick up from here, we expect real wage growth to remain negative for at least the first half of 2022. This adds to a sizeable squeeze in purchasing power for the consumer and dampens growth prospects. (…)
Real wage growth has been squeezed substantially in recent months as energy inflation soars
ING Research forecasts from Q4 2021 onwards
Source: Eurostat, ECB, ING ResearchConsumers still report very favourably on their current financial situation, which indicates that higher energy prices are not yet causing widespread financial problems that derail other consumption significantly. Mind you, much of the impact from higher gas prices will only show in the months ahead. Therefore, it doesn’t come as a surprise that consumers expect a deterioration in their financial situation over the next 12 months and we should see private consumption being affected soon.
In the past, consumers tended to offset higher energy prices with less spending on other services or goods. (…)
Right now, the difference with past episodes of high energy prices is excess savings due to the lockdowns. It could very well be that consumers eat into their excess savings to pay for at least one period of higher energy prices. In such a scenario, private consumption in the eurozone could be relatively unharmed through the current period but chipping in excess savings would still mean less post-pandemic consumption later in the year. One way or the other, high energy prices will weigh on private consumption.

China PMI: Manufacturing sector performance dampened by latest wave of COVID-19
The recent uptick in COVID-19 cases in China, and subsequent round of fresh restrictions, weighed on manufacturing performance at the start of 2022. Companies registered renewed falls in output and new orders during January, though in both cases rates of reduction were only modest. New export business meanwhile fell at the quickest pace since May 2020, and supply chain delays worsened. Average input prices rose at a slightly quicker, but modest rate. Prices charged meanwhile increased following a slight reduction in December.
Manufacturers were confident that output would increase over the next 12 months, often due to forecasts that market conditions will strengthen as the pandemic is brought under control.
The headline seasonally adjusted Purchasing Managers’ Index™ (PMI™) fell from 50.9 in December to 49.1 in January. This signalled the second deterioration in overall business conditions in the past three months, though the rate of decline was only slight.
After rising in the prior two months, manufacturing production across China fell during January. Though modest, the rate of reduction was the quickest seen since last August, with a number of firms linking the fall to lower sales amid the recent uptick in COVID-19 cases both at home and overseas.
Total new orders fell modestly at the start of the year, with weaker external demand a key factor weighing on overall sales. Moreover, new export orders fell at a solid pace that was the quickest seen since May 2020.
Lower intakes of new work led to a renewed, albeit marginal fall in purchasing activity during January. Inventories at manufacturing companies also declined, with both stocks of inputs and finished items falling for the first time in three months.
The rise in COVID-19 cases and fresh restrictions to contain the virus contributed to a further deterioration in supplier performance. The rate at which average delivery times lengthened was the most marked for three months.
As has been the case since August 2021, employment across China’s manufacturing sector fell in January. Though modest, the rate of job shedding was the quickest seen since April 2020. Lower workforce numbers were often the result of company down-sizing and cost-cutting efforts, though there were also reports of difficulties finding staff to fill vacant roles.
Latest data indicated that overall capacity pressure eased, with backlogs of work falling for the first time in 11 months. The rate of depletion, though modest, was the quickest seen since July 2013.
Although input prices rose at the fastest pace for three months, the rate of inflation was mild overall and much slower than that seen on average in 2021. Output prices rose at an identically mild pace, following a slight reduction in December.
Despite ongoing COVID-19 related disruption, manufacturers were highly upbeat regarding the 12-month outlook for output. Notably, the level the optimism strengthened from December, buoyed by forecasts of improving market conditions and reduced supply chain disruption once the pandemic recedes.


The official PMI:
The official manufacturing purchasing managers’ index declined to 50.1, the National Bureau of Statistics said Sunday, just above the median estimate of 50. The non-manufacturing gauge, which measures activity in the construction and services sectors, fell to 51.1, also marginally above the consensus forecast. (…)
The PMI gauge of small companies dropped to 46 this month, the lowest since February 2020 and taking a contracting streak to a ninth month. That came as the indicator of large companies rose to 51.6, the highest in six months. (…)
Construction activity continued to cool this month, with the sub-index falling to 55.4, NBS figures show, suggesting sentiment remained subdued given the property downturn and the limited effect that government spending on infrastructure is having so far. (…)
The expansion of the service sector also cooled sharply to 50.3%, the lowest since August, according to the data, as activity in railway and road transportation, accommodation, and capital market services contracted.
- Sub-index for manufacturing jobs fell to 48.9; non-manufacturing employment slid to 46.9
- Price pressures on manufacturers grew in the month with input and output prices higher
BTW:
- Price indicators in the NBS manufacturing survey suggest inflationary pressures picked up in January – the input cost sub-index rebounded significantly to 56.4 (vs. 48.1 in December), and the output prices sub-index also rose significantly to 50.9 (vs. 45.5 in December) and both above their November levels.
- The NBS new orders sub-index decreased to 49.3 from 49.7. The new export order sub-index increased to 48.4 in January vs. 48.1 in December (weaker in Markit to 46.5 in January vs. 49.9). All in contraction.
This sounds like market share erosion for China:
The Vietnam Manufacturing Purchasing Managers’ Index™ (PMI®) rose to 53.7 in January, up from 52.5 in December and signalling a solid improvement in business conditions that was the most marked since April 2021.
Both output and new orders increased at sharper rates in the opening month of the year as customer demand continued to improve. In each case the rate of expansion was the sharpest in nine months. Total new orders were supported by a further improvement in new business from abroad, with the rate of growth quickening to the fastest since November 2018.

Business conditions across Taiwan’s manufacturing sector continued to recover at the start of 2022. Robust client demand, particularly in overseas markets, supported a further solid increase in total new work, while firms continued to add to their payrolls. (…) new export orders rising sharply. Companies often cited stronger demand across Europe, mainland China and the US.
- China Home Sales Slump Deepened in January in Blow to Economy The 100 biggest companies in China’s debt-ridden property industry suffered a 39.6% drop in sales from a year earlier, compared with a 35.2% decline in December, according to preliminary data by China Real Estate Information Corp.
EARNINGS WATCH
From Refinitiv/IBES:
Through Jan. 28, 168 companies in the S&P 500 Index have reported earnings for Q4 2021. Of these companies, 77.4% reported earnings above analyst expectations and 19.0% reported earnings below analyst expectations. In a typical quarter (since 1994), 66% of companies beat estimates and 20% miss estimates. Over the past four quarters, 84% of companies beat the estimates and 13% missed estimates.
In aggregate, companies are reporting earnings that are 4.0% above estimates, which compares to a long-term (since 1994) average surprise factor of 4.1% and the average surprise factor over the prior four quarters of 16.0%.
Of these companies, 76.8% reported revenue above analyst expectations and 23.2% reported revenue below analyst expectations. In a typical quarter (since 2002), 62% of companies beat estimates and 38% miss estimates. Over the past four quarters, 79% of companies beat the estimates and 21% missed estimates.
In aggregate, companies are reporting revenues that are 3.0% above estimates, which compares to a long-term (since 2002) average surprise factor of 1.2% and the average surprise factor over the prior four quarters of 4.0%.
The estimated earnings growth rate for the S&P 500 for 21Q4 is 25.2%. If the energy sector is excluded, the growth rate declines to 17.1%. The S&P 500 expects to see share-weighted earnings of $441.3B in 21Q4, compared to share-weighted earnings of $352.6B (based on the year-ago earnings of the current 505 constituents) in 20Q4.
The estimated earnings growth rate for the S&P 500 for 22Q1 is 6.8%. If the energy sector is excluded, the growth rate declines to 2.8%.
The estimated revenue growth rate for the S&P 500 for 21Q4 is 13.4%. If the energy sector is excluded, the growth rate declines to 9.4%.
Analysts revisions remain positive:


Goldman Sachs calculates that “of the 44 companies that provided formal FY1 EPS guidance, 23 (52%) have guided above consensus and 21 (48%) have guided below. Since the start of the season, the bottom-up consensus estimate for 2022 EPS has been unchanged.”
Q1’22 EPS growth is now seen up 6.8% vs +7.5% on Jan. 1.
Trailing EPS are now $207.35 with full year 2022 expected at $223.78.
TECHNICALS WATCH
Selling pressure has clearly overtaken buying power, taking many indicators into short-term oversold territory. But breadth remains poor, particularly among small caps. Caution.
The 7 heaviest S&P 500 stocks (27% weight) are down MtD by 12.3% on average (TSLA -19.9%, NVDA -22.3%) and 15.4% from their 52-w high (TSLA -31.9%, NVDA -34.1%). They still average a forward P/E of 42.5 on average (34.9 ex-TSLA’s 88.3).
- “Basically still at about 50/50 on the 200-day moving average breadth indicator: this is not a “sell everything” market, this is a violent rotation.”

Source: @Callum_Thomas IndexIndicators

Source: @SPDJIndices via @LizAnnSonders
- “over 1600 stocks in the Nasdaq have *halved* ! (i.e. down at least 50% vs their 52-week high).”

Source: @sentimentrader

Some history from Goldman Sachs:
(…) market corrections are typically good buying opportunities if the economy is not entering into recession. There have been 33 S&P 500 corrections of 10% or more since 1950. The median episode has lasted roughly 5 months and encompassed a peak-to-trough decline of 18%. Buying the S&P 500 10% below its high, regardless of whether that was the trough, would have generated a median return of +15% during the next 12 months, or 4975 today.
Twelve of the 33 corrections took place within a year prior to a recession. During the 21 non-recession corrections, the S&P 500 typically fell by 15%. A decline of that magnitude today would place the S&P 500 at roughly 4100. The largest non-recession S&P 500 drawdown was 1987, defined by the Black Monday crash. Because prices move faster than earnings estimates, valuation contraction accounted for the majority of historical correction declines.
Via The Market Ear:


Just so you know:
Initial Estimate of First-Quarter GDP Growth Is 0.1 Percent On January 28, the first GDPNow model estimate for real GDP growth in the first quarter of 2022 is 0.1 percent.

AlphaTrAI Quant Says Risk-Parity Old Guards Are About to Suffer
(…) I do think we are going to see this secular rising-rate environment come back and that really poses a challenge, not only for 60/40, but the thing that supplanted 60/40 for a lot of institutional portfolios, which is risk parity. And while risk-parity folks will tell you that it’s very sophisticated, having run risk-parity strategies before, I can tell you that generally speaking, it still relies on the crucial concept of bonds go up when stocks go down, and rate and duration risk diversifies equity risk. If that’s no longer is the case, you need to create something different. (…)
FYI:

Will this turn out into another classic BW front page? It sure is what I experienced in Quebec this January: mean temperature -13.5C (7.7F), average minimum: -19.0C (-2.2F).

Argentina, IMF Agree to Restructure $44 Billion Bailout Latin American nation seeks to avert currency crisis, debt default with deal to reduce public spending, money printing
Argentina joined the International Monetary Fund (IMF) on September 20, 1956 and has since participated in 22 IMF Arrangements. That’s one every three years!


