HOUSING
U.S. Home Builder Index Slips in January
The Composite Housing Market Index from the National Association of Home Builders-Wells Fargo fell 1.2% in January to 83 (unchanged y/y) and reversed its December gain to 84. The decline followed four consecutive monthly increases. Stability had been expected in the INFORMA Global Markets survey.
The Home Builders indicated that “NAHB analysis indicates the aggregate cost of residential construction materials has increased almost 19% since December 2021,” due to supply chain issues.
The index of expected sales in the next six months fell 2.4% and was unchanged y/y at 83. The index measuring traffic of prospective buyers fell 2.8% (+1.5% y/y) to 69 and reversed December’s rise. The index of present sales conditions held steady both m/m and y/y at 90 in January.
This month’s regional movement was mixed. The index for the Northeast fell 11.3% (+4.4% y/y) to 71 following a 15.9% December gain. In the South, the home builder index declined 2.2% (+6.1% y/y) to 87 and reversed December’s rise. In the Midwest, the index fell 2.6% (-7.5% y/y) to 74 following a 1.3% December improvement. Rising 1.1% (-4.3% y/y) was the index for the West as it reversed December’s decline. These regional series begin in December 2004.

Cincinnati Agency Buys Nearly 200 Rental Homes, Thwarting Private Investors City plans to upgrade rental homes and sell to tenants in affordable-housing effort
A Cincinnati government entity outbid more than a dozen investment firms to buy 194 homes in and around the city, a move meant to keep tenants in their homes and private investors out of their neighborhoods.
The Port of Greater Cincinnati Development Authority agreed last month to pay $14.5 million for the properties scattered throughout Hamilton County, which includes Cincinnati. While continuing to operate them as rentals, the agency said it intends to upgrade and eventually sell the homes to their primarily low-to-middle-income tenants. (…)
Five landlords have bought more than 4,000 single-family homes in Hamilton County since 2008, according to an analysis of property records by the Port Authority. (…)
Investors now account for about 18% of all U.S. home sales, up from about 8% in 2009, according to real-estate company Redfin Corp. Big firms supply much-needed rental housing and in some cases manage properties better and more cheaply than small owners. But critics say they also help push up property prices and limit the number of homes for sale, making it harder for people to become homeowners and worsening wealth inequality. (…)
According to Core Logic, investors typically account for 10-15% of total home sales nationally but that share rose to ~25% in Q3’21. Some regions are more attractive than others to investors. In MSAs like Phoenix, Atlanta, Vegas, Tampa, NYC, Austin, Orlando, Jacksonville and San Antonio, investors have grabbed 30-40% of total home sales.
- Available Homes Shrink More Than 30% in Hottest Housing Markets Seattle had the fewest months of supply, with San Jose and Denver close behind. Active listings in those markets fell by more than 30% in December compared to the previous month, according to data from Redfin Corp. Listings typically increase in January as the spring selling season approaches, but Redfin expects that buyers will continue to outpace sellers.
On rent, one smart noflationist pundit recently noted that “According to the latest Apartment list data, the consultancy’s national index fell by 0.2% during the month of December, marking the only time in 2021 when rents declined month-over-month.”
For his own reasons, he forgot to quote this little sentence: “(…) a slight dip in rents at this time of year is typical of seasonality in the market (…), with this supporting chart:

Meanwhile, China needs to address its own particular housing challenges:
China Considers Major Step To Ease Developer Cash Crunch
Chinese regulators are considering lifting some restrictions on developers’ access to cash from presold properties tied up in escrow accounts, according to people with knowledge of the matter, a potentially major step toward easing the industry’s liquidity crunch.
Regulators including the housing ministry and the banking watchdog are still discussing details and may convey the instructions through window guidance to local governments later this month, said the people, asking not to be identified because the talks are private. Authorities are contemplating a package of policies to prevent a deepening of the real estate crisis, one of the people said. (…)
INFLATION
The Conference Board’s C-SUITE OUTLOOK
Inflation concerns are skyrocketing. Over half of CEOs globally (55 percent) expect elevated pricing pressures to last until mid-2023 or beyond. Inflation has jumped to the second-highest external threat to business from the 22nd in our 2021 survey. Most respondents, including 95 percent of CEOs based in manufacturing, say they’re currently facing upward pricing pressure for inputs (e.g., raw materials, wages) due to supply chain bottlenecks, labor shortages, and volatile energy prices. To cope, they plan balancing actions that include cutting costs, passing increases downstream to consumers and end users (the strategy most favored by US CEOs), and absorbing price increases into profit margins (though there are currently few signs that CEOs are willing to take this action). Few see changing vendors as a viable solution—likely a reflection of tight supplies.
CEOs expect supply chain disruptions to be a high-impact issue in 2022. Current short-term remedies, such as earlier advance orders and higher inventory targets, have increased volatility and amplified the inflationary effects of shortages. Strong demand for goods and insufficient supply may keep order backlogs elevated, increasing costs for manufacturers and the businesses they supply. Geopolitical tensions contribute to the uncertainty, a key downside risk to The Conference Board outlook for the global economy in 2022. The US and China may intensify trade actions that treat each other as economic and political competitors. Our survey shows that supply chain disruptions, a top-five external stress point for CEOs globally, are being most acutely felt in the US and Europe, as well as in the manufacturing sector. Adapting to new conditions will take time—when governments shut down economic activity to manage the pandemic, supply chains seize and are not easy to start back up. While some short-term supply chain solutions are expensive (air freight, onshoring, leasing of cargo ships, storage, including cold storage), companies that are able to be agile about how they source will reap the rewards. And there’s a silver lining to this situation: potential profits. Scarce goods can mean higher prices, potentially bigger margins, and less discounting.
Markit:
A further aspect of the surveys to watch is the feed through of price hikes to the service sector and wages, as second-round inflation effects such as rising wages could be key to the degree of policy tightening we see over the course of 2022 from the major central banks. The alleviating supply crunch has principally helped reduce the rate of manufacturing cost pressures, but a far smaller easing in service sector’s price gauges was evident globally in December, reflecting the sector’s greater exposure to staff costs.
Global employment growth slowed to a three-month low in December, in part reflecting ongoing problems in recruiting or retaining suitable staff, often resulting in higher wages and salaries, notably in Europe (especially the UK) and in the US. The number of service providers reporting increased costs due to rising staff wages and salaries hit the highest since 2007 globally in December, helping sustain global service sector cost inflation at a rate only slightly shy of November’s 13-year high.
In the U.K.:
Demand for staff from employers reportedly also continued to rise at a rate not seen over the two decades prior to the pandemic (…). At the same time, staff availability continued to deteriorate at a rate rarely exceeded in the recruitment survey’s 24-year history, albeit below the rate of deterioration seen in mid-2021. (…)
Average starting salaries and average pay for temp/contract staff rose steeply again in December. For permanent salaries, only in October and November 2021 had the recruitment industry survey ever recorded a stronger rate of wage inflation than that seen in December.
The impact of staff wages on prices is already clearly evident in the PMI survey responses. Record numbers of companies cited higher staff costs as a contributor to higher prices throughout the fourth quarter of 2021.


Goldman’s Pay Raises Weigh on Its Profit The Wall Street giant’s compensation expenses soared 33% in 2021, contributing to a fourth-quarter earnings decline. JPMorgan and Citigroup also spent more on pay.
Goldman Sachs Group Inc. GS -6.97% said Tuesday it shelled out an additional $4.4 billion in compensation in 2021, sending the bank to its only quarterly profit decline of the year. JPMorgan Chase JPM -4.19% & Co. on Friday said it had spent an additional $3.6 billion on compensation in 2021, and Citigroup Inc. C -2.44% spent an additional $2.9 billion, dragging down its fourth-quarter profit as well. (…)
Goldman raised compensation by 8% in 2020, even though revenue jumped 22%. In 2021, Goldman boosted its pay by 33%. Revenue also jumped 33%.
“There is real wage inflation everywhere in the economy,” Goldman CEO David Solomon said on a call with analysts. (…)
But the compensation expenses weighed on fourth-quarter results. Goldman’s fourth-quarter profit declined 13% to $3.94 billion, or $10.81 per share, ending what had been a streak of big gains. The bank also missed analysts’ forecasts for per-share earnings. (…)
Goldman, for example, increased base pay for its entry-level employees—first-year analysts—to $110,000, a nearly 30% increase from the previous starting salary of $85,000. (…)
Goldman is also giving its partners an additional one-time stock bonus.
JPMorgan this week is awarding investment bankers bonuses from a pool that is 30% to 40% higher than it was a year ago, according to a person familiar with the matter.
“We will be competitive in pay,” JPMorgan CEO Jamie Dimon said last week on a call with analysts. “If that squeezes margins a little bit for shareholders, so be it.” (…)
- JPMorgan Raises Salaries for Junior Bankers for Second Time The U.S. lender is increasing pay for first-year investment banking analysts to $110,000, up from $100,000, according to a person familiar with the matter. The bank is raising second-year analyst pay to $125,000 and third year pay to $135,000. Salaries in the markets unit will also see similar jumps. The raises will apply internationally and pay for associates will also be increased, the person said.
- Cathay Pacific Offers Pilots $3,700 Bonuses to Keep Flying
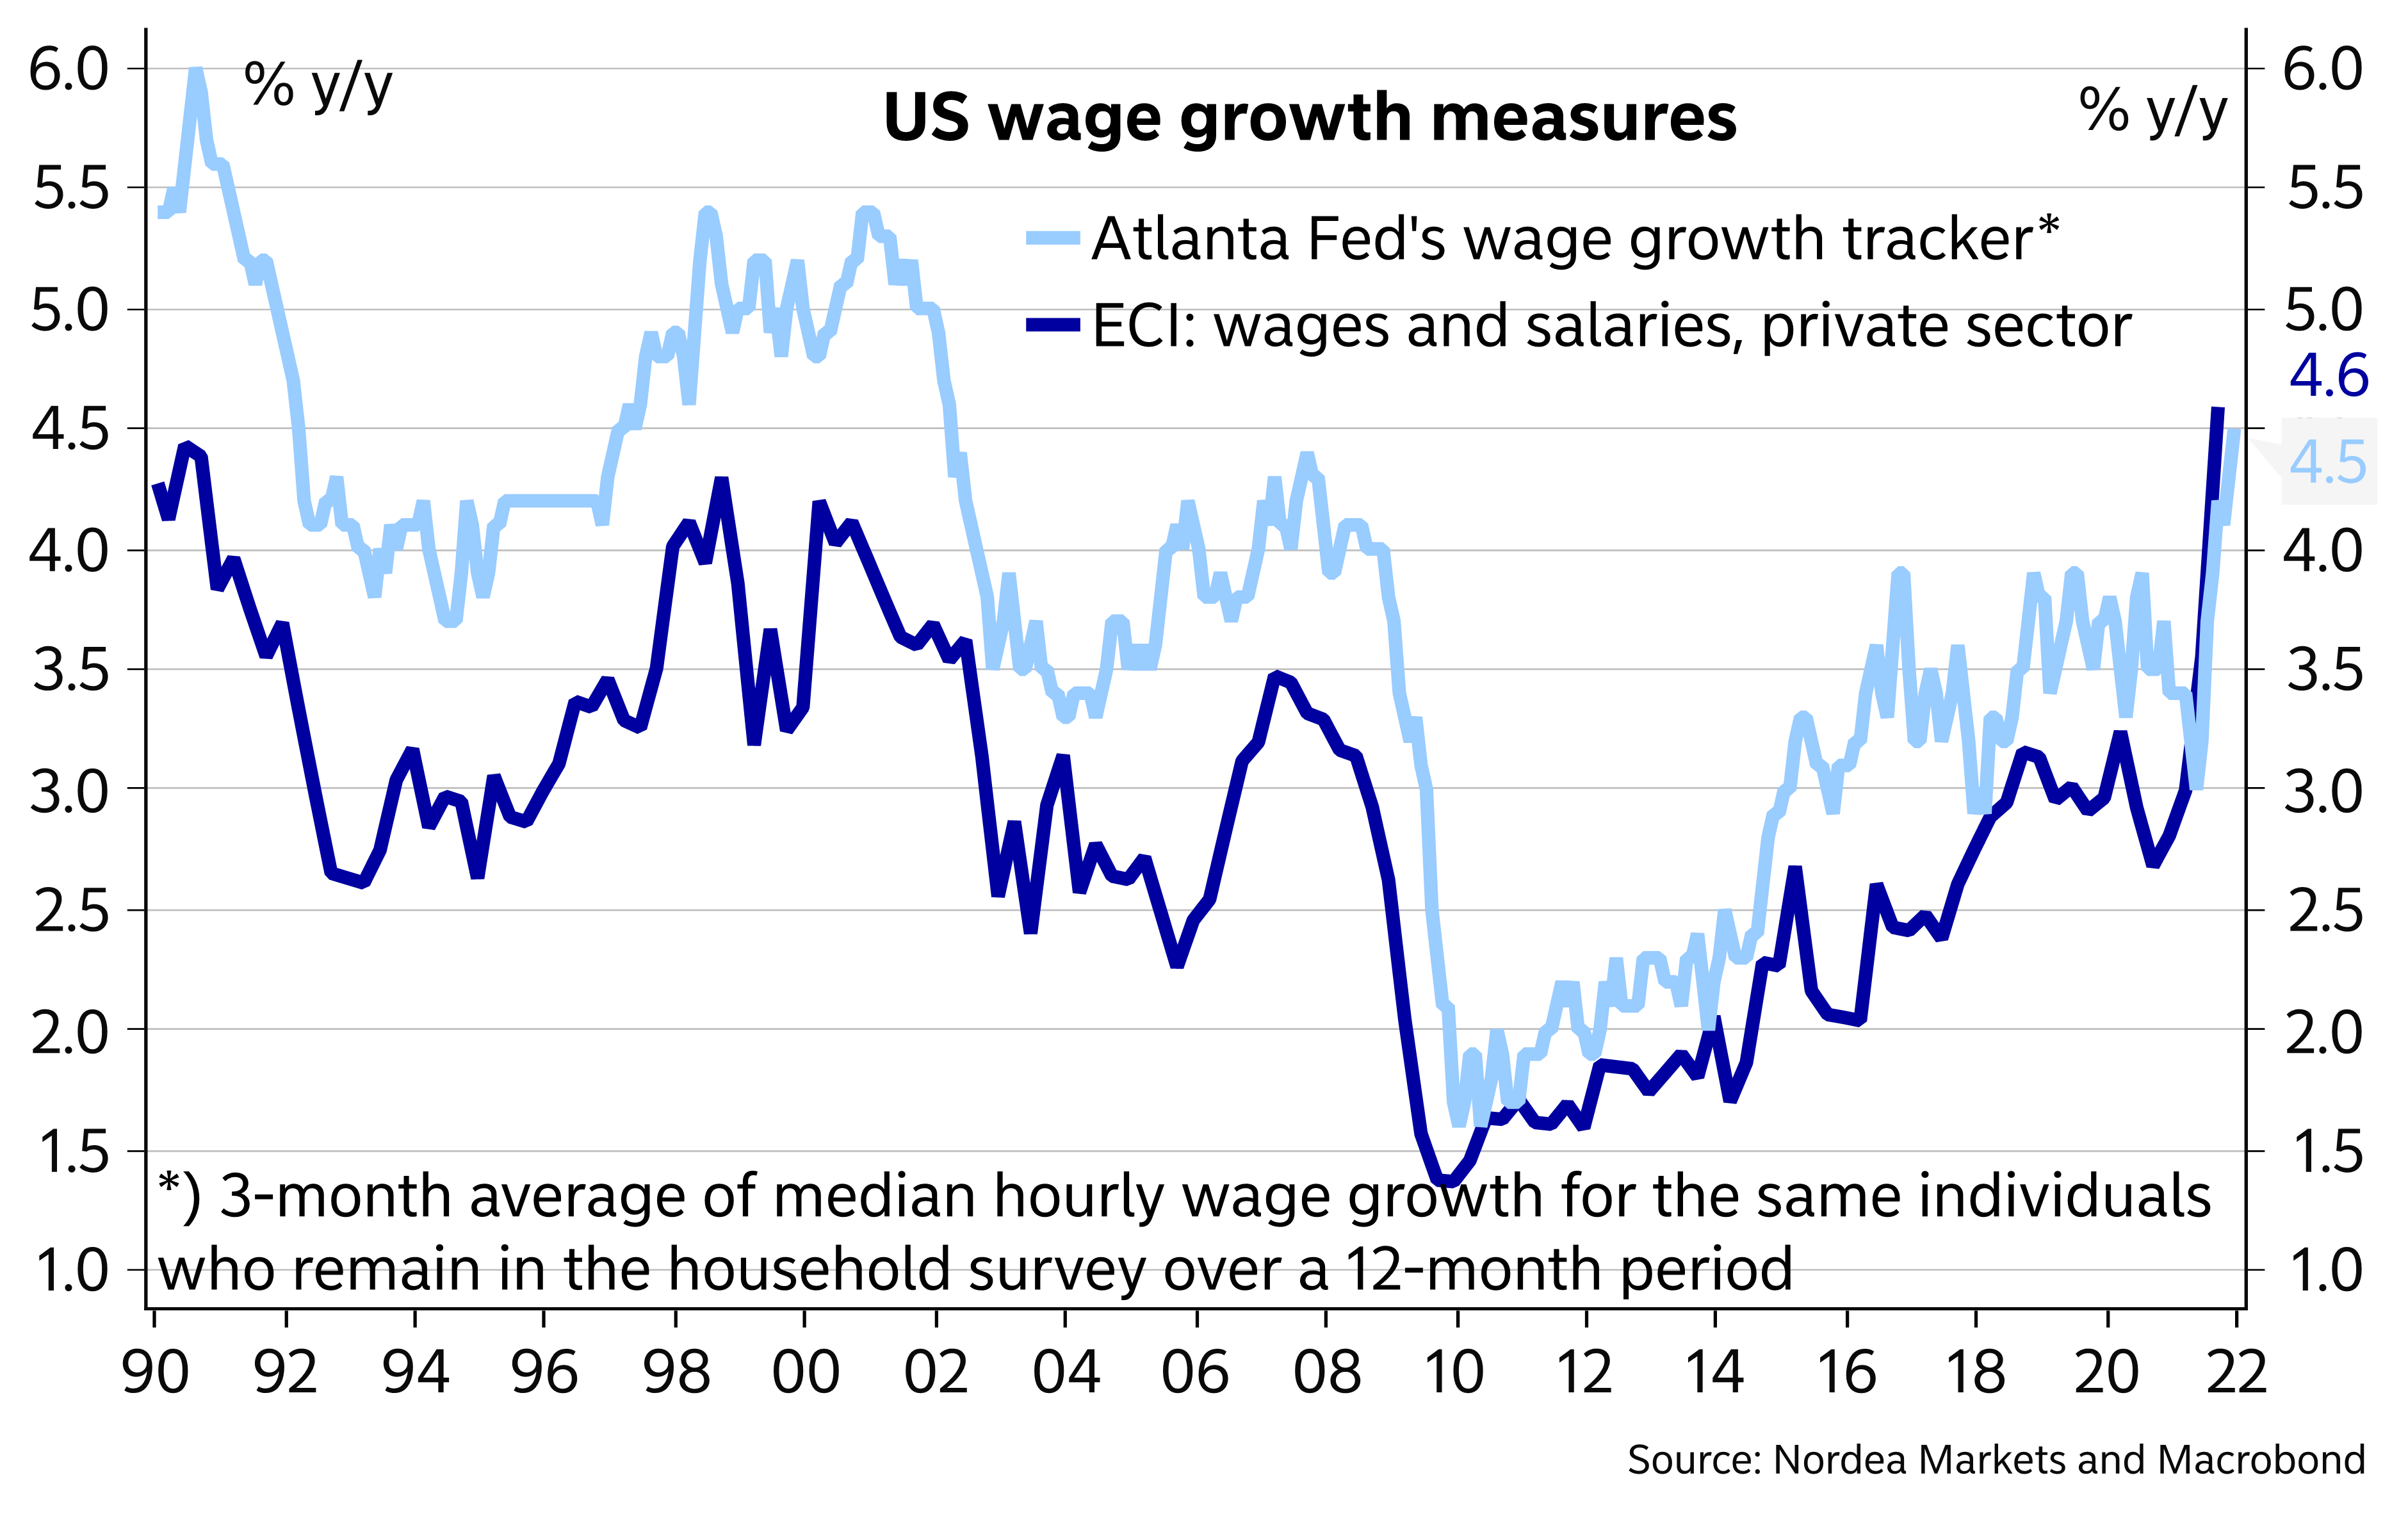
While headline inflation is likely peaking, underlying inflationary pressures look broadly based. Traditional measures of spare capacity still suggest that the labour market is not yet super tight, but wage growth has already picked up and both surveys and the number of job openings strongly suggest that shortage of labour will push wage growth further up – and keep underlying inflationary pressures elevated.
Given the challenging outlook for prices, any fine-tuning of monetary policy will clearly not be sufficient to bring inflation back to the Fed’s flexible 2% target. In response to the economic and inflation outlook together with the increasingly hawkish Fed comments, we add hikes to our baseline forecasts. We now expect the Fed to hike four times this year, starting in March, to be followed by another four in 2023. (…) The risk of even faster hikes should thus by no means be disregarded if a slower pace of tightening fails to tame inflation. (…)
Our more aggressive Fed call naturally has repercussions also longer out the curve. The market is close to pricing in four 25bp rate hikes for this year, and it may be difficult for the market to price in much more than that in the short term. However, longer out the pricing continues to look rather modest as the market continues to price in a terminal Fed funds rate of clearly below 2%, which still appears low compared with the need to reign in inflationary pressures. While the market is likely to remain reluctant to price in a considerably higher terminal Fed funds rate in the near term, we do see more room for such pricing to surface later this year and next and see higher bond yields also at the longer end of the curve. (…)
Oil Hits Fresh Seven-Year High as IEA Turns Bullish on Outlook The global supply surplus is shrinking and oil demand is on track to hit pre-pandemic levels, according to a report from the IEA. The agency also said there’s a growing gap between changes in global stockpiles and supply-demand balances. That’s a further indication that production could be lower, or consumption could be higher, than the market estimates, it said.
(…) The sizzling start to the year has prompted Goldman Sachs Group Inc. to boost its forecasts for global benchmark Brent, predicting $100 oil in the third quarter. (…)
The IEA’s report said global oil inventories have plunged over the last 12 months. Stockpiles are down by more than a billion barrels since the peak of May 2020 and are well below pre-pandemic levels, the report said.

FIBER: Industrial Commodity Prices Strengthen


- New Car Price Keeps Climbing, with Average Now at Almost $47,100: Reduced supply, increased demand: It all adds up to higher prices for the new-car-buying public. (Car and Driver)
German Benchmark Bond Yield Turns Positive for First Time Since 2019 Rates globally are being pulled up by U.S. bond yields as investors anticipate faster inflation and more aggressive rate increases from the Federal Reserve
(…) The equivalent U.S. Treasury note yield was at 1.893% after rising steadily in recent weeks. The German bund is commonly considered to be a proxy for Europe’s risk-free rate and is watched as closely as Treasurys in the U.S. The spread, or difference in yields, between 10-year bunds and Treasurys reached 1.88 percentage points. (…)
Markets are signaling expectations that the European Central Bank may have to follow the Fed and tighten monetary policy in the coming months to deal with the higher inflation. The overnight index swap market, a proxy for where markets think ECB policy rates are heading, is pricing in two 0.1 percentage point rate increases this year and three to four more increases in 2023. That would mean the end of negative eurozone policy rates by next year. (…)
Positive yields on supersafe government debt mean European investors will now likely buy more bonds at home, which could lower demand in other markets such as Treasurys, according to Iain Stealey, chief investment officer for fixed income at J.P. Morgan Asset Management. This could accelerate the rise in Treasury yields.
On the flip side, higher yields overall would also mean bond markets attract more capital, as investors seek to lock in lower-risk returns. (…)

(KKR)
- How net flows can help keep 10Y Bunds over 0% Already caught in the slipstream of globally rising rates, a deteriorating overall net flow backdrop in eurozone government bonds should contribute to keeping the 10Y Bund yield above 0%
Though European Central Bank policy tends to lag behind its Federal Reserve and Bank of England counterparts, as policymakers have been more reluctant to abandon the transitory inflation picture, the 10Y Bund yield has now crossed over the 0% line.
One reason for this is that even while clinging on to the ‘transitory inflation’ story, the asset purchase programmes have been scaled back considerably, the trajectory laid out suggesting an end of net asset purchases by the end of this year.
And this already impacts the near term cash flow picture for Bunds. In the final quarter of 2021, German central government gross capital market issuance amounted to €48.5bn. We estimate that the ECB bought an almost equal amount of central government longer-term debt over the same time via the pandemic emergency purchase programme (PEPP) and asset purchase programmes (APP). Taking into account that bonds worth €37bn matured, the overall outstanding market size of Bunds shrunk by around that magnitude in 4Q21.
The first quarter of 2022 paints a less favourable flow picture for Bunds. Issuance is seasonally higher, factoring in the possibility of syndicated deals potentially above €60bn. While redemptions are at a similar level to 4Q21 coming in at €36.5bn, and coupon payments lend some additional support, ECB buying should slow noticeably – we reckon that Bund purchases will barely reach €30bn. That would put the overall net flow into the vicinity of minus €10bn, still negative but significantly less so than the minus €37bn of the previous quarter.
For the entire year we are looking for an overall net flow in German government bonds of minus €20bn. Taking into account the German debt agency’s stated aim of reducing its own holding created during the crisis by €20bn per year, the outcome would be a largely balanced flow picture, contrasting an ultra-supportive minus €130bn estimated for 2021. In other jurisdictions outside of core eurozone countries, most notably France, we are expecting a more obvious flip into a positive cash flow that investors will now have to absorb.
TECHNICALS WATCH
Technical warnings on par with prior peaks
Near the end of December, there was a surge in buying pressure in many stocks. That led to positive breadth thrusts in the S&P 500 and even among broader securities traded on the NYSE. Markets have not reacted well since, which is a worry.
From a longer-term point of view, there are other concerns. Over the past six months, there have been many days when indexes like the S&P 500 or Nasdaq Composite have reached a 52-week high. However, within mere days, more stocks and other securities were trading at 52-week lows than 52-week highs.
That type of behavior has triggered a cluster of Titanic Syndrome warnings for securities on the NYSE. Since November, there has been a rash of them, with isolated signals dating to last spring.
Those haven’t just been firing on the NYSE. While fewer lately, there have also been a bunch of signals among securities traded on the Nasdaq.
When we combine the signals on both exchanges and tally them up over the past 6 months, there have been 34 signals. In other words, nearly 30% of all days since July have seen a Titanic Syndrome warning on either the NYSE or Nasdaq exchanges. This is the 3rd-highest reading in almost 40 years, next to 1999-2000 and 2007. Early 2015 is the only other environment that comes close.
The 6-month rolling sum has just started to curl down, suggesting it may have peaked. After other peaks, the S&P 500 showed minimal upside. (…)
The tendency to see more securities falling to 52-week lows than rising to 52-week highs soon after major indexes themselves closed at new highs is disturbing. This kind of behavior has been going on for 6 months or more and is among the most egregious in 40 years.
As Lowry’s Research says, market bottoms are events but market tops are processes. BTW, my favorite technical analysis firm, post yesterday’s action, now clearly goes defensive. The S&P 500 Index is sitting on its (still rising) 100dma. The small cap 600 went trough its own (flattening) 200dma while the Russell 2000 broke its 10-month resistance line with declining dmas. Nasdaq is flirting with its (still rising) 200dma, like the NYFANG.
RBC Tilts Away From Battered Small-Caps, Drops Bet on a Rebound
(…) Companies with market values of about $2 billion or less tend to outperform at times when inflation expectations are rising. But that hasn’t been the case recently, even with consumer prices in the U.S. surging at the fastest pace in four decades.
(…) smaller companies may have a tougher time managing Covid-19 disruptions than bigger companies, according to Calvasina. The Federal Reserve is also widely expected to kick off a cycle of interest-rate hikes in March. As interest rates climb, so will the cost of the loans that small businesses carry, she added.
“Small caps have at least a third of their debt in variable rate instruments,” Calvasina wrote in her note. “Equity investors often get nervous about small caps when interest rates are rising due to leverage.”
Microsoft Expands Its Videogame Business With Activision Deal Microsoft plans to buy Activision Blizzard in an all-cash deal valued at about $75 billion, Microsoft’s largest acquisition by far.
- China Notifies Firms of Tougher Investment Rules for Big Tech The new regulations are likely to curb domestic technology giants from growing even bigger through acquisitions, according to people familiar with the issue.
China has notified some companies of new rules that require the country’s biggest internet firms to seek approval for investment deals, a mechanism that is likely to curb domestic technology giants from growing even bigger through acquisitions, according to people familiar with the issue.
The country’s top internet regulator, the Cyberspace Administration of China, recently established a new mechanism that requires internet companies to obtain formal approval for investment deals if they have 100 million users or more or have posted revenue in the previous year of at least 10 billion yuan, equivalent to $1.57 billion, the people said. (…)
The new requirements come after a year of clamp downs on the country’s internet sector, and could lead to increased regulatory scrutiny into such deals and even block internet companies from making certain investments, the people said. (…)
What the Failure of the US-NATO-Russia Talks Means Putin can’t enter the Ukraine crisis and leave with nothing.
COVID-19
The Omicron wave is likely beginning to recede in the U.S., experts tell Axios health care editor Tina Reed. (…) While cases are beginning to fall in the East Coast cities that were among the first to see the variant take hold, Omicron likely hasn’t peaked yet in other parts of the U.S.

State of Affairs: Jan 18 Dr. Katelyn Jetelina
(…) While many countries are on their way up the curve, the Omicron leader—South Africa—continues to decline. Interestingly, South Africa is taking its time with the descent. While it took 3 weeks to peak, it’s been almost 5 weeks in the descent and hasn’t reached pre-Omicron levels yet. South African deaths are still increasing and are now 23% of that of the Delta wave. Not even their Omicron wave is over yet.
There are a few countries in particular that I’m paying close attention to right now:
Netherlands: This was the first European country to return to a full lockdown with the arrival of Omicron. And it seems to be paying off: While their cases are increasing, their hospitalizations and ICU trends are exponentially decreasing. They have great vaccination coverage (71%), but it certainly isn’t high enough to drive this pattern alone. A few days ago they lifted the lockdown, so I will be closely watching their indicators.
Japan: Vaccine+ plan (80% fully vaccinated plus masks, contact tracing, communication, and quarantining) continues to work. Cases have begun to uptick, so it will be interesting to see if their model holds up with Omicron as it has throughout the pandemic.
Australia: They continue to be interesting to follow, as they’ve had tight lockdowns throughout the pandemic. While they have high vaccination coverage (78%), it’s not doing enough for Omicron. Australia has a ridiculous number of cases right now—almost double that of the United States—and severe disease indicators are trending upwards.
But, no matter where Omicron goes, it’s clear that these severe cases are largely among the unvaccinated. For example, the Intensive Care National Audit & Research Centre in the U.K. updated their analysis of COVID-19 patients in the ICU in England, Wales, and Northern Ireland. The figure below says a thousand words. (For those of you looking for absolute risks, go here. For example, the 5-year risk of ICU is less than 0.01% across all age groups now).
Image by Paul Mainwood
Our World in Data reports the death rate of 15 countries by vaccine status. It doesn’t take too long on this page to see how well vaccines are working, even during the Omicron wave. For example, Switzerland now reports deaths by booster status and the story is also clear.
The United States is averaging a staggering 801,903 cases per day with a 98% increase in the past two weeks. Our cases have plateaued, which could be an indication of one of three things:
We reached testing capacity. I would not be surprised if this happened, but I don’t think this is the case because test positivity rate (TPR) has also shown indications of peaking at 29%.
Holiday effect: A weekend effect and, specifically, a holiday effect. We should know if this is the case pretty soon as data will be dumped later today; or,
Peak: We truly peaked on a national level. This would be sooner than we expected (projections were estimating Feb 3), but obviously a welcome sign.
(…) States in the West are now growth leaders, with cases in Alaska (+610%), Texas (+428%), Utah (+414%), Oregon (+402%), and Montana (+394%) exponentially increasing in the past 2 weeks. While some of these cases are among the vaccinated, cases are still dominated by unvaccinated people. (…)
On average, 155,943 people are hospitalized for/with COVID19 in the United States, which has increased 61% over the past 2 weeks. We have long passed last winter’s peak (and the previous record) by 20,000 hospitalizations and counting.
In fact, 31 states are reporting hospitalization rates higher than previous winter. Washington, D.C. is just hammered with hospitalizations at 308% of last winter’s hospitalizations, equating to 128 per 100,000 residents being hospitalized for COVID19. This is followed by Delaware (70 per 100K), New Jersey (70 per 100,000), New York (68 per 100K), and Pennsylvania (63 per 100K). Thankfully, though, it looks like hospitalizations in these states are slowing down and will be on the descent soon.
(NYT)
(…) And, just like other countries, vaccines continue to work. For example, the graphs of daily hospitalizations in New York State and Nebraska are worth a thousand words. Hospitalizations and deaths among the vaccinated aren’t even a blip on Oregon’s graph, too.
(New York State)
(Nebraska Medicine)
And, finally, we are averaging a sobering 1,964 deaths per day in the United States. Yesterday we hit 850,000 deaths in the United States. For the record, this is one of the highest death rates per capita in the world. And the majority of the last 250,000 deaths were vaccine preventable. As Peter Hotez said, “Death by anti-science.” And a true national tragedy.
Bottom line:The United States has reached (or is close to reaching) its case peak, which is a very welcome reprieve. But this only means we are halfway through the Omicron wave—there will be the same number of new infections on the way down as there were on the way up. Hospitalizations and deaths will follow. Nonetheless, vaccines continue to work really well. But it’s clear that a vaccine-only approach isn’t going to get the United States out of this pandemic.