U.S. Retail Sales Unexpectedly Tumble at Yearend
Total retail sales including food service and drinking establishments declined 1.9% (+16.9% y/y) during December following a 0.2% November increase, revised from 0.3%. During all of last year, retail sales rose 19.4%. October sales rose an unrevised 1.8%. (…) During all of last year, nonauto sales increased 18.4%. October’s 1.8% increase was unrevised.
Sales in the retail control group, which excludes autos, gas stations, building materials and food services, fell 3.1% last month (+12.9% y/y) following a 0.5% November decline, revised from -0.1%. (…)
Retail purchases via the internet plummeted 8.7% (+10.7% y/y) last month following a 1.5% decline. (…)
Sales at restaurants & drinking establishments fell 0.8% last month (+41.3% y/y) after a 0.6% November increase.
Omicron and supply bottlenecks are taking most of the blame in media and research reports.
Don’t be fooled: if Omicron had been a big factor, online sales would not have cratered 8.7% MoM, substantially worse than the -1.9% for all retail sales. Online sales were also down 1.5% MoM in November when total sales were up 0.2%. In the last 2 months of the year, online sales unusually declined 10.0% from their October level.
On a YoY basis, Q4 online sales were up 10.4% while Control Sales ex-restaurants/bars rose 12.9% and Department Stores sales jumped 23.6%.
These are all nominal dollar sales. In real terms, Q4 online sales unusually lagged, being up 8.2% YoY against +10.7% for Control Sales.
The big surprise was in the November/December period when online sales dropped 10.2% from October, -11.4% in real terms. On a YoY basis, real online sales declined 4.6% in the last 2 months of last year.
This is a big deal:
- It confirms that Omicron was not the problem for weak year-end sales. The American consumer simply slacked off during the 2 most important months of the year.
- Right when retailers were scrambling to get enough inventory to meet a widely expected booming demand.
- Recall that AMZN, TGT and WMT all boasted they had ample inventory for the Holidays rush.
- There are still a lot of goods floating offshore L.A. waiting to be shipped to retail warehouses across the U.S..
- But booming demand no more. Demand for goods is dropping fast from its April peak.

Real retail sales are still about 6% above pre-pandemic trend but they declined at a 7.6% annualized rate since April 2021. The last 3 months were high consumption months so demand could be really weak during the next 6 slower consumption months.
Reminder: Approximately 57% of U.S. households earn less than $70,000 per year. According to a December 2020 study by CNBC, 63% of
Americans have been living paycheck to paycheck since the start of the pandemic.
My CPI-Essentials measure is at +7.0% YoY, from 2.9% pre-pandemic. It rose only 0.35% MoM in December, thanks to Energy being down 0.4% as oil prices fell to $71. It’s now $82.
CPI-ESSENTIALS


The Chase card spending tracker remains weak, down 1.9% from its pre-Covid trend as of January 9. YoY comparisons will be very challenging at least through the spring given the significant boost from stimmies last year. Real retail sales jumped 15% between December 2020 and April 2021.
Unless Americans start splurging on goods again (can they really?), the economy will fight a sizeable inventory overhang, forcing liquidations and production curtailments. At the end of November, wholesale and manufacturing inventories were 15.3% and 8.9% above their pre-pandemic levels respectively. Retail inventories were 5.8% lower but with floating goods coming their way and weak sales, they are likely to put the brakes on new orders until their stocks are normalized.
Many producers will be caught by surprise. From the December Markit Manufacturing PMIs:
-
The global manufacturing sector ended 2021 on a positive note. Rates of increase in output, new orders and employment all accelerated, while business optimism data indicated companies expect output to rise further over the coming year. The continued upturns in output and new orders, alongside rising backlogs of work, encouraged companies to increase
staff headcounts in December. -
ASEAN: Output and new orders expanded again, with the pace of growth in the former nearing October’s peak. December data also pointed to accelerated purchasing activity at ASEAN goods producers. In fact, the rate of increase was the quickest on record. Subsequently, pre-production inventories ticked up further.
- Canada: Sustained increases in output, new orders and employment were recorded as well as the fastest uptick in pre-production inventories for over 11 years of data collection. As a result, firms added to their inventories, as has been the case over the last 11 months. The overall rate of expansion was marked, and the quickest in the 11-year history of the survey.
It seems to have already started in the USA:
- December PMI data from IHS Markit indicated a further subdued upturn in production across the US manufacturing sector. With the exception of October and November, the pace of output growth was the slowest since October 2020. At the same time, companies recorded the softest rise in new orders for a year and a further substantial deterioration in vendor performance amid severe material shortages. Although some firms stated that demand was sustained at a strong pace, many suggested that customers were working through their stocks of goods before placing orders. The rise in foreign client demand was only marginal overall.
From the Atlanta Fed on Jan. 12:
Atlanta Fed contacts told the Bank’s Regional Economic Information Network (REIN) staff that they are “intensely focused” on retaining employees in a tight labor market that offers abundant opportunities for workers to leave jobs for better pay or working conditions. Some contacts said they are raising pay, notably among lower-wage workers and new hires, while others instituted bonuses for workers who stay for two years. Many companies reported that wage growth is higher than they planned and will likely rise even more in 2022.
Some small companies are trying to keep their payroll under 100 employees to stay below the threshold for the expected vaccine and testing requirements. Several employers also said they plan to automate to reduce their reliance on workers.
McDonald’s locations have cut hours by 10% due to staffing shortages: CEO McDonald’s and its franchises employ close to 800,000 people in the U.S.
Netflix raises monthly subscription prices in U.S., Canada
The standard plan, which allows for two simultaneous streams, now costs $15.49 per month, up from $13.99, in the United States. [+10.7%]
Prices also rose in Canada, where the standard plan climbed to C$16.49 from C$14.99. [+10.0%] (…)
Netflix has added customers despite prior price increases, which shows its members have been willing to accept higher costs, Evercore ISI analyst Mark Mahaney said.
“This is evidence that Netflix has pricing power,” Mahaney said. (…)
At $15.49 per month, the standard U.S. plan from Netflix now costs more than competitors. HBO Max, owned by AT&T Inc (T.N), is currently offering an $11.99-a-month promotion for 12 months.
The price of Walt Disney Co’s (DIS.N) Disney+ is $7.99 a month or $79.99 a year. (…)
Brent Oil [$86] Trades Near Highest Since 2014 on Tightening Market
U.K. Households Unable to Afford Energy Bills to Triple in April
Meanwhile, per Bloomberg:
“There’s global competition, there’s non-bank competition, there’s direct private-lending competition, there’s Jane Street competition, there’s Citadel competition, there’s fintech competition, there’s PayPal competition,” CEO Jamie Dimon said. “We intend to win. And sometimes that means you got to spend a few bucks.”
At Citi, compensation expenses soared a whopping 33% in the fourth quarter compared with the prior three months, and 17% from the year earlier. That’s thanks to—you guessed it—the lender’s recent hiring spree as well as incentives and other bonuses.
U.S. Producer Price Index Posts Record Increase in 2021
The Producer Price Index for Final Demand increased 9.7% y/y with the index rising 0.2% in December following a 1.0% November gain. A 0.4% December rise had been expected by the Action Economics Forecast Survey. The PPI excluding food and energy rose 8.3% during all of last year and 0.5% in December after increasing 0.9% in November. Expectations had been for a 0.5% gain. The PPI less food, energy and trade services rose 6.9% y/y including a 0.4% December gain and a 0.8% November rise. These series date back to 2010.
Lower energy prices held back the increase in the December PPI dropping 3.3% as the Omicron variant emerged. Energy prices rose, however, by roughly one-third y/y. (…)
Food prices eased 0.6% (+12.9% y/y) following a 1.3% November increase. (…)
Final demand for goods prices less foods & energy rose 0.5% (9.4% y/y) after a 0.8% November rise. Finished consumer goods prices less good & energy rose 0.6% in December (6.4% y/y), the same as in November. Core nondurable consumer goods prices improved 0.6% (5.8% y/y) following a 0.7% rise. Durable consumer goods prices rose 0.6% last month (7.4% y/y) after moving 0.5% higher in November. Prices for private capital equipment strengthened 0.6% (5.9% y/y), the same as in November.
Services prices rose 0.5% in December (7.9% y/y) following a 0.9% rise. (…)
Construction product prices rose 0.3% (12.4% y/y) for the second consecutive month. Construction costs for private capital investment rose 0.4% (13.4% y/y) after improving 0,3% in November.
Intermediate goods prices jumped fell 0.3% (+24.4% y/y) due to a 4.1% decline (+34.1% y/y) in processed fuel costs.

U.S. Industrial Production Took a Breather in December
Industrial production declined 0.1% (+3.7% y/y) in December, following a rise of 0.7% (5.0% y/y) in November, revised from 0.5%. A 0.3% rise had been expected in the Action Economics Forecast Survey. Losses in manufacturing and utilities output were mostly offset by a gain of mining output.
For the fourth quarter as a whole, total industrial production rose at an annual rate of 4.0%, up from a rise of 3.5% in the third quarter. Total industrial production in December was 3.7% higher than it was at the end of 2020 and 0.6% above its pre-pandemic (February 2020) reading.
Manufacturing output declined 0.3% (+3.5% y/y) last month, following a rise of 0.6% (4.5% y/y) in November, revised from 0.7%. Durable goods production dropped 0.4% (+3.8% y/y) in December, after a 0.6% rise in November. Motor vehicle production dropped 1.3% (-5.9% y/y), following a November rise of 1.7%. Excluding the motor vehicle sector, factory output declined 0.2% (+4.3% y/y), after a rise of 0.5% in November.

Summers Says U.S. Risks Recession by Blaming Inflation on Corporate Greed “We need to recognize that we’ve got an overheated economy that we are going to need to cool off.”
(…) “We are basically moving towards higher entrenched inflation.” He cited increased expectations for the inflation rate, wage gains and labor shortages, along with “the pervasive pattern across many different prices.” (…)
Summers said, “If a sense develops that there’s a desire to politicize the Fed by focusing it towards other issues — beyond the crucial issues of financial stability — I think that could be problematic for the Fed’s credibility. (…)
China GDP Grew 8.1% in 2021, but Momentum Slowed in Quarter Underscoring concerns about China’s growth outlook, the central bank slashed two sets of interest rates, which will fuel expectations for an additional cut to benchmark lending rates.
(…) In the first half, GDP soared 12.7% from a year earlier, as the export-led recovery hit its stride and favorable comparisons to the darkest days of the initial Covid-19 outbreak flattered figures.
By contrast, in the second half of 2021, the economy began to feel the impact of measures imposed by regulators in Beijing to rein in some of the country’s most important engines of growth, chief among them the real estate and technology sectors.
The impact of those moves coincided with soaring commodity prices, power outages, snarled global supply chains, shortages of semiconductors and global rises in Covid-19 infections, including the Delta and Omicron variants. (…)
More difficult statistical comparisons to the stronger back half of 2020 also raised the bar. As a result, year-over-year GDP growth for the final two quarters of 2021 came in at just 4.9% and 4.0%, dragging down the full-year figure. (…)
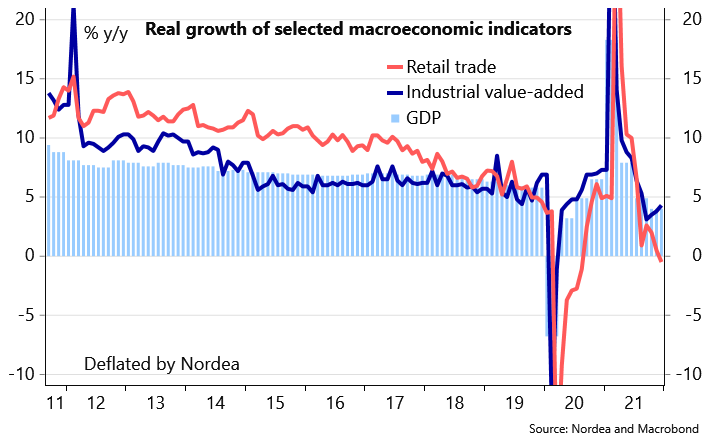
In December, China’s retail sales, a key gauge of domestic consumption, rose just 1.7% from a year earlier, lower than November’s 3.9% increase and the 3.6% growth expected by economists.
(…) industrial production, which rose 4.3% in December from a year earlier, China’s National Bureau of Statistics said Monday, better than the 3.6% growth expected by economists and up from November’s 3.8% year-over-year increase. (…)
Fixed-asset investment, which measures investment in the infrastructure, property and manufacturing sectors, increased 4.9% in 2021 from a year earlier, slowing from the 5.2% growth recorded for the January to November period.
The slowdown in overall investment was dragged down mainly by the real estate slump. Property investment rose just 4.4% for the full year of 2021, weakening from the 6% growth rate for the first 11 months of the year. By comparison, property investment rose 7% in 2020.
New construction starts by property developers, meanwhile, dropped 11.4% in 2021, as China’s property developers faced a cash crunch. (…)
- China Home Market Slump Deepens as Prices Fall for Fourth Month New home prices in 70 cities, excluding state-subsidized housing, slid 0.28% last month from November, when they dropped 0.33%, National Bureau of Statistics figures showed Saturday.
(…) Home loan demand stayed weak in December, with households’ mid- and long-term loans, a proxy for mortgages, increasing the least since February 2020. Year-end sales campaigns by developers added to downward pressure on prices. (…)
In first-tier cities, prices for resale homes rose 0.1% in December month-on-month from a 0.2% decline in the previous month, the National Bureau of Statistics said. New home prices were unchanged month-on-month in Beijing and rose 0.4% in Shanghai.
Anybody surprised by this?
Rolls-Royce, Bentley, BMW Sales Surge as Cheaper Brands Lag Behind A boom in luxury-car sales and the shifting of scarce semiconductors to the most profitable vehicles helped many auto makers achieve robust profits last year, even as sales of mainstream vehicles lagged behind and supply-chain disruptions crippled car production.
As I wrote last week:
The problem with the $2.5T in “excess cash” is illustrated by this next chart: 54% of the increase in deposits since Q1’20 rests in the accounts of the wealthiest 10% of households (red and pink bars). Another 42% went to the next 40% group (blue), averaging $25k per household. The bottom 50% (black) got only 4% of the increased deposits, an average of $2,000 per household, now largely eroded by inflation.

TECHNICALS WATCH
Giant Stock Swings Kick Off 2022 Hundreds of U.S.-listed companies are off more than 20% from highs. Many are in a bear market.
More than 220 U.S.-listed companies with market capitalizations above $10 billion are down at least 20% from their highs. (…) They include S&P 500 behemoths like Walt Disney Co. , Netflix Inc. NFLX 1.25% , Salesforce.com Inc. and Twitter Inc. TWTR -0.67%
Around 39% of the stocks in the [Nasdaq] index have at least halved from their highs, according to Jason Goepfert at Sundial Capital Research, while the index is roughly 7% off its peak. At no other point since at least 1999—around the dot-com bubble—have so many Nasdaq stocks fallen that far while the index was this close to its high, Mr. Goepfert said. (…)
Cathie Wood’s flagship fund, the ARK Innovation ETF, has lost 15% this year and is down around 50% from its 52-week high, or in a bear market. (…)
Buyers and sellers continue to fight for the upper hand a this NDR chart shows (via CMG Wealth):

My favorite technical analysis firm qualifies the market as unwell, unhealthy, and worries that the mega-cap stocks will eventually lose their pull and let the major indices join the smaller caps in a correction or bear market.
![]() A simple average of the price trends of the 10 largest S&P 500 stocks feeds this concern: Last 3 months: +2.72%, last 2 months: -0.30%, last month: -0.45%, last week: -2.07%.
A simple average of the price trends of the 10 largest S&P 500 stocks feeds this concern: Last 3 months: +2.72%, last 2 months: -0.30%, last month: -0.45%, last week: -2.07%.
The Russell 2000 is resting on its 10-month resistance level with rather weak moving averages:

But the large cap 13/34–Week EMA Trend is intact:

Interestingly, CMG Wealth’s 4 Fixed Income Trade Signals turned negative last week. There were 2 the week before and none two weeks ago.
- CMG Managed High Yield Bond Program: Sell Signal – Bearish High Yield Corporate Bond Trend
- Zweig Bond Model: Sell Signal – Bearish on High Grade Corporate and Long-Term Treasury Bonds
- 10-Year Treasury Weekly MACD: Sell Signal – Rising Rates: Bearish on Bonds
- Extended Duration Treasury ETF: Sell Signal – Rising Rates: Bearish on Bonds
EARNINGS WATCH
From Refinitiv/IBES:
Through Jan. 14, 26 companies in the S&P 500 Index have reported earnings for Q4 2021. Of these companies, 76.9% reported earnings above analyst expectations and 19.2% reported earnings below analyst expectations. In a typical quarter (since 1994), 66% of companies beat estimates and 20% miss estimates. Over the past four quarters, 84% of companies beat the estimates and 13% missed estimates.
In aggregate, companies are reporting earnings that are 8.3% above estimates, which compares to a long-term (since 1994) average surprise factor of 4.1% and the average surprise factor over the prior four quarters of 16.0%.
Of these companies, 92.3% reported revenue above analyst expectations and 7.7% reported revenue below analyst expectations. In a typical quarter (since 2002), 62% of companies beat estimates and 38% miss estimates. Over the past four quarters, 79% of companies beat the estimates and 21% missed estimates.
In aggregate, companies are reporting revenues that are 3.2% above estimates, which compares to a long-term (since 2002) average surprise factor of 1.2% and the average surprise factor over the prior four quarters of 4.0%.
The estimated earnings growth rate for the S&P 500 for 21Q4 is 23.1%. If the energy sector is excluded, the growth rate declines to 15.1%.
The estimated revenue growth rate for the S&P 500 for 21Q4 is 12.2%. If the energy sector is excluded, the growth rate declines to 8.8%.
The estimated earnings growth rate for the S&P 500 for 22Q1 is 7.5%. If the energy sector is excluded, the growth rate declines to 3.6%.
Trailing EPS are now $206.73 and forward EPS $223.57.

Analysts keep revising up:


Keep in mind that of the 26 companies having reported so far, 21 reported their November quarter. Several banks reported on Friday and Refinitiv gave them a 100% beat rate and +9.2% surprise factor. Investors saw something else as the Financials sub-index lost 1.0% and JPM 6.1% during the day.
- JPMorgan warns of missed target as costs jump and deals slow Shares of Wall Street lender drop despite record $48.3bn annual profit
BTW:
- “amidst still-rising inflation and an ultra-low unemployment rate, Jan Hatzius and his GS team increase the number of Fed funds rate hikes we now expect to see in 2022 to four from three – and also now forecast the Fed to begin shrinking its balance sheet in July (and maybe even earlier).”
- Dimon told analysts the central bank could hike rates as many as seven times to fight rising inflation, though he didn’t specify how quickly that might happen.
Morgan Stanley:
Do not underestimate the effects of liquidity withdrawal. The mammoth balance sheet the Fed has built up was a key determinant of liquidity across markets. As balance sheet runoff is put into motion, the withdrawal of liquidity will have profound impacts. Determining how it plays out is far from straightforward and will be determined by a variety of factors. Understanding the details matters. So hold on tight – there’s volatility ahead.
MS’ strategists expect the 10yr UST yield to reach 2.20% in 2Q and 2.30% in 4Q… the USD to strengthen into mid-year before pulling back into year-end… the S&P 500 to sell of 10-20% in 1H’22 (although 4400 year-end target is only ~6% downside from here)… modestly wider credit spreads to account for faster Fed balance sheet unwind, with MBS also widening more from here.
Round trip for many:

FYI:


