U.S. Durable Goods Orders Increase Moderately in March
Manufacturers’ new orders for durable goods increased 0.8% (10.2% y/y) during March following a 1.7% February decline, revised from -2.2%. A 1.0% increase had been expected in the Action Economics Forecast Survey. Excluding transportation, orders rose 1.1% (8.9% y/y) following a 0.5% February decline, revised from -0.6%. (…)
Motor vehicle & parts orders rose 5.0% (8.2% y/y) but defense aircraft orders dove 25.6% (-16.5% y/y).
Nondefense capital goods orders excluding aircraft rose 1.0% in March (10.2% y/y) after easing an unrevised 0.3% in February. (…)
Capex are booming in the U.S.. They reached $80B, 18% above all previous peaks of the last 20 years. They were up 1.0% MoM in March and 6.9% a.r. in Q1 after +15.1% in 2021.

CONSUMER WATCH
The consumer is key, in the USA, in Europe and in China. Not looking good, wherever one looks.
Friday we get March consumer spending for the U.S.:
Personal income is expected to rise 0.4 percent in March with personal consumption expenditures expected to rise 0.6 percent. Inflation readings are expected at monthly gains of 0.9 percent overall but only 0.3 percent for the core (versus 0.6 and 0.4 percent respective gains in February) for annual rates of 6.8 and 5.3 percent (versus February’s 6.4 and 5.4 percent).
So consensus real expenditures are seen down 0.3% MoM following -0.4% in February.
But check the ranges! How’s that for consensus!

Meanwhile, real data from the Chase card spending tracker, through April 18, show a sharp recent break down. This is nominal dollars.


Inflation Forces Budget-Squeezed Americans to Ask Family and Friends for Loans
Some 25.6 million people — more than 10% of all adults — relied on loans from those close to them to meet spending needs, according to the Census Bureau’s latest Household Pulse survey of finances, which covered the period from March 30 to April 11. That figure was up from 19.1 million a year earlier, when the question was first asked.
Millennials were the most likely to borrow from family and friends. Almost 40 million households are headed by a Millennial — almost as many as those led by Boomers — yet they hold just 6.4% of the total national wealth, while Boomers have more than half of it. What’s more, many Millennials entered the job market in the long downturn that followed the 2008 crash, and have struggled with mounting student debts.

- Biden Seriously Considering Student-Loan Forgiveness, Officials Say The president signaled to House Democrats this week that he is warming to taking executive action to erase at least some loan debt. Some Democrats believe a move would motivate young voters in midterms.
(…) Mr. Biden didn’t detail his plans, but responded positively when lawmakers pushed him to forgive $10,000 in student debt, the people said, suggesting they would be happy with his final decision. He also indicated he is open to further extending the current pause on student-loan payments, which is set to expire on Aug. 31.
The president told the lawmakers that he was weighing the timing of any announcement and wanted to make sure it didn’t contribute to inflation, one of the people said. (…)
Payments and interest accrual have been suspended for borrowers with federal student loans since March 13, 2020, at the start of the Covid-19 pandemic. (…)
About 40 million people owe around $1.6 trillion in federal student debt, which makes up around 90% of student debt outstanding. (…)
U.S. Consumer Confidence Slips in April
The Conference Board Consumer Confidence Index during April weakened 0.3% (-8.7% y/y) to 107.3 from 107.6, revised from 107.2. A reading of 107.5 had been expected in the Action Economics Forecast Survey.
The Present Situation Index fell 0.8% this month (+15.7% y/y) to 152.6 after rising 7.6% in March to 153.8. The Consumer Expectations index improved 0.7% in April (-28.5% y/y) to 77.2, following three straight months of sharp decline.
The jobs gap, representing the difference between respondents indicating that jobs are plentiful and those saying jobs are hard to get, slipped to a 44.6% from the record 47.1% in March. Calculated by Haver Analytics, this series has had a 69% correlation with the unemployment rate over the last ten years. The jobs plentiful measure fell this month to 55.2% from the record 56.7% in March. The jobs hard-to-get measure rose to 10.6% of respondents.
Current business conditions were perceived as good by an increased 20.8% of respondents in April. Expectations that business conditions would improve in six months fell to 18.1% of respondents, down from 42.5% in April 2020. More jobs were expected in six months by a lessened 17.4% of respondents, half the percentage twelve months ago. The percentage expecting rising income improved to 16.5% of respondents.
The expected inflation rate in twelve months slipped to 7.5% from 7.9% in March. It remained up from a 4.4% low in January of 2020. Roughly two-thirds of respondents expected that interest rates would rise over the next twelve months, the most in three years.
The share of respondents planning to buy a home within six months held fairly steady m/m at 5.9% and remained below a June 2020 high of 6.8%. Those planning to buy a major appliance rose sharply m/m to 49.8% of respondents, but remained below 53.9% registered in July 2021.


U.S. New Home Sales Fall for the Third Straight Month in March
New single-family home sales fell 8.6% m/m (-12.6% y/y) to 763,000 units at an annual rate in March after drops of 1.2% to 835,000 in February (initially 772,000) and 3.0% to 845,000 in January (previously 788,000), according to the U.S. Census Bureau. The March level was the lowest since November. The Action Economics Forecast Survey expected 774,000 sales in March. Supply continues its revival as the number of new homes for sale rose to 407,000 in March, the highest level since August 2008, from 392,000 in February.
By region, sales in March fell in all the major regions. Sales in the South slid 10.2% (-24.7% y/y) to 414,000 at an annual rate after a 1.1% decline to 461,000, registering the third consecutive monthly slide to the lowest level since October. Sales in the Midwest dropped 8.7% (-13.8% y/y) to 94,000, reversing a 9.6% gain to 103,000. Sales in the West fell 6.0% (+21.0% y/y) to 202,000, the third straight m/m fall to a five-month low, after a 14.3% decrease to 215,000. Sales in the Northeast declined 5.4% (+12.8% y/y) to 53,000 after having recovered 64.7% to 56,000.
The median price of a new home rebounded 3.6% (21.4% y/y) to a record high $436,700 in March following a 2.2% decline to $421,600 in February. The average sales price of a new home increased 3.1% (26.3% y/y), the third successive m/m rise to a record high $523,900. These sales price data are not seasonally adjusted.
The seasonally adjusted supply of new homes for sale rose to 6.4 months in March, the highest since October, from 5.6 in February. The record low was 3.5 months in August, September and October of 2020. The median number of months a new home stayed on the market edged up to 3.0 months in March from 2.9 in February. The record low was October’s 2.5 months These figures date back to January 1975.

The YoY comparisons are distorted by the pandemic. Still on their long-term trends but there are warning signs.
- As CalculatedRisk reveals,
This was only the second time in recorded history (since 1963) that sales NSA in March were below sales NSA in February for the same year. The first time was in 2020 – and was due to the pandemic impacting sales in March 2020. This decline might be revised away, but this also might be an indication of some slowing in new home sales.
- 6.4 months of supply exceeds the normal 4-6 months.
On the other hand, labor and material shortages may be problematic as CR explains:
The inventory of completed homes for sale – at 35 thousand (…) is about half the normal level of completed homes for sale. The inventory of homes under construction at 267 thousand is the highest since 2007. The inventory of homes not started is at a record 105 thousand. (…)
The inventory of new homes under construction is at 4.2 months (blue line) – well above the normal level [~3 months]. This elevated level of homes under construction is due to supply chain constraints.
And 105 thousand homes have not been started – about 1.7 months of supply (grey line) – almost double the normal level. Homebuilders are probably waiting to start some homes until they have a firmer grasp on prices.
Or they are having more difficulty selling them at prices 20-25% above last year and mortgage rates above 5% from 3% since mid-2020. John Burns’ Rick Palacios tweeted on April 12 that “Many builders shifted to speculative housing starts last 3-6 months, holding sales releases until stage of construction they’re comfortable with for cost visibility. Creates added risk if buyers aren’t lining up to purchase when the homes are released into 5% mortgage backdrop.”
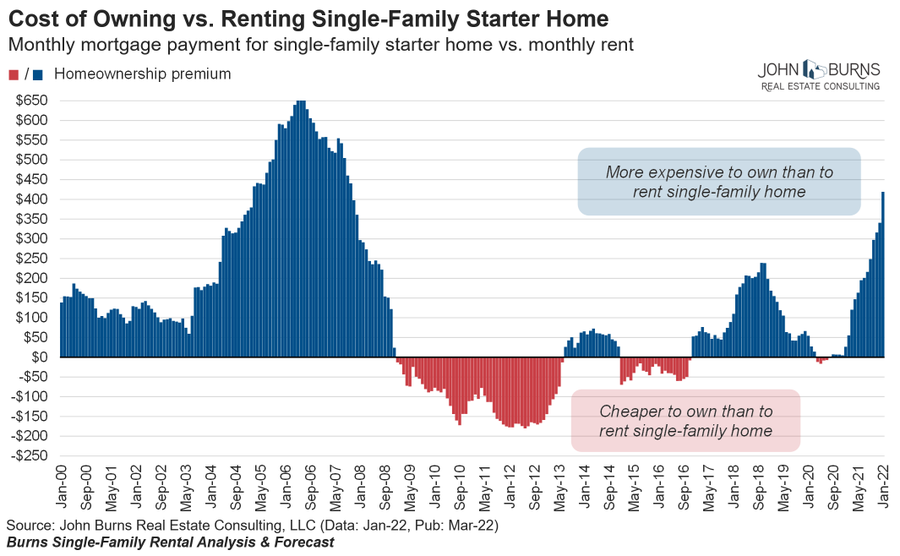
The jump in housing costs and the sharp and quick rise in mortgage rates have real consequences for most people. The own-vs-rent data has deteriorated much faster than in 2004-05. Spec builders may get a shock…
- Home-Price Growth Accelerated in February Average home prices in U.S. metropolitan areas rose 19.8% in the year that ended in February, the highest rate since August, according to a popular index.
(…) There are early signs that the market is cooling from its frenzied pace. About 13% of sellers dropped their list prices in the four weeks ended April 17, the highest share since the end of November, according to real-estate brokerage Redfin Corp. (…)
The median existing-home price rose 15% in March from a year earlier, NAR said, to $375,300, a record high in data going back to 1999. (…)
U.K. Retailers Had Poor April as Cost of Living Crisis Deepened Six in 10 said sales were lower than a year earlier, the highest proportion in 13 months, and more than 40% placed fewer orders with suppliers.
Consumer headwinds in China
Retail sales growth has been in long-term decline in China. Efforts to rebalance China’s economy towards a more consumer-oriented growth model have met with little success. A recent resurgence of cases of COVID-19 has helped to leave the consumer side of the economy looking particularly weak.
Retail sales returned to contractionary territory, falling by 3.5% on a twelve-month basis in March, after increasing 6.7% on a similar basis in the January-February period. Significant weakness was evident in catering services, which fell 16.4% amid the sharp spike in virus cases. Automobile sales were 7.5% lower than a year earlier.
With virus cases and lockdowns increasing in April, the near-term outlook looks bleak for households. Indeed, the urban unemployment rate has increased by 0.7 percentage points this year to 5.8% in March, and wage growth slowed sharply in 2022 Q1.
Amid a slowing economy, the Chinese authorities have been enacting measures to support growth, although there has been a lack of emphasis on boosting consumer spending. Without a meaningful shift to a more consumer-oriented economic model, trend growth will continue to slow and China will struggle to catch up with the US.
And housing looks pretty bad…plus reshoring, nearshoring and friendshoring…
- Xi Pushing to Beat U.S. in GDP Growth Despite Lockdowns Topping U.S. economy required to demonstrate superiority of China’s one-party system, Chinese leader tells officials
(…) In response to Mr. Xi’s call to rev up growth, Chinese government agencies are discussing plans to accelerate big construction projects, especially in the manufacturing, technology, energy and food sectors, as well as to issue coupons to individuals to spur consumer spending, the people said.
The U.S. economy outpaced China’s economy in the final quarter of 2021, growing 5.5% year-on-year compared with China’s 4.0%. President Biden claimed credit at the time by saying it was the first time in 20 years that the U.S. economy grew faster than the Chinese economy, which raised hackles among senior officials in Beijing. (…)
The authorities should “make sure the economic growth rate in the second quarter can return to more than 5%, which is particularly important for laying the foundation for the country to achieve the expected target of 5.5%,” Mr. Wang [a member of the monetary policy committee of China’s central bank] told attendees at an economic forum in Beijing this week. China’s GDP grew 4.8% in the first quarter, though many economists say that number likely overstates the strength of the country’s economy. (…)
Beijing is also reversing its policies in other sectors, such as real estate, to prop up the economy. Some local governments have in recent weeks eased their restrictions on home purchases, while China has also put off plans to expand a trial of a property tax, part of a push to restore confidence in the sector. (…)
The International Monetary Fund slashed its growth forecast for China’s economy this year, to 4.4% from 4.8% previously, citing growing pressures from Covid-19 lockdowns and Russia’s invasion of Ukraine.
That more modest expansion should still outpace growth in the U.S., according to the fund’s latest outlook for the global economy, published this month. The IMF expects the U.S. to post growth of 3.7%, compared with 4.0% previously. (…)
Like if the world, not to mention Powell and co., needed China in reflation mode!

HERE, THERE AND EVERYWHERE
Australia: Inflation breaches 5 percent You have to go back to 2Q 2001 to find a headline inflation rate in Australia that is higher than the latest 5.1%YoY figure. Core inflation is also up. The Reserve Bank of Australia (RBA) will not be able to ignore this
Headline and core rates of inflation

Source: CEIC, ING
SUPPORT NEEDED
S&P 500: to hold or not?

QQQ: to hold or not?

There has been plenty of volatility over the last two years. There always is. But this particular selloff looks more significant than those that preceded it. The last five days have seen the biggest percentage fall for the S&P 500, and very dramatically for the FANG index, in two years. This follows a brief return to the FANGs early in the Ukraine war as traders reverted to treating them almost as a modern equivalent of Treasury bonds, whose earning power meant that their cash flows were virtually guaranteed. This appears to be a major change in assumptions:
For more evidence that this is more than a correction, or the latest wobble, look to valuations. The FANGs have long commanded a huge premium over the S&P 500 in term of price to expected earnings. At the peak of the pandemic surge, buoyed by retail investors armed with “stimmy” checks, the FANGs traded at almost double the multiple of the S&P. That gap is now as narrow as it has been since the FANGs have been a thing. That in turn implies that assumptions they can keep minting money in perpetuity are at last coming into question:


EARNINGS WATCH
We have 134 companies in, an 81% beat rate and a +9.4% surprise factor. Consumer Discretionary, with only 14 companies in out of 45, show a 57% beat rate.
Trailing EPS are now $212.58. Full year 2022e: $228.34. 12m forward EPS: $234.73e.
Revisions are minimal for Q2 and actually up for Q3 and Q4!!!
- Deutsche Bank Joins UBS in Flagging Challenge of Soaring Pay “Payroll pressure” is a key reason why the bank’s cost outlook for the year has worsened, its CFO says.
Russia Halting Gas Flows to Poland, Bulgaria Over Payment Terms The move is the first time Moscow has followed through on a threat to cut off countries that don’t pay for their gas on new, wartime terms outlined in March by Russian President Vladimir Putin.
The move marks a major escalation by Russia, which has tried to bolster its currency by insisting customers pay for gas in rubles, and introduces the possibility that more economies in Europe, deeply dependent on Russian gas, could be targeted. Gas prices in Europe rose by more than 10% late Tuesday as traders weighed risks to already tight supplies. (…)
As in Poland, the issue appeared to be a new demand from Russia that European countries pay for their gas in rubles. (…)
The decision will have little effect on Poland, which was already set to become independent of Russian gas by the end of this year. It is a much bigger deal for Bulgaria, which gets more than 75% of its gas from Russia and has few immediate options to fully replace it.
The action sets a worrisome precedent for the broader Europe Union, which before the war in Ukraine sourced as much as 40% of its gas from Russia. That gas heats European homes and powers factories, especially in Germany and Austria, which source more than half of their supplies from Moscow. (…)
European countries such as Germany might need to resort to rationing and closing factories if Russian gas deliveries are cut off, other energy analysts have said. Germany would enter a sharp recession if Russian natural-gas deliveries are cut off, the country’s leading economic think tanks said in a report earlier in April. (…)
Earlier in April the German government temporarily took control of a local Gazprom unit in a bid to make sure gas would keep flowing. Europe’s biggest countries are betting that Russia won’t cut them off, because it isn’t easy to reroute huge quantities of natural gas and sell it in other markets. (…)
The cancellation of gas supplies appears to be an effort by Moscow to pressure Sofia into not sending military support to Ukraine, said Dimitar Abadjiev, who focused on Bulgarian energy security as ambassador to Saudi Arabia, a post he recently left. Bulgaria is a major producer of non-NATO standard weapons and ammunition sought by Kyiv and lawmakers there are due to vote on supplying Ukraine next week, he said. (…)
- Four European Gas Buyers Made Ruble Payments to Russia Ten European companies have already opened the accounts at Gazprombank needed to meet Russia’s payment demands, the person said.
- Russia Tried to Sell a Huge Slug of Oil. Nobody Wanted It. Russia’s crude exports hit a snag when Rosneft struggled to find buyers
(…) But exports hit a snag in recent days when Rosneft ROSN 2.86% Oil Co. struggled to find buyers for enough oil to fill a fleet of tankers, traders familiar with the sale said. The producer, in which the government owns a large minority stake, had invited companies to bid for the oil last week, according to traders and a document seen by The Wall Street Journal. (…)
But sanctions already in place, laid out by the EU in mid-March, and replicated by Switzerland, will ban companies from reselling Rosneft oil outside of Europe. This includes sales into the big Asian market, especially India, which has soaked up some of the Russian oil demand since Moscow invaded Ukraine. (…)
If Rosneft keeps struggling to sell, it would represent a further shock for an economy already locked out of much of Western finance and commerce. The company says it is Russia’s biggest taxpayer, contributing a fifth of budget revenue. In total, Russia’s oil and gas sales made up 45% of the federal budget in 2021, according to the International Energy Agency.
“If they can’t sell, they’ll have to start shutting down,” said Adi Imsirovic, senior research fellow at the Oxford Institute for Energy Studies and former head of oil trading. (…)
Rosneft’s tender was an attempt to export crude that trading companies were no longer willing to handle, people familiar with the sale said.
Unlike the U.S., Russia doesn’t have much space to store oil, so dwindling demand quickly backs up through the supply chain and prompts producers to throttle back output. Once wells are turned off, they can be hard to turn back on to their previous capacity. (…)
- Russia sees its oil output falling by up to 17% in 2022 Russia may see its oil production fall by as much as 17% in 2022, an economy ministry’s document seen by Reuters showed on Wednesday, as the country struggles with Western sanctions.
The scale of the production decline would be the most significant since the 1990s when the oil industry suffered from underinvestment.
Russian oil output started to decline in March and had fallen by around 7.5% by mid-April. (…)
According to the document, Russian oil output may decline to between 433.8 million and 475.3 million tonnes (between 8.68 million and 9.5 million barrels per day) in 2022 from 524 million tonnes in 2021.
That would be the lowest since 2003, when Russian oil output stood at 421 million tonnes. (…)
Oil exports are seen declining to between 213.3 million and 228.3 million tonnes (4.27 million to 4.57 million bpd) from 231 million tonnes in 2021.


")
")

 We’ve looked at this survey many times over the years, concluding that the managers can be a slight contrary indicator at extremes, but it’s not a decisive edge. While some of the market’s better long-term returns came after depressed sentiment, the S&P 500 performed better when managers were bullish and worse when they were bearish. (…)