![]() Sinking feeling, oh
Sinking feeling, oh
And I feel it comin’ on
Sinking feeling, oh
And I feel it, feel it ![]()
(Wavves)
As much as I would want, it seems impossible to find much positive news and data these days, other than employment stats seemingly defying gravity.
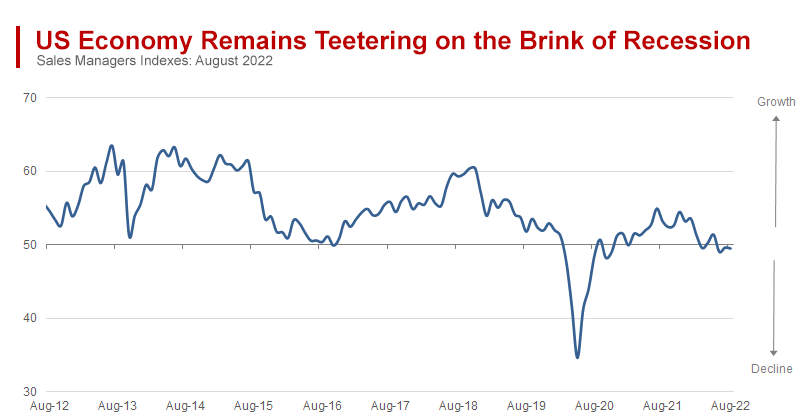
Yesterday’s flash PMIs, both manufacturing and services, were really bad as this MacroMarkets (via the Daily Shot) chart shows:
")
The last non-pandemic time the composite PMI was this low was in 2008. Importantly, the services sector is particularly weak as S&P Global commented:
- The rate of contraction outpaced anything recorded outside of the initial pandemic outbreak since the series began nearly 13-years ago.
- The reduction in output was broad-based, with manufacturers and service providers registering lower activity. Service sector firms recorded the steeper rate of decline, as activity fell sharply.
- August data signalled a renewed contraction in overall sales as manufacturers and service providers struggled with subdued demand conditions.
- New services orders contracted at the steepest pace for over two years.
- Employment rose at the slowest pace in 2022 to date.
- Service sector firms recorded a slower rise in employment during August. The level of outstanding business decreased at the quickest rate since May 2020, with reduced pressure on capacity resulting in the softest expansion in service sector workforce numbers in 2022 so far.
- Services firms noted that wage pressures, transportation surcharges and greater supplier costs had pushed up business expenses.
Princeton Energy Advisors:
We are left under the impression that the US will experience two recessions in short order
- The first of these represented the roll-off of fiscal stimulus in H1 2022, leading to a technical recession with two consecutive quarters of decline in GDP but no corresponding rise in unemployment.
- This was a fiscal contraction of a magnitude rarely seen in US history, with February to October 1947 being perhaps the most relevant precedent. At that time, US government spending collapsed as WWII ended, leading to a decline in GDP but no rise in unemployment and a quick recovery
- The second recession will be of the more traditional sort, resulting from interest rate hikes intended to quell unacceptably high inflation.
Signs of rapidly waning demand seem to pop up from everywhere:
- Retailers are unanimous on weak consumer demand and excess inventories.
- Sales managers are downbeat, generally signaling continued weak demand.
- The inflation squeeze on consumers may be abating somewhat but prices of essentials remain very challenging.
- Recent declines in gasoline prices are not stimulating demand. Princeton Energy Advisors notes that, last week, “total refined product supplied (demand) has hit a new low for this year, now 13% below the level of early Q1 and gasoline demand also fell sharply again, now 10% below the level at the start of the year. This occurred despite pump prices having fallen for more than two months, suggesting structural problems in the economy.”
- Bloomberg yesterday informed us that “roughly 20 million U.S. households (17% of the total) are late on their utility bills, double the pre-pandemic level and the highest number of homes in arrears since the National Energy Assistance Directors Association has tracked the data in 1983.” BB added that “regulation of energy rates makes it hard for providers to immediately pass on higher fuel costs, so the recent hikes may be just the start.”
- Almost Daily Grant’s notes that “KeyBanc analyst Adam Josephson detailed last week, old, corrugated cardboard (OCC) box prices have entered a tailspin of late, sinking an estimated 30% across August and September on a sequential basis. A variety of overseas markets are seeing similar, or even larger, declines. That stark move reflects no minor change in activity, as OCC prices represent a decent proxy for global commerce (every shipped good, of course, needs a box). Noting that galloping consumer prices have forced real disposable personal income into the red while revolving consumer loans such as credit card debt have exploded higher by some 15% year-over-year, Josephson sums it up: “Americans are borrowing heavily in order to keep spending.”
Goldman Sachs also noted the sharp jump in consumer borrowing lately but assures us that “rapid household growth is not a problem for now”. Here’s the logic:
Household debt grew extremely rapidly in 2022H1, as consumer credit balances grew at their fastest pace since 2008. (…) most of the growth was driven by a sharp increase in revolving consumer credit balances—i.e., credit card and home equity lines of credit (HELOCs)—that grew 17% (annualized) in 2022H1 and show little sign of slowing according to recent bank balance sheet reports. (…)
Households have been withdrawing home equity at the fastest pace since 2008, with withdrawals effectively boosting household income by 1.5-2% each quarter since mid-2021. Consistent with this pattern, banks reported significant increases in loan demand in the Fed’s most recent senior loan officer survey (SLOOS), especially for credit cards and HELOCs.
Revolving credit growth provided an almost 7% (annualized) boost to real spending growth—which only grew by 2%—in 2022H1, so spending would have likely grown much more slowly if households had not been able to borrow. If household debt levels were to fully normalize and households could no longer borrow at such a fast pace, spending would likely decline.
This extremely firm credit growth and increased demand for consumer loans is potentially concerning because it is happening at the same time that households are feeling increased financial pressure. (…)
At least for now, however, a closer look shows that household debt is not currently creating much stress on households. Debt servicing costs and household leverage remain well below historically normal levels, and loan delinquency rates are extremely low and actually dropped further in 2022Q2. The only potential indication of stress is that the delinquency rate for subprime auto loans—which are the most exposed to lower quality borrowers—has risen recently, though it remains below its pre-pandemic level.
I have 2 problems with Goldman’s analysis:
- It is a static portrait of a highly dynamic process, particularly given that the Fed is rapidly jacking interest rates up specifically to kill demand. Higher debt bearing rapidly rising costs will eventually choke borrowers. If that happens when labor markets soften, another Fed goal, the process becomes even more dynamic…
- It fails to account for the damage inflation is doing to consumers’ ability to service their rising indebtedness. Goldman’s argument that the debt servicing burden (blue line) remains well below recent highs disregards the fact that inflation has meaningfully eroded borrowers’ capacity to service that debt once the inflated costs of essentials have been met. Debt service payments as a percent of real disposable income (red line) reached 11.4% in Q1 and will likely be close to its 2008 high in Q2. Given that real disposable income is actually falling (-8.3% YoY in the first half), GS may need to revisit its stance sooner than what its “at least for now” caveat entails.

As rates rise and the economy slows, it will be interesting to see how the “Buy Now Pay Later” business performs. Per David Rosenberg on July 5:
BNPL is just another type of debt, but the catch is that the entire industry is largely unregulated, so the amounts that consumers owe do not end up on the radar of credit-scoring watchdogs. (…)
According to TransUnion, the service is primarily used by individuals that fall in the Gen-Z cohort (ages 10 to 26), have a subprime credit history, and have already maxed out their credit cards. Therefore, clearly the issue is that these companies are encouraging the younger generation (that is already saddled with debt — currently, $1.75 trillion in student debt is outstanding) to overextend themselves. And down the line these spending habits can become unsustainable and lead to missing payments. (…)
On aggregate, BNPL balances are roughly one-eighth the size of credit cards ($125 versus $1,100, respectively). However, their delinquency rates are about three times higher than credit cards at 30 days past due and two times higher at 90 days past due. (…)
Furthermore, there is an element of compounding risk down the line as BNPL companies securitize the loans and sell them to investors. Given the high delinquency rates of BNPL loans (which will surely tick higher during an economic downturn), their effects can trickle down to the household and financial institution balance sheets… doesn’t that sound familiar?
ADG again:
On Monday [Aug.22], a team of analysts at Jefferies highlighted that 30-plus-day delinquencies across a dozen pass-through trusts securitized by online consumer lender Upstart Holdings, Inc. (UPST on the Nasdaq) lurched higher to 5.44% in August on a weighted-average basis. That’s up 63 basis points from July and compares to a sub-3% delinquency rate as recently as last fall. Thanks to that spike in slow payers, a pair of Upstart’s 15 trusts have now breached their trigger for early amortization, up from one last month, while the Kroll Bond Rating Agency projects that six further trusts will trip their own early amortization thresholds by the end of the year. Upstart shares are off 93% from their October 2021 highs.
As Ernest Hemingway said, “it happens gradually, then suddenly.”
On a much bigger scale, from BlackRock:
In this new world shaped by supply, trade-offs for policymakers become starker – at a time when their maneuvering room has shrunk. Global debt has surged to new highs as governments sought to limit the fallout from pandemic.
This means that small rises in interest rates can have an outsized and painful impact, as the chart shows.
The private sector debt is also susceptible to higher rates, especially via housing. All this makes it tougher for central banks to hike rates -and ultimately more tempting to live with inflation.


Companies Pulled Back on Orders for Big-Ticket Items in July Commerce Department’s report on durable goods adds to signs manufacturing demand is cooling
New orders for durable goods—products meant to last at least three years—were unchanged at a seasonally adjusted $273.5 billion in July compared with the prior month, the Commerce Department said Wednesday. Excluding defense, new orders were up 1.2%. (…)
A closely watched proxy for business investment—new orders for nondefense capital goods excluding aircraft—rose 0.4% to $74.5 billion in July compared with the previous month, the Commerce Department said Wednesday. (…)
Axios writes that
These are only the latest numbers that suggest businesses aren’t exhibiting the usual behaviors they do at the onset of a recession.
The new durable goods numbers indicate there has been no pullback in capital spending over the summer — another behavior you expect to see when CEOs get nervous about the outlook.
Actions speak louder than words in terms of how the economy evolves. And while confidence among executives may be soft right now, as evidenced in a range of surveys, their actions point toward continued growth.
![]() The Commerce Department does not publish capex in real terms. Here’s my rendering of it, deflating nominal capex data with PPI-Capital Goods. Year-to-date, real capex have declined 2.8% or 4.8% annualized. Inflation can hide bad trends…
The Commerce Department does not publish capex in real terms. Here’s my rendering of it, deflating nominal capex data with PPI-Capital Goods. Year-to-date, real capex have declined 2.8% or 4.8% annualized. Inflation can hide bad trends…

Here’s the MoM trends:

U.S. Pending Home Sales Down for the Eighth Time in Nine Months in July
The Pending Home Sales Index fell 1.0% m/m (-19.9% y/y) to 89.8 in July after an 8.9% drop in June (-8.6% initially) and a 0.4% increase in May, according to the National Association of Realtors (NAR). The July m/m fall was the eighth in nine months to the lowest index level since April 2020’s 71.6. Pending home sales have fallen 26.6% since the October 2021 peak.
Pending home sales decreased in most of the country in July, except the West where they rebounded 2.2% (-30.1% y/y) following a 16.2% June slump. The July m/m gain in the West was the first since January’s 1.4% increase. Sales in the Midwest slid 2.7% (-13.4% y/y) in July on top of a 3.8% decline in June. Sales in the South fell 1.1% (-20.0% y/y) after a 9.3% June drop. The Midwest and South regions experienced the sales declines for the eighth time in nine months to their lowest levels since April 2020. Sales in the Northeast dropped 1.9% (-15.4% y/y) following a 6.8% June decrease and a sizable 15.4% May gain.

- 5 straight months of 5%+ mortgage rates taking its toll on housing. pic.twitter.com/c1vpovnqB1 — Rick Palacios Jr. (@RickPalaciosJr)
Laid-Off Workers Are Quickly Finding Jobs People losing their jobs are rapidly landing interviews, multiple offers and higher pay, a dynamic of the tight labor market that is holding down unemployment totals.
Petco Cuts Outlook as Customers Buy Fewer Pets The lowered view comes as sales slowed further following a boom from millions more homes with pets.
Americans Are Starting to Skip Therapy to Save Money
Biden Cancels Up to $20,000 in Student Debt for Millions The president’s executive order will provide unprecedented relief for tens of millions of Americans but is certain to draw legal challenges and political pushback.
China Adds 1 Trillion Yuan More of Stimulus to Rescue Growth
China stepped up its economic stimulus with a further 1 trillion yuan ($146 billion) of funding largely focused on infrastructure spending, support that likely won’t go far enough to counter the damage from repeated Covid lockdowns and a property market slump.
The State Council, China’s Cabinet, outlined a 19-point policy package on Wednesday, including another 300 billion yuan that state policy banks can invest in infrastructure projects, on top of 300 billion yuan already announced at the end of June. Local governments will be allocated 500 billion yuan of special bonds from previously unused quotas. (…)
Economists were relatively downbeat on the measures, while financial markets were muted. (…)
“We’re getting easing, but it’s not quickly enough to keep up with the pace of deterioration in the broader economy,” said Andrew Tilton, chief economist for Asia Pacific at Goldman Sachs, in an interview on Bloomberg TV. “More domestic policy easing and improved growth and domestic demand is going to be key as we get into 2023.” (…)
Who Will Be Hit the Hardest by Cuts to Arizona’s Water Supply? Arizona farms are first in line to bear the brunt of the biggest restrictions put in place on the use of the Colorado River’s water after officials declared an unprecedented shortage last week.
The Southwest is locked in its worst drought in 1,200 years, according to a University of California, Los Angeles-led study earlier this year.
Lake Mead reached its lowest water level since the 1930s in July, and low levels are projected to continue into 2023, prompting officials at the Bureau of Reclamation to drastically reduce Arizona’s consumption of the river’s water. Last year, the river’s already low levels resulted in Arizona getting 512,000 acre-feet less water in 2022. Even drier conditions this year led to a cut of 592,000 acre-feet in 2023, or 21% of its annually allocated Colorado River water. Nevada and Mexico are also subject to the restrictions, reducing their supply by 8% and 7%, respectively. California, the river’s largest user, isn’t subject to the restrictions. (…)
Agricultural operations in central and southern Arizona, however, rank among the lowest priority for deliveries from the Colorado River and will be among the first whose supply gets cut. (…)
The next lowest priority are so-called NIA regions, which include certain cities, industries and tribes not part of higher priority delivery groups. That covers a portion of Phoenix’s water, plus some private water providers, mines and power companies. About 97% of this water will be cut, up from 63% this year, according to Arizona State University. (…)
From Mauldin Economics:
The latest data shows about two-thirds of the US is in some level of drought. This is quite a change in just a few years; as recently as 2019, less than 10% of the country was in that position. Worse, some 20% of US territory is in “Exceptional” or “Extreme” drought.
Whatever the causes, this is a problem. It affects vast sectors of the economy like agriculture and contributes to inflation by making food more expensive. Wildfires—and the expensive measures we take to fight and prevent them—divert resources from better uses. Lack of mountain snowmelt means less hydropower generated by dams in the West.
We worry a lot about scarce energy, microchips, and labor. But water is a much more basic need, and we feel its absence quickly.

Similarly in Europe:
Visualizing the Rhine River’s Shrinking Water Levels
Water levels on the Rhine river in Germany continue to sink amid severe drought, forcing companies to seek alternatives for the freight they send up and down Europe’s second-largest river.
Around 195 million tons of cargo are shipped on German rivers each year—mostly on the Rhine.
Flowing from the Swiss Alps to the North Sea, the Rhine links German and Swiss industries with the Dutch city of Rotterdam, Europe’s biggest port. Its role in the continent’s economy traces back to the Roman Empire and early medieval trade.
The Rhine river is an important shipping route for many products like coal, gasoline, heating oil, chemicals, car parts, food, and thousands of other goods. However, when water levels drop, cargo vessels need to sail with a reduced load, so they don’t run aground. (…)
Due to an unusually hot and dry summer in Europe, the low water levels are emerging earlier than usual, with the lowest water levels typically recorded in September or October. Water levels at the chokepoint of Kaub, near Frankfurt, fell to 32 cm in depth on Monday, August 15, 2022.
The low water levels are adding to Europe’s energy crisis, sparked by the Russian invasion of Ukraine. Barge rates to ship fuel from Rotterdam to Basel, Switzerland, are near an all-time high. The closure of the Rhine could disrupt 400,000 barrels a day of oil-product trade.

An extreme summer has taken a toll on Asia’s longest river, which flows about 3,900 miles (6,300 kilometers) through China and feeds farms that provide much of the country’s food and massive hydroelectric stations, including the Three Gorges Dam — the world’s biggest power plant. (…) Now, the level is at the lowest for this time of year since records began in 1865, exposing swathes of sand, rock and oozing brown mud that reeks of rotting fish. (…)
Yangtze’s retreating water levels have snarled electricity generation at many key hydropower plants, sparking energy chaos across parts of the country. Mega cities including Shanghai are turning off lights, escalators and cutting back on air conditioning. Tesla Inc. has warned of disruptions in the supply chain for its Shanghai plant, and others such as Toyota Motor Corp. and Contemporary Amperex Technology Co., the world’s top maker of batteries for electric vehicles, have shuttered factories.
With climate change likely to deliver more frequent and persistent heat waves and droughts, the current outages raise longer-term questions about China’s reliance on hydropower, the country’s largest source of clean energy that accounted for about 18% power generation in 2020, according to BloombergNEF. (…)
The southwestern province of Sichuan, enduring the region’s worst drought since the 1960s, is by far the hardest hit given its high dependence on hydropower. While dam generation plunged by half in the region, a grueling heatwave has sent electricity demand surging by about a quarter. That’s added pressure on an energy network that serves a population about the size of Germany and supplies to industrial hubs that are home to factories of suppliers to Tesla. (…)
Sichuan’s power shortage shows that hydropower, usually seen as the most stable renewable source, is still not as reliable as coal, according to Hanyang Wei, an analyst with BloombergNEF. That raises doubt about how smoothly China can shift away from its reliance on fossil fuels, given that wind and solar are even less stable, said Wei.
Following last year’s crisis, which triggered widespread electricity curbs to factories throughout the country, China started to plan more coal power. Under heavy government pressure, coal mines have boosted output by 11% this year. (…)
Sufficient coal stockpiles have kept the crisis from spreading to other parts of China, but it’s been of little help to Sichuan, where hydropower makes up more than three-quarters of generating capacity.
China’s biggest power crunch since last fall has led to suspension of power supply to many industrial customers through Aug. 25. Companies including Toyota and CATL have already closed plants in the region for several days. Top polysilicon maker Tongwei Co. said its plant has been affected, further tightening the market for the material key to building solar panels. (…)
The current situation is expected to be less painful than last year as the strictest measures have largely been limited to Sichuan, which comprises just 5% of the country’s GDP. Still, it could pose a risk to the sputtering $18 trillion economy. (…)

Source: National Bureau of Statistics China, ING
- China Rolls Out Aid to Help Power Firms and Save Rice Harvest A drought amid record heat wave compounds the economic challenges from Beijing’s Covid strategy and the country’s property slump.
- Receding Water Levels in Texas Reveal 113-Million-Year-Old Dinosaur Footprints A severe drought caused the Paluxy River to recede, delighting visitors who could see a trail of Acrocanthosaurus footprints in the riverbed.

With that sinking feeling, we must keep in mind there are 2 important elections this fall, in the USA and in China. Sinking feelings…