Note: I am travelling (ancient word: “go from one place to another, typically over a distance of some length”) in Europe until August 23rd. Postings will thus be sporadic, limited and time-zones impacted.
Not my usual posting with limited equipment and time…
What happened last week?
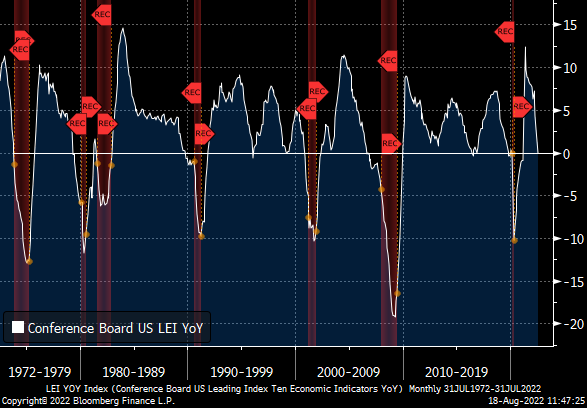
U.S. Index of Leading Indicators Fell Again in July
The Conference Board’s Composite Leading Economic Indicators Index fell 0.4% m/m (unchanged y/y) in July following an upwardly revised 0.7% m/m decline in June (initially -0.8%). Over the past six months the index has fallen 1.6%, pointing to rising near-term recession risks. This index has been a very accurate leading indicator of recessions over the past 60 years. With the Federal Reserve on an aggressive monetary tightening course and the economy already emitting signs of stress, today’s leading indicators report is clearly flashing amber.
Six of the Leading index’s ten components made positive contributions in July while four subtracted. The largest positive contributor was the still positively-slope yield curve, though it has been flattening recently and so its positive contribution has been falling. The largest subtracter was the continued decline in the expectations component of consumer sentiment.
The Index of Coincident Economic Indicators rose 0.3% m/m (2.1% y/y) in July following a downwardly revised 0.1% monthly gain in June (initially 0.2%). All four of the index’s components made positive contributions to the July increase.
The Index of Lagging Economic Indicators increased 0.4% m/m (5.8% y/y) in July after a downwardly revised 0.7% m/m increase in June (initially 0.8%). Three of the index’s seven components made positive contributions, two were unchanged and two subtracted in July.
The ratio of the Coincident index to the Lagging index is also seen as a leading indicator of recession. The ratio slipped 0.1% m/m (-3.6% y/y) in July, its seventh monthly decline in the past eight months, another indication of rising recession risks.
From Advisor Perspectives:


U.S. Philly Fed General Activity Index Back to Positive Reading in August
The index of new orders rose 20 points though remained negative at -5.1, up from -24.8 in July.
The employment index rose nearly 5 points to 24.1 in the current month from 19.4 in July. Twenty eight percent of respondents reported increases in employment this month, up from 24% in July, while a smaller 3.8% share of respondents reported lower employment from 4.3% in July. The average workweek was little changed at 6.1 versus 6.4 in July.

Recal that in the NY Fed survey, the new orders index dropped to -29.6 in August, the lowest reading since May 2020, from 6.2 in July and 14.8 in last August.
The number of employees index decreased to 7.4 in August, the lowest level since April, from 18.0 in July and 12.8 last August. (…) The average workweek slid to -13.1 in August, the lowest reading since May 2020, from 4.3 in July and 8.9 last August.
U.S. Retail Sales Hold Steady in July; Nonauto Sales Rise
In the retail control group, which excludes autos, gas stations, building materials & food services, sales increased 0.8% (8.7% y/y) in July after a 0.7% June rise and a 0.8% May increase. These sales are used in the construction of personal consumption expenditures in NIPA accounts.
David Rosenberg:
Sales were down save for a +1.5% spurt in something labeled as “miscellaneous.” The headline dipped 0.1% outside of that segment and home improvement — the first such decline since December of last year.
We’re talking about Walmart here. The world’s largest retailer, according to the pundits, came in with stellar results. But not so fast. Sales may have been up +8.4% year-over-year, but that’s all due to inflation. Meanwhile, operating income contracted 6.8% from a year ago, and the company warned that this trend is soon going to decline by double-digits. Keep in mind that over half of Walmart sales are in food, where inflation is running north of 13%. So no — the numbers were not good at all, and the +5% rally in the stock price on the news smacks of a “head fake.”
Despite EPS surprising by nearly 10% based on the latest estimates, the consensus brought down their forecast by 15% from its peak (to $1.63 per share compared to $1.93 back in February). So, based on the more optimistic forecasts at the beginning of the year, the $1.77 EPS Walmart reported would have actually represented an 8% miss.
In real terms, retail sales were basically flat in July, after two months of decline averaging about -0.6% apiece. Down or flat in four of the past five months. And, after a flat Q2, real retail sales so far in the third quarter (with one month in the books) is running at a -2% annual rate. In fact, what really sticks out here is that the level of real or inflated-adjusted retail sales is lower today than it was in March 2021 (down -2% since that time!).
My estimates of real sales remain negative:

U.S. Existing Home Sales Continue to Fall in July

LOW CEO CONFIDENCE
The Conference Board’s index of CEO confidence has eroded from 82 in 2021Q2 to 67 in 2021Q3 to 65 in 2021Q4 to 57 in 2022Q1 to 42 in 2022Q2 and now to 34 as of 2022Q3. We haven’t seen a number this low since the depths of the Great Recession in 2009Q1. Before that, try 2000Q4, 1990Q4, and 1980Q2. All recessionary episodes. Will it really be different this time?
The six-month economic outlook index has also sagged from 65 in last year’s fourth quarter to 58 in Q1, 39 in Q2, and 31 in Q3. This is the lowest since 1980Q2. In other words, lower now than it was at the weakest points of the past five recessions!
37% have now shelved plans to hire over the next 12 months and 13% intend to cut. That compares to 30%, and 7%, respectively in Q2. Similarly, 73% say they are either freezing or cutting their capex budgets for the coming 12 months, up from 62% in Q2, 52% in Q1 and 43% in 2021Q4.
Business Executive Confidence
United States: Conference Board’s CEO Business Confidence Survey
(index; >50 denotes positive)

(Rosenberg Research)
(…) Half of respondents said they’re reducing headcount or plan to, and 52% have implemented hiring freezes. More than four in ten are rescinding job offers, and a similar amount are reducing or eliminating the sign-on bonuses that had become common to attract talent in a tight job market.
At the same time, though, about two-thirds of firms are boosting pay or expanding mental-health benefits. The most common move: making remote work permanent for more people.
The findings illustrate the contradictory nature of today’s labor market, where skilled workers can still largely name their terms amid talent shortages even as companies look to let people go elsewhere, particularly in hard-hit industries like technology and real estate. (…)
“Firms are playing offense and defense with their talent strategies,” said Bhushan Sethi, joint global leader of PwC’s people and organization practice, noting that employers have to weigh reputational damage and employee morale when planning layoffs. “People have long memories, and social media plays a much bigger role now.” (…)

“On the whole, this generation of corporate leaders have minimal experience navigating a recession.” — Kathryn Kaminsky at PwC
EARNINGS WATCH
Through Aug. 19, 474 companies in the S&P 500 Index have reported earnings for Q2 2022. Of these companies, 77.8% reported earnings above analyst expectations and 17.9% reported earnings below analyst expectations. In a typical quarter (since 1994), 66% of companies beat estimates and 20% miss estimates. Over the past four quarters, 81% of companies beat the estimates and 16% missed estimates.
In aggregate, companies are reporting earnings that are 6.0% above estimates, which compares to a long-term (since 1994) average surprise factor of 4.1% and the average surprise factor over the prior four quarters of 9.5%.
The estimated earnings growth rate for the S&P 500 for 22Q2 is 8.8%. If the energy sector is excluded, the growth rate declines to -1.8%.
The estimated earnings growth rate for the S&P 500 for 22Q3 is 5.5%. If the energy sector is excluded, the growth rate declines to -1.1%.
Estimates are coming down, slowly, much like CEOs and CFOs seem shy of committing guidance. Only 80 provided guidance so far this quarter vs 93 at the same time after Q1.

Rosenberg:
(…) while YoY earnings trends are still positive, this has entirely been driven by the Energy sector. Relative to year-ago levels, Q2 operating earnings are up 1.2%, due to a 340.7% surge in Energy. Outside of this one sector, which is just a 4% weight in the S&P 500, earnings growth is running at -10.5%. For reference, this compares to -2.8% YoY in Q1 and +30.2% in Q4 of last year — an unmistakable pattern of erosion.
Admittedly, part of this slowdown can be attributed to tougher comps (coming out of the pandemic), but it primarily speaks to a deterioration in the economic backdrop — one that has at least partially been obscured by the strength in Energy.
“Bear markets have three stages — sharp down, reflexive rebound, and a drawn-out fundamental downtrend.”
In technical analysis jargon, bear markets demonstrate an “A-B-C” pattern. Always expect a bear market to post an initial deep slide, but then to see a positive (sometimes explosive) short-term reversal that can see much of that early decline retraced in the reflexive rally; but the real damage takes place in the long and drawn-out decline to the fundamental lows. We saw this in the late 1960s, the early 1980s, the early 2000s, and again in the 2008-09 downturn. This is why they were bear markets. They had this same three-act play in common. And it is why 1987 and 2020 were not bear markets but were steep corrections only. We will know the next bear market when the S&P 500 exhibits this pattern.
Historically, the average leg down in the “triple waterfall” is -24% to the “real” lows that only happened deep into the recession and Fed easing cycle when the yield curve reverts to a positive slope (+140 basis points on average for the 2s/10s curve).
S&P 500 Large Cap Index – 13/34–Week EMA Trend Chart

South Korea: Early August exports contract on weak semiconductors
Korea’s workday-adjusted exports in the first 20 days of August fell 6.4% from a month ago, down from a 7.5% gain in the previous month. (…) On a year-on-year basis, export growth slowed materially to 3.7% from 14.5% in the previous month.
Weakness was apparent in semiconductor exports, which dropped 11.0% mom sa and recorded the first year-on-year decline since July 2020. Handsets also fell 5.1% mom sa.
By major destination, exports during the first 20 days of August fell most sharply for those headed to the US, by 6.7% mom sa. Exports to Europe fell marginally (-0.2%), whereas exports to Japan rose 3.1%, at a similar pace with the previous month. Recovery in exports to China slowed to 1.0% from 3.4% in July, still 9.1% below pre-lockdown March levels. Exports to all other destinations (mostly EM) contracted 3.5%, weighed down by exports to Vietnam (-7.8%), where Korean companies have large-scale operations. (Goldman Sachs)
CHINA
China’s COVID-19 cases just surged to a three-month high on a huge outbreak in Hainan province (3,424 infections across China yesterday, up from 2,888 on Tuesday). And then tack on the fact that China’s housing crisis is worsening, as are property sector default risks.


