MANUFACTURING PMIs
USA: Manufacturing decline eases amid renewed rise inoutput in March
The seasonally adjusted S&P Global US Manufacturing Purchasing Managers’ Index™ (PMI™) posted 49.2 in March, up from 47.3 in February and broadly in line with the earlier released ‘flash’ estimate of 49.3. The index reading rose for the third month running to signal the slowest deterioration in operating conditions at US manufacturers in the current five-month sequence of decline.
Goods producers registered a renewed, albeit only fractional, rise in production during March. The increase ended a four month sequence of contraction, but was subdued in the context of the series history. The upturn in output was linked to the timely delivery of inputs which allowed firms to work through incomplete orders.
Despite an increase in output, client demand remained muted, as new orders fell further at the end of the first quarter. Panel members indicated that new sales decreased due to higher interest rates and inflationary pressures, which continued to exert strain on customer purchasing power. Nonetheless, the rate of contraction softened notably to only a marginal pace.
Weak foreign client demand and global economic uncertainty were reportedly key drivers behind a tenth successive monthly decline in new export orders. The pace of decrease quickened to the fastest since last November. (…)
Purchasing activity fell again in March, and some suppliers reportedly adjusted their prices to reflect weaker demand for inputs. Average cost burdens rose at the slowest rate since July 2020, with the rate of inflation softening for the second month running. Although still strong, the pace of increase was weaker than the long-run series average.
Manufacturers recorded a slower rise in average selling prices in March. Though solid, the rate of increase in output charges was the weakest since October 2020. Companies stated that efforts to drive sales led to price discounting at some firms.
Meanwhile, manufacturers continued to fill long-held vacancies, with employment rising at a modest pace. Although easing from February, the rate of job creation was the second-fastest seen since last September. (…)

The U.S. ISM:
“The March Manufacturing PMI® registered 46.3 percent, 1.4 percentage points lower than the 47.7 percent recorded in February. (…) The New Orders Index remained in contraction territory at 44.3 percent, 2.7 percentage points lower than the figure of 47 percent recorded in February. (…) The New Export Orders Index reading of 47.6 percent is 2.3 percentage points lower than February’s figure of 49.9 percent. The Backlog of Orders Index registered 43.9 percent, 1.2 percentage points lower than the February reading of 45.1 percent.
The Employment Index continued in contraction territory, registering 46.9 percent, down 2.2 percentage points from February’s reading of 49.1 percent. (…)
Seventy percent of manufacturing gross domestic product (GDP) is contracting, down from 82 percent in February. However, more industries contracted strongly; the proportion of manufacturing GDP with a composite PMI calculation at or below 45 percent — a good barometer of overall manufacturing sluggishness — was 25 percent in March, compared to 10 percent in February, 26 percent in January and 35 percent in December 2022,” says Fiore.
- “Orders and production are fairly flat month over month. Lead times have stabilized in most areas, so looking at reducing commitments on new orders, except for a few strategic electronic buys with lead times that are still too long.” [Computer & Electronic Products]
- “Sales a bit down, and budgets being cut with a greater emphasis on savings.” [Chemical Products]
- “Business is doing generally well, with input costs falling in some areas and rising in others.” [Food, Beverage & Tobacco Products]
- “Sales are slowing at an increasing rate, which is allowing us to burn through back orders at a faster-than-expected pace.” [Transportation Equipment]
- “Lead times are still improving, but prices continue to face inflationary pressures. Prices of steel and steel products are going up some. Hydraulic components are still facing extended lead times. We are increasing inventory levels of imports due to global uncertainty from the ongoing war in Ukraine and threats from China.” [Machinery]
- “Overall, (our) first quarter is going better than planned, with sales increases of about 7 percent versus a budget of 4.5 percent. However, sales volume is pulling down our automotive original equipment manufacturer (OEM) side, which is the majority of our business. We believe the second quarter will be hard but are holding to our outlook.” [Fabricated Metal Products]
- “Business is still slow overall. Customers have not yet picked up orders at pre-pandemic levels.” [Apparel, Leather & Allied Products]
- “Overall, things feel more stable in the first quarter 2023 than they did throughout 2021-22. Customer demand is — as expected — growing well, and the overall supply environment is far better than the previous two years. This is not to say there are not challenges; there absolutely are. However, there are fewer issues cropping up each week, and supply challenges are generally more like the ‘typical’ issues we experienced before the pandemic. We are closely monitoring the global banking situation, but no impacts have been experienced or are expected at this time. Ongoing tensions between the U.S. and China are another issue to watch.” [Miscellaneous Manufacturing]
- “New orders are starting to soften and supplier deliveries are improving slightly. This is allowing us to reduce (our) backlog and build a buffer in some categories. The supply chain disruption — particularly in electronics — is still significant compared to pre-pandemic conditions.” [Electrical Equipment, Appliances & Components]
- “Overall, business continues to remain strong. We are still experiencing supply chain issues on several indirect supplies.” [Primary Metals]
New Orders New Export Orders


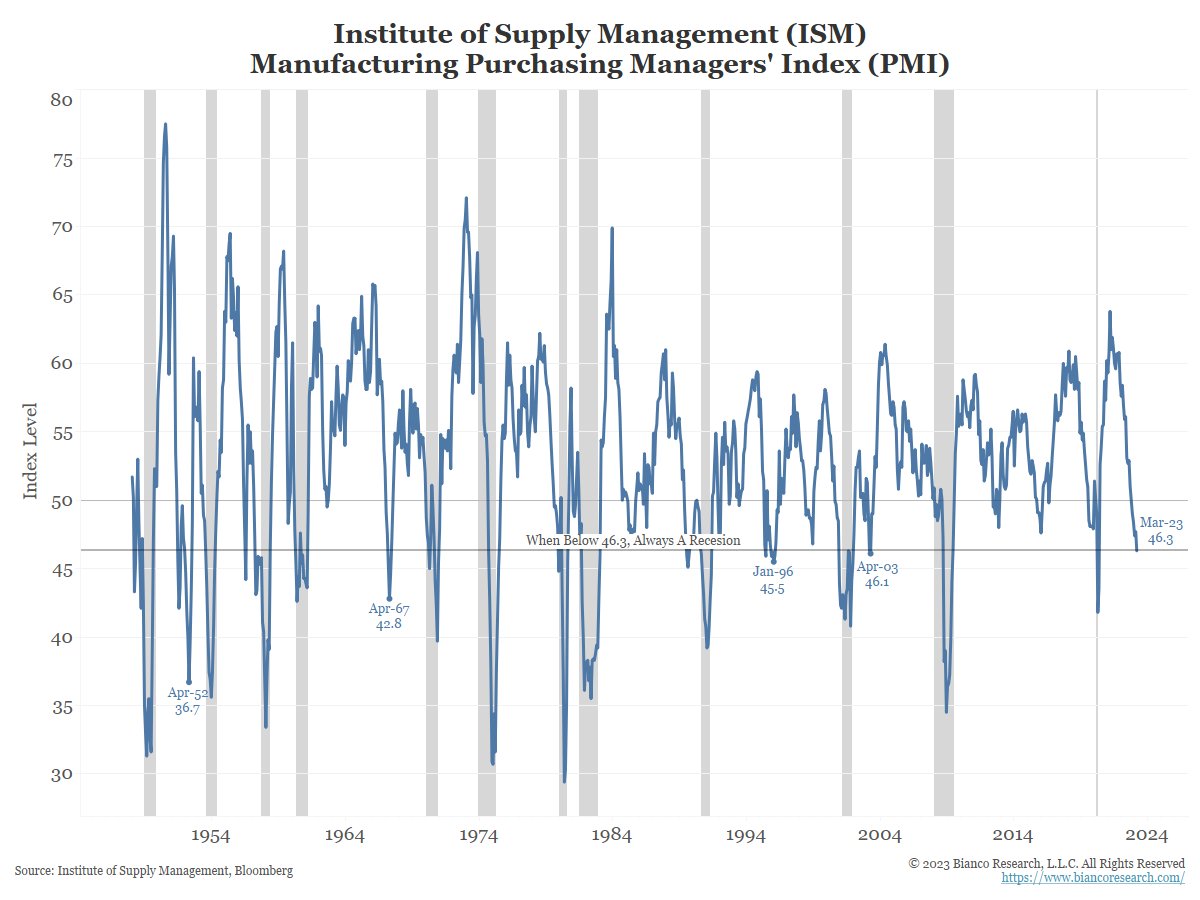
- ISM started surveying in 1948. As this chart shows, this is the 16th time the ISM has been 46.3 or lower. 12 (75%) of these instances, the economy was either in recession or about to enter a recession. The other four were: April 2003 January 1996 April 1967 April 1952 So, not a bad recession indicator, correct 3 out of 4 times. (@biancoresearch)
The Goods economy is clearly in recession, and getting worse per falling new orders.
Can Services continue to prevent a full fledge recession? Services PMIs are out tomorrow but recall that the Flash Services PMI for March was at 53.8 vs 50.6 in February.
New orders at service providers increased for the first time since last September, as greater client activity sparked a modest upturn in new sales. The expansion in new business was the fastest since May 2022 with domestic and foreign client demand both improving.
CANADA: PMI slips back into contraction territory during March
After accounting for seasonal factors, the S&P Global Canada Manufacturing Purchasing Managers’ Index® (PMI®) registered 48.6, down noticeably from 52.4 in February. It was the lowest reading recorded by the index since June 2020 and represented a modest deterioration in operating conditions.
There were concurrent falls in both output and new orders during March, the first contractions of the year so far. The rate of decline in production was modest, with firms signalling the fall was closely linked to the steepest contraction of new orders since last October. (…)
These factors were common for both domestic and external clients: new export orders fell in March for a tenth successive month and to the sharpest degree since December.
Manufacturers also continued to report steeply rising prices. Input costs rose at a strong overall pace, with a wide range of goods and inputs again up in price since the previous month. However, the rate of inflation maintained the gentle downward trend evident since the turn of the year, dropping to its lowest since July 2020 and remaining below the long-run survey average. (…)
Slower overall input price inflation fed through to a similarly weaker gain in output charges, with manufacturers increasing their own prices to the slowest degree since October 2020. There were some reports that promotional discounts were required to entice buyers given a competitive marketplace and worsening sales in March.
Softer demand also discouraged buying activity amongst Canadian manufacturers, who signalled a preference for utilising existing stocks at their plants. (…)

Manufacturing production across the euro area grew marginally during March, but nonetheless signalled the strongest monthly performance in factory output since May last year. Eurozone factory order books continued to shrink at the end of the first quarter, but a survey-record shortening in suppliers’ delivery times boosted the supply of critical raw materials and components, thereby supporting greater production levels. Additionally, reflecting the receding supply constraints, eurozone manufacturers recorded a decline in average input prices during March for the first time since the early stages of the COVID-19 pandemic in 2020.
The S&P Global Eurozone Manufacturing PMI® posted 47.3 in March, down from 48.5 in February to a four-month low. While indicative of a sharper deterioration in the health of the euro area manufacturing sector, much of the month-on-month decline was due to the Suppliers’ Delivery Times Index (which is inverted in the calculation of the headline PMI) surging to a survey-record. The key sub-components of the headline indicator measuring factory health such as output, new orders and employment were little-changed on the whole. (…)
The volume of incoming new work fell for an eleventh month running, with the rate of decline solid and broadly unchanged since February. New export orders also fell again in March, although the contraction was the softest since mid-2022. (…)
Improved availability of items, in tandem with falling input demand, reportedly led vendors to reduce their prices charged. This, alongside reports of lower energy costs, led to the first decrease in average manufacturing input prices for almost three years during March. Factory gate charges continued to rise, but the rate of output price inflation eased to a 26-month low and was only marginally stronger than its historical average.


CHINA: Manufacturing production growth slows in March
After output and new orders had risen solidly in February, Chinese manufacturers registered softer gains at the end of the first quarter of 2023. While the sustained upturn in demand supported a further increase in purchasing activity, inventories continued to fall as firms maintained a cautious approach to stock building. Employment also fell slightly compared to February.
The headline seasonally adjusted Purchasing Managers’ Index™ (PMI™) posted at the neutral level of 50.0 in March. This was down from an eight-month high of 51.6 in February to signal stable business conditions at the end of the first quarter. (…)
Total new orders likewise increased at a softer pace that was only slight. While a number of firms mentioned customer demand and numbers had improved amid the recent easing of pandemic measures, others experienced relatively sluggish sales, particularly from overseas. Notably, new export business fell back into decline in March, though the rate of contraction was mild overall. (…)
Input costs were unchanged in March, thereby ending a five-month sequence of inflation. According to panel members, lower costs for some materials, often due to greater supply, had helped to offset increases in other expenses.
Average selling prices meanwhile fell fractionally, as a number of companies indicated that efforts to remain competitive had limited overall pricing power. (…)


Softer contraction in Japan’s manufacturing sector
Overall business conditions among Japanese manufacturers deteriorated for the fifth consecutive month in March amid sustained reductions in both output and new orders. That said, both segments saw the softest contractions since last October. Firms commonly associated the declines to weak demand in both domestic and international markets, however manufacturers often noted that production lines were maintained by creating inventory and stocking finished items.
As a result, holdings of post-production stocks rose at their steepest pace since February 2009. (…)
The headline au Jibun Bank Japan Manufacturing Purchasing Managers’ Index™ (PMI) rose from 47.7 in February to 49.2 in March to signal a softer deterioration in the overall health of the Japanese manufacturing sector. (…)
Reflective of trends in production levels was a sustained contraction in order books. While solid, the decline was the slowest since last October however amid cooling demand in both domestic and international markets. As such, foreign demand for Japanese manufactured goods reduced for the thirteenth month in a row. (…
On a prices front, cost pressures eased further in the latest survey period, but remained historically elevated. Input cost inflation was robust but dipped to the lowest since August 2021. Higher prices for raw materials, labour and transport along with sustained weakness in the yen were cited as the key factors contributing to the latest increase in average cost burdens.
Meanwhile, charged prices inflation accelerated for the second successive month as firms partially passed higher cost burdens to clients. As such, the rate of selling price inflation was the steepest since December.

JPMorgan’s Dimon says US banking crisis not over, sees long repercussions
(…) “The current crisis is not yet over, and even when it is behind us, there will be repercussions from it for years to come,” Dimon wrote in a 43-page annual message covering a range of topics from JPMorgan’s performance to geopolitics and regulation. (…)
“The market’s odds of a recession have increased,” Dimon wrote. “And while this is nothing like 2008, it is not clear when this current crisis will end. It has provoked lots of jitters in the market and will clearly cause some tightening of financial conditions as banks and other lenders become more conservative.” (…)
While the 2008 crash hit large banks, mortgage lenders and insurers with global interconnections, “this current banking crisis involves far fewer financial players and fewer issues that need to be resolved,” Dimon said. (…)
Dimon also wrote that the U.S. economy is healthy, and will remain so for decades to come.
Consumers are spending 23% more than they were pre-COVID, and are sitting on $1.2 trillion of “excess cash” in their checking accounts. Other positives he cites include:
- “Extremely low” unemployment.
- Rising wages, “particularly at the low end.”
- “10 years of home and stock price appreciation.”
- “Businesses are pretty healthy and credit losses are extremely low”
Also: “China, using subsidies and its economic muscle to dominate batteries, rare earths, semiconductors or EVs, could eventually imperil national security by disrupting our access to these products and materials. We cannot cede these important resources and capabilities to another country.”
Vehicles Sales at 14.82 million SAAR in March; Up 9.3% YoY Wards Auto estimates sales of 14.82 million SAAR in March 2023, essentially unchanged from the February sales rate, and up 9.3% from March 2022.

HOUSING
From Black Knight:
- It currently requires 33.2% of the national median household income to afford the median-priced home, roughly equivalent to the peak of the market in 2006,and well above the long run average of ~25%
- That puts home prices ~25% above what underlying incomes would typically support at today’s interest rates
- For example, it would take a 10% drop in prices, a return to 5.25% interest rates on a 30-year mortgage, a 5% income growth for affordability to return
to long-run averages

So, demand is down big time. But so is supply:

- In perhaps the most noteworthy February trend, home prices rose in 78% of the nation’s top markets, a significant change from only 4% of markets in November
- 39 of the 50 largest markets saw home prices rise on a seasonally adjusted basis in February

In Canada, where fixed rate mortgages run for only 5 years, the sharp increase in mortgage rates does not appear to be a big problems for banks. From NBF’s recent banking conference:
Banks quantified that borrowers renewing were seeing their monthly payments increase by $200-600. Management teams clarified that refinancing (i.e., borrowers seeking to extend amortization in order to reduce payments) activity was at normal levels.
- At CIBC, average payments on variable mortgages have increased by ~$500 per month on average. Currently, 80% of variable mortgage customers facing renewal are paying the higher monthly payment without adjustments.
- RY has seen customers pay down their balance at renewal to moderate mortgage payments.
- TD is not seeing a material increase of customers renewing and seeking to extend amortization periods in order to moderate payments.
Apartment-Building Sales Drop 74%, the Most in 14 Years Interest-rate increases and banking upheaval push down demand for multifamily buildings
(…) The recent drop in building sales follows a stretch of record-setting transactions that peaked in late 2021, when the multifamily sector was a top performer in commercial real estate. Cash-rich investors had a strong appetite for apartment buildings. Their top choices were in Sunbelt cities such as Dallas, Phoenix and Tampa, Fla., where rental housing is largely unregulated and rents were rising 20% or more annually until last year.
Sales have plummeted because the math for buying an apartment building makes a lot less sense now. The cost to finance building purchases has jumped alongside the fast rise in interest rates. Rents are running flat, or are even declining in some major metro areas, after record increases. A upheaval in banking is also making it more difficult to buy buildings, investors and analysts said, as more lending institutions pull back or lend only at high rates.
As a result, most apartment-building values are falling, and many landlords won’t sell at today’s lower prices. (…)
Prices of multifamily buildings dropped 8.7% in February compared with the same month a year earlier, according to the MSCI Real Assets pricing index. A separate measure by Green Street, which tracks publicly traded landlords, found an even sharper drop, with building values down 20% from their late 2021 highs. (…)
Nationally, apartment rents in March were up 2.6% compared with a year earlier, according to Apartment List. But the pace of annual rent growth continues to fall, and is well below the pandemic high of nearly 18% set in 2021, Apartment List said. (…)

- Housing Is Turning Out to Be a Lousy Shelter for Investors Apartments have been the second-worst performing type of real estate in the U.S. after offices over the past year.
Rising interest rates are taking the air out of bubbly property valuations. Apartment prices are down 21% over the past year, according to the Green Street Commercial Property Price Index. This makes them the second-worst performing category of real estate after offices, which have lost 25%. Institutional investors tend to own fewer individual family homes, where values have been more resilient so far. (…)
Buyers paid too much on the basis that they would be able to push rents even higher. Instead, rent growth is expected to cool to 4% in 2023, according to Newmark forecasts, only slightly higher than the 3% long-term average. (…)
Ironically, underlying demand for apartments still looks OK—although there is a lot of newly built supply on the way. The national vacancy rate is 4.6%, which is slightly below long-term norms. A strong jobs market means people are continuing to make the rent, and high mortgage costs mean many tenants will be stuck renting for longer as homeownership becomes less affordable. (…)
China’s Housing Market Has the Space but Not Enough Buyers Around a third of all newly completed apartments in the country went unsold in 2022.
China’s property market appears to have stabilized after a two-year downturn. But one problem continues to hold back its recovery: a major oversupply of unsold apartments.
China had 3.5 billion square feet of finished but unsold apartments in February, according to Wind, a data provider. That is equivalent to around 4 million homes, according to some estimates. It is also the worst oversupply in China since 2017, when it was in the midst of a “slum clearance” program meant to boost demand for new housing by tearing down old, dilapidated buildings.
Around a third of all newly completed apartments in 2022 were unsold, the highest percentage since 2015, calculations by property consulting firm China Real Estate Information Corp. show.
The overhang is most acute in smaller cities with populations of a few million people or less, economists say. After a long building boom, the more than 640 cities labeled as “third tier” in China now have nearly 80% of China’s total housing stock, according to a paper published last year by economists Kenneth Rogoff and Yuanchen Yang. Demand in those cities is weaker than in bigger markets such as Beijing and Shanghai, where populations and job markets have grown faster.
It would take nearly six years for one well-known third-tier city, Beihai, to absorb its stock of unsold homes, compared with seven months in Shanghai and nearly two years for Beijing, according to China Real Estate Information estimates.
On average it would take 20 months to absorb the excess housing supply in the 50 cities that China Real Estate Information monitors, the firm said. The U.S. currently has a 2.9-month supply of existing homes, according to the National Association of Realtors, and an 8.2-month supply of new homes, according to U.S. government data.
In February, new-home prices in “top-tier cities”—Beijing, Shanghai, Shenzhen and Guangzhou—rose 1.7% from a year earlier. Prices in third-tier cities dropped by 3.3%, though the pace of decline has slowed from previous months, according to data from China’s statistical bureau.
Overall, new-home prices across 70 major cities rose 0.3% from the previous month, after declining month-over-month since August 2021.
If China fails to stabilize home prices in its lower-tier cities, which are home to about two-thirds of China’s urban population according to one estimate, it will likely damp household confidence and consumers’ willingness to spend in many parts of the country, limiting the extent of China’s overall economic recovery this year.
In the longer run, the need to absorb the market’s excess housing could mean a prolonged period of depressed new-home construction, depriving China of one of its biggest growth drivers and job creators. New-home construction is also critical for China’s heavily indebted local governments, which rely on income from land sales to developers to balance their budgets.
The need for real-estate construction in third-tier cities will need to shrink by roughly 30% between now and 2035 to avoid further oversupply, Mr. Rogoff and Ms. Yang concluded in their paper in September. (…)
Between 2010 and 2020, demand for residential properties in urban China averaged 18 million units a year, according to Goldman Sachs. As China’s population ages and demand for replacement properties wanes, that number will drop to 6 million units a year by 2050, its estimates show. In 2022, China’s urban population grew at the slowest pace in 42 years. (…)
TECHNICALS WATCH
- The 100-day moving average crossed above the 200-dma and the 200-dma has hooked up:

- 13-34w EMA:


 Source:


