The enemy of knowledge is not ignorance, it’s the illusion of knowledge (Stephen Hawking)

It ain’t what you don’t know that gets you into trouble. It’s what you know for sure that just ain’t so (Mark Twain)

Invest with smart knowledge and objective odds

THE DAILY EDGE: 31 MAY 2023

Home Prices Rose in March for Second Straight Month Case-Shiller index climbs 0.4% as shortage of homes for sale spurs competition among home buyers

On a year-over-year basis, the index rose 0.7% in March, down from a 2.1% annual rate in the prior month. The annual increase was the smallest since May 2012. (…)

The median existing-home price fell 1.7% in April from a year earlier to $388,800, according to the National Association of Realtors.

The Case-Shiller 10-city index fell 0.8% over the year ended in March, following a 0.5% increase in February. The 20-city index dropped 1.1%, after an annual gain of 0.4% in February. For both indexes, it was the first annual decline since May 2012. (…)

(CalculatedRisk)

  • Consumers saw labor-market conditions cooling more markedly in May as waning demand for workers helps right the supply-demand imbalance – Bloomberg
Image

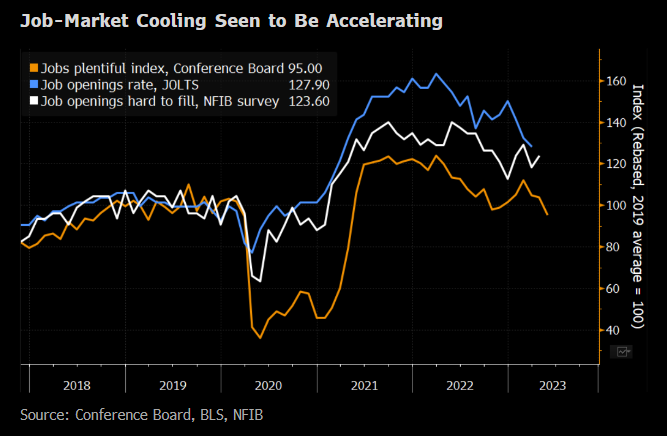
The “Job Plentiful” index is back to its 2019 level. But there’s nothing wrong with that:

image

Restart of Student Loan Payments Included in Debt-Ceiling Deal Monthly bills will resume 60 days after June 30

(…) McCarthy said Sunday that forbearance is costing the government about $5 billion a month. The average monthly bill before the pandemic was $393 per borrower, and more than 40 million Americans currently have student loan debt.

The debt-ceiling deal doesn’t address Biden’s one-time forgiveness program, which would wipe out up to $20,000 in federal loans per borrower and is currently being weighed by the Supreme Court. That decision is likely to come before the end of June. Biden had said that monthly payments would restart 60 days after the ruling was issued, or no later than the end of August.

Jefferies has said the return of monthly loan payments presents risks similar to the effects of the 2013 fiscal cliff, when tax increases led to reduced consumer spending. And in a note released Monday, JPMorgan’s chief US economist Michael Feroli said that the end of the payment moratorium will reduce annual disposable personal income by $38 billion, which will reduce consumer spending.

That would be about 2% of DPI.

  • There’s no “compelling reason” to pause rate hikes, Cleveland Fed chief Loretta Mester said, according to the FT. Rates will head higher in the short run on inflation, Lawrence Summers said.
  • There’s a slew of Fed speakers today. We have Collins and Bowman at 8:50 a.m., then Collins speaks again at 12:20 p.m. followed by Harker at 12:30 p.m., and Jefferson at 1:30 p.m. At 2 p.m. the Fed releases the Beige Book.
  • US interest rates could push higher in the short-run, and taxes rise in the long run, says former Treasury Secretary Lawrence Summers, who sees risks from inflation and government debt. In a speech Tuesday at the Peterson Institute, he said the US seemed stuck with underlying inflation around double that of the Fed’s target, meaning the central bank may have to raise rates further. “My guess is that Fed funds are going to have to get to a point 50 basis points or more ahead of where they are,” he said, adding the US would be “likely to require substantial increases in revenue.”

The 2-year Ts rate suggests a pause:

fredgraph - 2023-05-31T073841.575
China Tensions Rattle American Manufacturers Makers of watercraft and ventilators reconsider Chinese supply chains, balancing potential risks against the lower costs.

Executives are plotting alternate supply chains or devising products that can be made elsewhere should China’s hundreds of thousands of factories become inaccessible. That prospect became more conceivable, they said, after the 2022 invasion of Ukraine prompted companies to sever ties with Russia, sometimes taking huge write-downs.

U.S. companies were further rattled after Chinese authorities recently questioned workers at Boston-based consulting firm Bain & Co. and raided the Beijing offices of Mintz Group, a due-diligence firm based in New York. The government has also barred major Chinese firms from buying products made by U.S. semiconductor company Micron Technology, citing national-security risks. (…)

China’s access to raw materials and ability to produce components for finished goods remains unmatched, and its dense supplier networks have yet to be replicated elsewhere.

China accounts for 31% of global manufacturing, according to the United Nations Industrial Development Organization, nearly twice the 17% share of the U.S. It is also an important market for many U.S. companies. (…

Harris sees other bad omens, such as a court system that he said has become increasingly unfriendly to U.S. companies. Some businesses are plotting a departure, he said, but are finding no easy equivalent to their setups in China. Vietnam, for example, has become so popular that manufacturing space is now hard to find, he said. (…)

U.S. manufacturing production stalled after the GFC but employment has picked up a little though still 5.5% below pre-GFC numbers. Manufacturing unit labor costs, stable for 20 years, jumped by 25% between 2014 an 2019 and another 13.4% since.

image

According to China’s NBS, manufacturing wages jumped 52% between 2014 and 2019 and another 25% since.

A recent study by the Reshoring Institute concluded “that China can no longer be considered a low-cost country, as its labor rates have significantly increased.”

With labor rates in China doubling over the past few years, companies are now considering moving back to America or to alternate low-cost countries. The research study shows that wages in China are now nearly comparable with those in some European countries leaving the lowest-cost manufacturing to India, Mexico and Vietnam.

            Salaries: production          Salaries: managers/supervisors


Source: The Reshoring Institute

But there are other issues:

In many world locations there simply aren’t enough workers to fill the jobs at mega-assembly operations. In the United States and Western European countries, worker shortages to fill existing positions have become a major problem, while in countries such as India, China, and Mexico labor is relatively plentiful.

Productivity rates are also important to compare. If a worker in China is paid $300 per month and one in Vietnam is paid $200 per month, it seems reasonable to consider moving to Vietnam until you compare productivity rates. Chinese workers with more experience and often better skills may work faster and with a low error rate as compared with Vietnamese workers. When all of these comparisons are taken into consideration, the decision to move may not be so attractive. (…)

Despite significantly higher labor rates in the United States, manufacturers are coming back to America. To be competitive in world markets and at home, U.S. manufacturers must automate production, reengineer processes to extract labor costs, and make manufacturing more efficient.

When comparing manufacturing in America versus other countries, you must consider the total cost of ownership and include all costs such as logistics, quality, proximity to markets, import duties and penalties, inventory carrying costs, and geopolitical risks. Clients at the Reshoring Institute are often surprised to find that when all costs are considered, American manufacturing can be very competitive.

China’s Recovery Slows Further as Factory, Services Activity Pulls Back An official reading of manufacturing activity slipped deeper into contraction in May

An official gauge of the country’s manufacturing activity slipped unexpectedly to 48.8 in May, falling deeper into contractionary territory even as the broader economy has been unshackled from three years of strict zero-Covid restrictions.

The purchasing managers index remained below the 50 line that separates expansion from contraction for a second straight month, falling short of April’s 49.2 result and the 49.7 forecast by economists surveyed by The Wall Street Journal. (…)

The official gauge of nonmanufacturing purchasing managers index, which covers both service and construction sectors, remained in expansion territory, but pulled back to 54.5 in May from 56.4 the previous month, China’s National Bureau of Statistics said Wednesday. (…)

Subindexes of the manufacturing PMI tracking new orders and new export orders contracted further in May compared with a month earlier. (…)

While the services sector has been leading the recovery this year, the subindex tracking services activity declined to 53.8 in May from 55.1 in April, China’s statistics bureau said. The construction subindex also fell to 58.2 in May from 63.9 in April. (…)

Image

Americans are flying

The Transportation Security Administration reported that it screened nearly 9.8 million airport travelers during the four-day Memorial Day weekend, up about 300,000 from the same weekend in 2019. On Friday, TSA screened 2.74 million people, the highest for a single day since before the pandemic. (Axios)

Data: TSA; Chart: Axios Visuals

We Asked Workers Why They’re Not Coming Back to the Office Terrible commutes. Expensive child care. Employees explain why they will keep working from home.

(…) A battle of wills could be ahead. The gap between what employees and bosses want remains wide, with bosses expecting in-person collaboration and workers loath to forgo flexibility, according to monthly surveys of worker sentiment maintained by Nicholas Bloom, a Stanford University economist who studies remote work.

One reason workers say they’re reluctant to return is money. Some who have lost remote-work privileges said they are spending hundreds, or in some cases thousands, of dollars each month on meals, commutes and child care. (…)

image

(Bloomberg)

BBB Advised

Tremors in investment grade: the triple-B-rated portion of the Bloomberg U.S. Corporate Bond Index sports a 53-basis point yield premium to single-A’s as of this afternoon, up from 45-basis points in March and representing the largest such pickup in six months.

That gradual creep wider comes as some $11.4 billion worth of formerly high-grade issuers were downgraded to junk by Barclays’ count in the first quarter. The investment bank predicts the full-year tally of so-called fallen angels will reach as much as $80 billion, a figure exceeded on only three occasions (2009, 2016 and 2020) over the past two decades. (Almost Daily Grant)

U.S. Mood Remains Glum; 18% Satisfied With State of Nation

The 18% of Americans who are satisfied with the state of the nation today is about half of the 35% historical average. Gallup has measured national satisfaction since 1979. The lowest reading was 7% in October 2008 during the height of the financial crisis. The high point was 71% in February 1999 during the dot-com boom and after the Senate acquitted President Bill Clinton in his impeachment trial.

image

Americans’ confidence in the U.S. economy also remains depressed, with Gallup’s Economic Confidence Index essentially unchanged at -43 in May after dropping in April. However, like the national satisfaction measure, it is not as low as last summer, when it fell to -58 in June 2022, the lowest Gallup had recorded since the Great Recession.

image

And yet, Americans want more stock in their companies:

Some 61% of U.S. adults are invested in the stock market, an April poll from Gallup found. That’s the highest share since 2008, up from 58% last year and 52% as recently as 2016.

A paucity of income-generating opportunities during the post-crisis E-Z money epoch (witness the sub-1% average interest rates on offer for five-year certificates of deposit from 2012 to 2017 and 2020 to mid-2022, per data from Bankrate.com) can explain the growing popularity, some believe. “My overarching conclusion about why equity ownership is relatively high is that the ‘there is no alternative’ principle was alive and well, until very recently,” Christine Benz, direct of personal finance and retirement at Morningstar, told Yahoo! Finance Thursday. (ADG)

THE DAILY EDGE: 30 MAY 2023

Income, spending and inflation remain too strong for the Fed to ignore

The April US personal income and spending report is a fair bit stronger than expected across the board, which will fuel talk of another Federal Reserve rate hike at either the June or July meetings. Incomes rose 0.4% month-on-month as expected, with wages and salaries up by 0.5% MoM, but spending rose by 0.8%MoM versus the 0.5% consensus with March revised higher. Consequently, we find real consumer spending came in at 0.5% MoM versus the 0.3% expected. This will inevitably lead to upward revisions of second-quarter GDP expectations given consumer spending is two-thirds of economic activity as measured by GDP.

We then turn to inflation, and the core PCE deflator has come in at 0.4%/4.7% rather than the 0.3%/4.6% expected. This move higher will inevitably boost the case of the Fed hawks such as James Bullard and Neel Kashkari that policy needs to move tighter to ensure inflation returns to the 2% target in a timely manner. (…)

  • Wages and salaries rose 0.5% in April from 0.2% and 0.3% in the previous 2 months. YtD after 4 months: +5.8% a.r..
  • Disposable income was up 0.4% in April and is up 10.5% a.r. YtD as effective tax rates dropped in January.
  • The effective tax rate (black line, right scale) is gradually heading back to its 11.75% pre-pandemic rate (April: 12.8%)
  • Lower cash taxes and excess savings are keeping consumers busy: expenditures jumped 0.8% in April, +9.0% a.r. YtD.

fredgraph - 2023-05-29T062746.210

  • In real terms, spending rose 0.5% in April, continuing a very erratic behavior since November:

fredgraph - 2023-05-29T064053.124

  • Compared with pre-pandemic levels, real expenditures are up 8.2% even though real income is up only 2.2%. The savings rate went from 9.3% to 4.1% during the period.

fredgraph - 2023-05-29T065109.072

  • Fed tightening has been totally disregarded by a flush consumer: excess savings, steady labor markets, declining taxes and low gas prices are keeping YOLO spending spirits high after tough pandemic years.
  • The problem for the Fed is that core inflation is sticky at a monthly 0.4% rate for both total PCE and services inflation:

image

  • The Fed says it will not tolerate 5% inflation. Services prices are the target but demand for services does not react much to higher interest rates, if at all. Services inflation stems from wages which are 19.1% above their pre-pandemic level against 14.0% for services prices.

image

  • Wage growth seemed to be slowing in January but is now back to its 0.4% (5.0% a.r.) monthly growth pace:

fredgraph - 2023-05-29T072554.243
  • Wages have been increased in spite of sharp gains in productivity during the pandemic years but Q1’23 productivity fell below Q4’19 levels. Wage increases of 3.5% would be consistent with 2% inflation if productivity resumes the 1.5% annual growth achieved between 2016 and 2019.

image

The Fed was clamoring its data dependency until SVB. It then invoked monetary lags and the widely expected credit crunch post SVB to justify a pause. The lags may still be there, though pretty slow showing up, but the credit crunch is not materializing, even at smaller banks (through May 26):

fredgraph - 2023-05-29T095214.718

One positive view of core PCE inflation is that the 3-month change is now 4.2% a.r., down from 4.9% in March. But that was because January’s MoM print was 0.55%. The last 4 months comes in at 4.8% a.r., up from 4.2% between September and December.

Goldman Sachs calculates that “48% of core services categories excluding shelter increased by at least 4% (annualized) over the past six months (vs. 47% in March and 66% at the peak).”

BTW, the Cleveland Fed’s Inflation Nowcast, spot on for the April numbers, is showing core CPI at +0.45% and core PCE at +0.38% for May. The YoY prints would be +5.3% and +4.7% respectively.

The inflation mission is not accomplished just yet.

  • “I think everyone should be prepared for rates going higher from here. That 5% is not enough in Fed funds, if I — and I’ve been advising this to clients and banks, you should be prepared for 6, 7…there’s still too much liquidity in the system, which is why stocks are high, bond spreads are still…So I think there’s a chance you’re going to have rates ticking up and not to 3.78. I’m talking about 4.25, 4.5, 5, 6, maybe even 7.” – JPMorgan Chase (JPM ) CEO Jamie Dimon

Goods demand is weak:

(…) The retailer on Thursday said comparable sales excluding fuel in constant currency rose 3.5% in the quarter ended May 7 compared with a year earlier—lower than the 4.2% growth Wall Street analysts expected. It was also the weakest comparable sales growth Costco has seen since 2017. This follows Dollar Tree reporting more business from shoppers who earn annual incomes of $80,000 or more in its stores. Those shoppers weren’t looking for party favors or tchotchkes; they were putting everyday necessities in their basket. Likewise, Walmart last week said that it continues to gain grocery market share among higher-income shoppers.

While shoppers still love going to Costco—traffic at its stores rose 4.8% globally and memberships grew 7%—they are walking out with smaller receipts. The average daily transaction declined 4.2% as shoppers bought fewer big-ticket discretionary items. (…)

Chief Financial Officer Richard Galanti said on Thursday’s earnings call that sales have shifted from beef to poultry and pork, a trend the company historically sees during recessions. Some are even switching to canned products such as chicken and tuna. The share of sales that came from its Kirkland Signature private brand rose 1.2 percentage points last quarter—much faster than the pace of private label share growth it has seen historically. Interestingly, Galanti said customers bought apparel “in a big way,” which could mean more higher-income consumers are trading down from department stores. (…)

  • “…our top line comp ran down 6%” – Williams-Sonoma (WSM ) CEO Laura Alber
  • “Net sales decreased 3.3%, and comparable sales were down 4.3%. …we continue to see softness in the home category” – Kohls (KSS ) CEO Thomas Kingsbury
  • “…what we’re seeing is pressure across big-ticket discretionary purchases primarily. We’re seeing some pressure in small ticket, but it’s more pronounced in big-ticket and is almost exclusively discretionary DIY.” – Lowe’s (LOW ) EVP-US Stores, Home Depot Marvin Ellison
  • “We are seeing subdued demand in our furniture business with customers demonstrating more caution on high ticket considered purchases.” – Williams-Sonoma (WSM ) CEO Laura Alber
  • “And so we’ve got, I think, a very clean look at consumer intent. And I’ll tell you, it’s a healthy market right now, and it’s persisting into the second quarter. And we’re seeing strong demand signals.” – Cars.com (CARS ) CEO Alex Vetter “Our traffic is up 19% year-over-year, and our marketing expense is actually down.” – TrueCar (TRUE ) CEO Michael Darrow

Except for cars which are slowly coming back from their own covid recession

  • “…pre-COVID, there were about 3.5 million to 4 million new cars in dealer inventory pre-COVID going at the end of 2019. In 2022 at its lowest point, it got under 1 million units. So it started to build back up. At the end of March, there was about 1.7 million new cars in dealer inventory, so it’s starting to rebuild” – TrueCar (TRUE ) CEO Michael Darrow

Services are using the remaining excess savings

  • “We aren’t seeing any weakness in demand. We’re not seeing any fall-off, which is the uncertainty in the economy. So right now, our projections hold. We’re still expecting to have unit revenue full year kind of in that up low single-digit range.” – American Airlines (AAL ) CFO Devon May

Debt Deal to Hit a US Economy Already Facing Recession Risk

The cap on government spending in Washington’s deal to raise the federal debt limit adds a fresh headwind to a US economy already burdened by the highest interest rates in decades and reduced access to credit. (…)

Federal spending in recent quarters has helped support US growth in the face of headwinds including a slump in residential construction, and the debt-limit deal is likely to at least damp that impetus. (…)

Image

“It’s an important development — it’s been more than a decade since monetary and fiscal policymakers were rowing in the same direction,” said Jack Ablin, chief investment officer at Cresset Capital Management. “Perhaps fiscal restraint will be another ingredient to weigh on inflation.” (…)

The Treasury has run down its cash balance to keep making payments since it hit the $31.4 trillion debt limit in January, and once the ceiling is suspended by the coming legislation, it will ramp up sales of Treasury bills in order to rebuild that stockpile to more normal levels.

That wave of newly issued T-bills will effectively drain liquidity from the financial system, although its exact impact could be challenging to assess. Treasury officials may also arrange their issuance to minimize disruptions. (…)

The International Monetary Fund last week said that the US would need to tighten its primary budget — that is, excluding debt-interest payments — by some 5 percentage points of GDP “to put public debt on a decisively downward path by the end of this decade.” (…)

  • The spending deal looks likely to reduce spending by 0.1-0.2% of GDP yoy in 2024 and 2025, compared with a baseline in which funding grows with inflation. That said, the boost to funding Congress approved late last year for FY23 was so large (nearly 10% yoy) that overall discretionary spending is likely to be slightly higher in real terms next year despite the new caps. (GS)

European inflation

Markets expect German inflation to print at 0.2% MoM, which looks relatively fair but the scope for surprises on the low side is increasing to due pent-up weakness in input costs. The PPI has fallen off a cliff since late 2022 alongside lower electricity -and gas prices. (Stone Research)

May’s reading moderated to 2.9% — the least since July 2021 — as fuel costs fell and the growth in food prices eased. The result follows April’s uptick to 3.8% and is well below the 3.3% median estimate in a Bloomberg survey of economists.

There was good news, too, on underlying inflation as the gauge that excludes the costs of energy and some food items fell for a third straight month, though it remained elevated at 6.1%.

Spanish Inflation Slowed to 2.9% in May

  • USA?

PPI Final Demand vs CPI and PCE Deflator

fredgraph - 2023-05-30T061600.612

  • In the real world:

    • “Inflation continues to abate somewhat. If you go back a year ago to the fourth quarter of ’22 last summer, we had estimated that year-over-year inflation at the time was up 8%. And by Q1 and Q2, it was down to 6% and 7% and then 5% and 6%. In this quarter, we’re estimating the year-over-year inflation in the 3% to 4% range” – Costco (COST ) CFO Richard Galanti

    • “…we saw wage inflation moderate to approximately 4%. While the staffing environment has substantially improved versus this time last year, we don’t envision wage inflation pulling back much from these levels as there continues to be regulatory and market pressures.” – Autozone (AZO ) CEO William Rhodes

    • “Coming into this year, in January, we saw something that for us was unprecedented, which was a steep decline year-over-year in the amount of hiring that companies were doing. And what was interesting about January is that it was no longer just SMBs, but it was also enterprises. So we shared the information that we had at that point, which was that effectively January was down 15% year-over-year. Q1 came in 19% down year-over-year. And then we also shared April data, which was down 27% year-over-year. So this is a macroeconomic economy-wide all job categories, all — companies of all sizes, slowed down in hiring.” – ZipRecruiter (ZIP ) CEO Ian Siegel

Why Are Markets So Calm? Quants Are Dominating Firms that use computers to determine buy and sell signals have been loading up while other investors sit back.

(…) Over recent months, stocks have handily overcome stress in the banking system, stubborn inflation and interest-rate hikes. Last year, those kinds of issues repeatedly torpedoed stocks. This year, markets have met such events with a shrug. (…)

One explanation: Quant funds, or those relying on computer models and automated trading, have been doubling down on equity markets as other investors have stepped back, citing high valuations and concerns about the likely course of the U.S. economy.

Quant-fund buying has pushed these funds’ net exposure to U.S. stocks to the highest level since December 2021, according to data from Deutsche Bank. Mainstream investors, in contrast, have been pulling cash from stock funds and pouring it into money markets.

The continuing demand from quants has provided a lifeline for the stock market. Combined with robust corporate buybacks, their buying has helped counteract selling pressure and led to placid moves. The S&P 500, for example, has moved less than 1% in either direction for 36 of the last 46 sessions, according to Dow Jones Market Data, the quietest 46-day stretch since December 2021.

(…) systematic and fundamental investors haven’t been this divergently positioned since 2019.

Driving the quant funds is a self-reinforcing dynamic. When market volatility drops, they pile in more. Big stock-market moves collapsed this spring after regulators rushed to stem the banking crisis, and the Federal Reserve signaled it might stop raising interest rates soon.

So-called vol-control and risk-parity funds, which tend to automatically load up on riskier assets during calmer periods, ramped up equity exposure, according to the Deutsche Bank data, available through May 18. Other quants, such as trend-following CTAs, or commodity trading advisers, have similarly piled in.

The dominance of quants has helped explain previous periods of calm trading, including long stretches in 2017 and 2018. Those periods were punctured by rapid selloffs, including the 2018 selloff dubbed “Volmageddon” when the dynamics exerting calm on the market suddenly went away. Some warn a repeat could be ahead.

“If you do have concentrated positioning, it does create the risk of unwinds in the case of a negative shock,” said Christian Mueller-Glissmann, head of asset allocation research at Goldman Sachs. “And the risk you face with them is not just that they might have bought some equities because volatility has gone down, they might have levered up.”

The market has started to see early signs of eroding tranquility. Last week, the Cboe Volatility Index—the VIX, or Wall Street’s fear gauge—on Wednesday briefly settled above 20 for the first time in about three weeks as simmering debt-ceiling anxieties surfaced. Typically, anything higher than 20 indicates fear is starting to rise. (…)

At the end of March, quant-focused hedge funds held about $1.13 trillion in assets, according to research firm HFR, hovering just below last year’s record high. That represents about 29% of all hedge-fund assets. (…)

Tech Stock Rally Leaves Small-Caps in the Dust One measure shows large-cap stocks beating smaller companies by the widest margin in 25 years.

The Russell 1000 index of large companies has gained 9.2% this year, beating the 0.7% advance of the small cap concentrated Russell 2000. That is the widest outperformance since 1997, when looking at years in which the Russell 1000 has been in positive territory through May 26, Dow Jones Market Data show. (…)

Some investors, though, are wary that the stock market’s rally is too narrow underneath the surface, leading to doubts about its sustainability if one or more of the market’s behemoths were to falter. (…)

Tech stocks emerged as haven play during the March banking crisis, with investors betting that the collapse of three regional banks would force the Fed to pause its bid to raise interest rates. Lower rates boost the appeal of growth companies, such as tech stocks, which have the potential to generate windfall profits many years in the future. (…)

Investors poured more than $2.6 billion into U.S. stocks on a net basis during the week ended May 19, the largest net inflow since October, Bank of America global research data show. About $2.2 billion of that sum went to large-caps, while small-caps logged net outflows of $42 million. (…)

The Russell 2000 is trading at 12.8 times expected earnings over the next 12 months, below its historical average of 15.8, based on FTSE Russell data going back to 1979, when the index was created.

In comparison, the Russell 1000 trades at about 18 times earnings, above its historical average of 15.8. Meta’s multiple is about 20, while Tesla’s and Nvidia’s are both around 47. (…)

QQQ/IWM

Image

@carlquintanilla

image

image

(Yardeni Research)

  • The S&P 600 index is still in a bear market at -23% from its recent peak, -2% YtD. The junkier Russell 2000 is off 28% from its peak, flat YtD.
  • The S&P 500 Equal Weight is not keeping pace with the heavy weights:

image

MarketCharts @Callum_Thomas

@_rob_anderson

  • But S&P 500 earnings are looking better:

image

Why You’re Losing More to Casinos on the Las Vegas Strip Casinos are making it costlier to play and harder to win. Blackjack players lost nearly $1 billion on the Strip last year, the second-highest loss on record, after 2007.

Some Las Vegas casinos cut back the number of blackjack tables with dealers, raised minimum bets during busy times and lifted their advantage over players in some games—doubling-down on a prepandemic practice of making subtle changes that favor the house, according to industry executives, researchers and gamblers.

These changes are part of a broader effort by companies to make Las Vegas more of an upscale destination.

“You’re bringing in higher value customers, and we’re already full,” Caesars Entertainment CZR 1.81%increase; green up pointing triangle Chief Executive Tom Reeg said on a call with Wall Street analysts this month. “So, you’re kicking out the lowest end. I see no reason that that needs to stop or would stop.” (…)

Las Vegas Strip casinos took in nearly $8.3 billion in gambling revenue last year, a record that exceeded prepandemic revenue by more than 25%, according to state regulators. In 2022 the number of visitors to Las Vegas fell short of 2019 levels, but tourists last year still spent money at record-setting levels, according to tourism officials. (…)

Blackjack, a fast-paced card game, historically paid out a ratio of 3:2 when a player hit 21 on the first two cards. That means a gambler wins $15 for every $10 bet. Now, many blackjack tables on the Strip pay out at 6:5, which means that same $10 yields only $12. (…)

Casino executives say labor costs make table games expensive to operate, making the lower-priced bets more difficult to offer. Casinos are also offering fewer opportunities to play at a table. Last year Strip casinos had about 1,090 blackjack tables, down about 19% from a decade ago, state records show. (…)

Gamblers playing the centuries-old game roulette must look closely from table to table to figure out their odds of winning. Triple-zero roulette, a version that leans in favor of the casino, is increasingly popping up on the Strip. Historically, American casinos more commonly used a wheel with 38 slots, including 18 black, 18 red, and two green slots numbered zero and double-zero. The triple-zero roulette adds another slot with three zeros, lifting the house’s advantage and making gamblers’ bets more difficult to win. (…)

According to Vegas Advantage’s survey, the triple-zero roulette tables have grown from a handful in 2016 to 78 last year, compared with 111 double-zero tables. (…)

FYI
  • U.S. Still Spends More on Military Than Next Nine Countries Combined

Institute for Policy Studies

Pointing up Note: special thanks to The Transcript for the quotes from corporate conference calls.