Consumer Spending Fell 0.2% in December U.S. households cut spending in December, adding to signs of an economic slowdown. Underlying inflation cooled to its slowest pace since October 2021.
(…) the second straight monthly drop following solid spending increases during several months last year. Adjusted for inflation, spending fell 0.3% last month. (…)
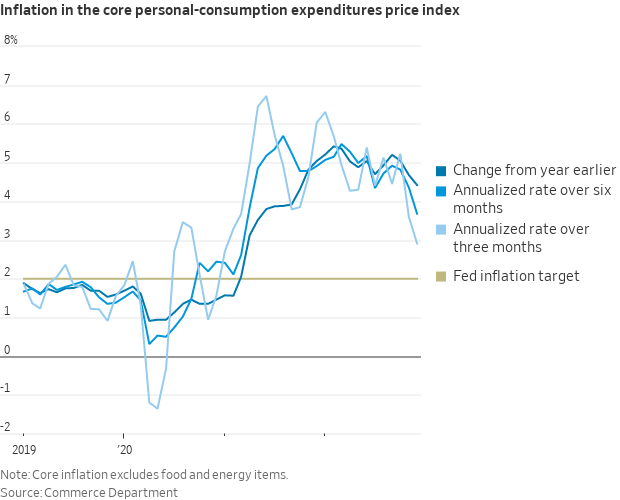
The personal-consumption expenditures price index, the Federal Reserve’s preferred gauge of inflation, rose 5% in December from a year earlier, after increasing 5.5% in November.
The core PCE-price index, which removes volatile food and energy prices, rose 4.4% in December from a year earlier, its slowest pace since October 2021. That compared with 4.7% in November. The central bank aims for 2% annual inflation.
On a month-to-month basis, the PCE-price index rose 0.1% in December from the prior month, matching November’s increase. Core prices rose 0.3% in December from the prior month, up from November’s 0.2% increase. (…)
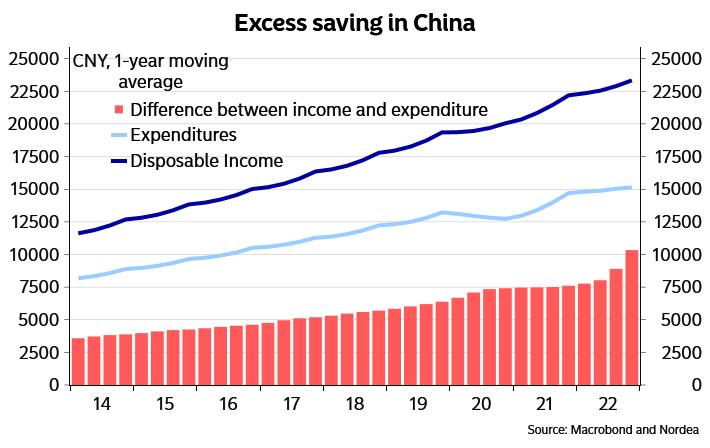
The personal saving rate increased to 3.4% in December from 2.9% in November as consumers earned more and spent less, the Commerce Department said. (…)
Personal income increased 0.2% in December from the prior month, compared with a 0.3% increase in November and 0.8% in October. (…)
This chart stacks MoM dollar changes in real expenditures. See how Services are no longer offsetting declining spending on Goods. The squeeze is real and significant.

Note that real expenditures for October and November were revised downward by -0.3% in total. The last 2 months of 2022, the most important months of the year, were the 2 worst consecutive months for real spending since 2009.
Two consequences:
- The handoff for Q1’23 is very weak. A consumer recession is now more probable.
- Contrary to what the retail sales report suggested two weeks ago, excess goods inventories are being reduced very slowly, meaning that manufacturing, domestic and foreign, will suffer in coming months.
On the other hand, the Fed sees its actions paying off, well before all the lagging effects are in:
- consumer demand is declining, -3.0% annualized in November-December;
- employee compensation has slowed to +3.6% a.r. in nominal terms at the end of 2022, from +5.6% in Aug-Sep and +6.5% in May-Jul.
Lower wage increases and lower energy costs should normally translate into reduced pressures on Services prices which remain too high at +0.5% MoM in December and +4.9% a.r in Q4. Core PCE inflation was only 3.2% a.r. in Q4 but, when Goods prices stop declining (they have declined in 5 of the last 6 months, -3.2% a.r.), core inflation will need slower services inflation to reach the Fed’s goal.
But the surprise could well be lower than expected inflation given slow demand overall. The Fed may actually have been tightening hard into a hard landing.
When December retail sales were released on Jan. 19, down 1.1% MoM, I wrote:
But because of the severe goods deflation underway, the recent nominal retail sales data can be misleading to the unwary.
There is no official retail sales deflator but a weighted sum of CPI-Durables (33%) + CPI-Nondurables (67%) provides a decent approximation of “CPI-Retail”. In December, CPI-Retail prices declined 1.1% after -0.3% in November.
So inflation-adjusted retail sales were actually unchanged in December following -0.7% in November and +0.7% in October.
But real personal expenditures on goods dropped 1.6% in December after -1.3% in November, much worse than the 1.1% drop in retail sales. These two series are 93% correlated since 1994 suggesting meaningful revisions are likely.
The PCE Goods price index declined 0.75% (vs CPI-Retail at -1.1%) in December after -0.4% in November (vs -0.3%). These two series are 95% correlated since 1994.
So it looks like December real retail sales were actually much worse than what was thought only 2 weeks ago.
Combined with real spending on Services, up only 1.2% annualized in Q4 and 0.0% in December, a consumer recession is regaining credibility with recent and likely coming revisions.
In fact, revisions to major economic data (wages, employment, consumption, inflation) are all negative, dragging the Citigroup Economic Surprise Index back into negative territory.
David Rosenberg recently hosted Danny Blanchflower, a labor economist and a research associate at the National Bureau of Economic Research, which is tasked with actually dating economic recessions. Blanchflower says that revisions will likely result in October 2022 proving to having been the start of the recession.
We have had two consecutive -2% months on retail sales, which has only occurred in recessions and were always followed by at least 2 more down months.

And Friday’s PCE data not only suggest that December retail sales could be revised down, but also reveal that spending on services is not acting as the expected offset.
Meanwhile, real disposable income, after being bloated by pandemic relief money, is now back to its pre-pandemic level. Yet, real expenditures are up 6.8% in the meantime, thanks in large part to credit card balances having been jacked up 11.8%. Spent out and maxed out!
True, employment is holding, but only because employers are afraid to let employees go. However, they are aggressively cutting hours. Good producers have reduced weekly hours 3.1% vs their 2019 average. Hours at service providers are still 0.9% above their 2019 average but are down 0.5% from their April 2021 peak.
In total, aggregate weekly hours (hours x employment) have declined in both November and December, something only happening in recessions.

The Conference Board LEI has declined 10 months in a row. Its 6-month rate of change is -3.2%, a level always seen in recessions.

(Vettafi)
On a YoY basis:

Steve Blumenthal offers this Ned Davis chart on the Coincident Economic Indicator:

U.S. 4th Quarter GDP (NBF)
Data released yesterday by the Bureau of Economic Analysis (BEA) showed real GDP expanding at a stronger-than-expected pace in Q4 (+2.9% vs. +2.6%). While some may have cheered this positive surprise, we saw the glass as half empty.
Roughly half of the growth reported in the final quarter of 2022 was due to a buildup in inventories, which have an unfortunate tendency for short-term mean reversion. Sinking imports also contributed positively to the headline print, hardly reassuring considering this may well have been caused by a slowdown in domestic demand.
Adding to the bad news, final sales to private domestic purchasers (household consumption + gross private investment), a good gauge of the underlying strength of an economy, expanded just 0.2% annualized in the quarter, the least since 2009Q4 if we exclude the early days of the pandemic.
As today’s Hot Chart shows, this key measure is up just 0.5% annualized over the past 3 quarters (i.e. since the Fed started tightening monetary policy).
When has such weak growth been observed over 9 months in the past you may ask? Answer: 2020, 2008-09, 2001, 1990-91, 1981-82, 1980, 1973-75, 1960-61, 1958, 1953-54, 1951 and 1949.
Our readers may have spotted a pattern here: in eleven of those 12 instances, the U.S. economy was either in recession or about to enter one (1951 being the exception). The scenario could very well be the same this time around if the Fed persists in raising its key rate well beyond the current level and holding it there for an extended period. Doing so could have unpalatable consequences down the road.

What CEOs Are Saying: ‘The Consumer Is Under Pressure’ Here’s what leaders from Nasdaq, Microsoft, Tesla and elsewhere said about the economy, inflation and other topics this week.
- Microsoft: “A few things are increasingly clear. Just as we saw customers accelerate their digital spend during the pandemic, we are now seeing them optimize that spend. Also, organizations are exercising caution given the macroeconomic uncertainty. And the next major wave of computing is being born as we turn the world’s most advanced AI models into a new computing platform.” (Jan. 24)
- Visa: “In total spend, it’s remarkable stability. What’s happening is as goods spending slowed down a bit, services spending really took up all the slack. And so, consumers have just shifted their spending, but they’re spending the same amount.” (Jan. 26)
- Kimberley-Clark: “I do sense the consumer is under pressure. And we’ve been out talking to our top customers, and so we recognize that the consumer is working through some challenges pocketbook-wise.” (Jan. 25)
- 3M: “The slower-than-expected growth was due to rapid declines in consumer-facing markets such as consumer electronics and retail—a dynamic that accelerated in December as consumers sharply cut discretionary spending and retailers adjusted inventory levels. … We expect the demand trends that we saw in December to extend through the first half of 2023.” (Jan. 24)
- Boeing: “Hiring is not a constraint anymore. People are able to hire the people they need. It’s all about the training and ultimately getting them ready to do the sophisticated work that we demand.” (Jan. 25)
- Automatic Data Processing: “Jobs growth in the U.S. labor market has been slowing, but clearly remains solid which you see reflected in our client base. Despite recent headlines noting job cuts by a number of companies, we have yet to see broad-based softening in the labor market.” (Jan. 25)
- Intel: To various degrees, all our markets are being impacted by macro uncertainty, rising interest rates, geopolitical tensions in Europe, and Covid impacts in Asia, especially in China.” (Jan. 26)
(…) The contraction in activity was solid overall, but the slowest since last October. Goods producers and service providers recorded similar rates of decline, with service sector firms indicating a notable slowdown in the pace of decrease since December. Nonetheless, companies continued to highlight subdued customer demand and the impact of high inflation on client spending.
At the same time, new orders across the private sector declined for the fourth successive month in January. The fall in new business was modest overall, and eased to the slowest for three months. Inflation, interest rates and customer hesitancy continued to be reported as driving the downturn.
Service providers registered a marginal decrease in new sales, but manufacturers saw new orders fall sharply once again. Conversely, manufacturers recorded a slower contraction in new export orders compared to their service sector counterparts. (…)
US firms recorded a marginal rise in employment at the start of 2023. The rate of job creation was one of the softest in the current sequence of employment growth that began in July 2020. (…)

Visa, Mastercard pin hopes on China reopening as travel boom fades Both Visa and Mastercard warned of moderating travel recovery, but credit card lender American Express Co gave little weight to those fears on Friday, highlighting that high-income customers which the company mostly caters to, are still holding out well.
Banks Brace for More Consumers to Fall Behind on Their Loans Delinquencies are rising, prompting lenders to add to rainy-day funds
(…) Capital One Financial Corp. set aside roughly $1 billion to cover potential loan losses in the fourth quarter, a 33% increase from the previous quarter. American Express Co. increased its reserves by more than 25%, setting aside nearly half a billion dollars. Both had drawn down those rainy-day funds a year earlier. (…)
Borrowers have put more purchases on credit cards, but they chipped away at balances at a slower rate. Delinquency rates on credit cards and consumer loans in the fourth quarter approached or hit levels they were at before the pandemic, when stimulus and lower spending on services allowed consumers to bulk up their savings and pay down debt.
Delinquency rates have surpassed prepandemic levels in some corners of the consumer-lending business. (…)

There is also BNPLs…
Japan, Netherlands Agree to Limit Exports of Chip-Making Equipment to China Deal with U.S. comes as President Biden seeks to slow China’s military development
(…) Under the agreement reached Friday, the Netherlands will bar ASML Holding NV, a Dutch maker of photolithography machines, from selling to China at least some immersion lithography machines, the most advanced kind of gear in the company’s deep ultraviolet lithography line. The equipment is essential to making cutting-edge chips. Japan will set similar limits on Nikon Corp., according to one of the people familiar with the discussions. (…)
The support of the Japanese and Netherlands governments is critical for the success of the U.S.’s export-control policy because of the importance of a small number of semiconductor-manufacturing equipment makers from the two countries, which include ASML, Nikon and Tokyo Electron Ltd. (…)
The US Hasn’t Noticed That China-Made Cars Are Taking Over the World The country is poised to become the No. 2 exporter of passenger vehicles, surpassing the US and South Korea and risking new tensions with trading partners and rivals.
(…) Overseas shipments of cars made in China have tripled since 2020 to reach more than 2.5 million last year, according to data from the China Passenger Car Association. That’s only a whisker (about 60,000 units) behind Germany, whose exports have fallen in recent years. China’s numbers, behind Japan but ahead of the US and South Korea, herald the emergence of a formidable rival to the established auto giants.
Chinese brands are now market leaders in the Middle East and Latin America. In Europe, the China-made vehicles sold are mostly electric models from Tesla Inc. and Chinese-owned former European brands such as Volvo and MG, and European brands like Dacia Spring or the BMW iX3, which is produced exclusively in China. A raft of homegrown marques like BYD Co. and Nio Inc. are ascending as well, with ambitions to dominate the world of new-energy vehicles. Backed by Warren Buffett’s Berkshire Hathaway Inc., BYD is already charming EV buyers in developed countries such as Australia. (…)
The target is to sell 8 million passenger vehicles overseas by 2030—more than twice Japan’s current shipments, he says. (…)
The surge in car exports has largely gone unnoticed in the US, partly because it happened during the coronavirus pandemic and partly because Chinese carmakers are mostly focused on Europe, Asia and Latin America. General Motors Co. did sell about 40,000 of its China-made Buick Envision compact SUVs in the US in 2021, but political tensions, the continuation of Trump-era tariffs and subsidies aimed at boosting domestic EV production have diminished the appeal of that market. (…)
“To fight the Chinese, we will have to have comparable cost structures,” Stellantis NV CEO Carlos Tavares said on Dec. 19, speaking to reporters at a powertrain plant in Tremery in northern France. “Alternatively, Europe will have to decide to close its borders at least partially to Chinese rivals. If Europe doesn’t want to put itself in this position, we need to work harder on the competitiveness of what we do.” (…)
China tends to export relatively cheap cars. At around $13,700, the average price of an exported China-made passenger vehicle was about one-third that of a German car in 2021, and about 30% less expensive than a Japanese make, according to data provided by UN Comtrade. That means Chinese cars are most likely to pose a threat to cheaper Japanese and South Korean models, rather than to German marques. (…)
Having demonstrated that it’s a reliable manufacturing hub for industry majors, China has been leading the charge on the next frontier: EVs. Local carmakers have found the electric platform relatively easy to master compared with the complex internal combustion engine.
“The switch to battery means the motor is no longer a differentiator,” says Alexander Klose, executive vice president for overseas operations at Aiways Automobiles Co., a pure-Chinese EV maker, which has sold several thousand vehicles in Europe. Technologically, “it’s created a level playing field,” he says. (…)
A global push to cut carbon emissions and save the planet has prompted Beijing to encourage EV makers and buyers with subsidies, while a robust local supply chain has made it cheaper to make an EV in China than in any other place. Tesla’s Shanghai factory produced almost 711,000 cars last year and accounted for 52% of the company’s worldwide output. The measures have also spawned dozens of domestic manufacturers like Aiways. Many have barely made a dent, but BYD, Nio and XPeng Inc. are among standouts with potential to shine on the global stage.
BYD, which also makes its own batteries and chips, is the biggest EV producer at home. It has ambitions of becoming the Toyota of EVs for the world’s budget buyer, and it’s betting its own cells and semiconductors will help it reach that goal. (…)
“The long-term trend is for increasing sales of Chinese brands around the world.”
EARNINGS WATCH
From Refinitv/IBES:
Through Jan. 27, 143 companies in the S&P 500 Index have reported earnings for Q4 2022. Of these companies, 67.8% reported earnings above analyst expectations and 28.7% reported earnings below analyst expectations. In a typical quarter (since 1994), 66% of companies beat estimates and 20% miss estimates. Over the past four quarters, 76% of companies beat the estimates and 21% missed estimates.
In aggregate, companies are reporting earnings that are 1.6% above estimates, which compares to a long-term (since 1994) average surprise factor of 4.1% and the average surprise factor over the prior four quarters of 5.3%.
Of these companies, 65.0% reported revenue above analyst expectations and 35.0% reported revenue below analyst expectations. In a typical quarter (since 2002), 62% of companies beat estimates and 38% miss estimates. Over the past four quarters, 73% of companies beat the estimates and 27% missed estimates.
In aggregate, companies are reporting revenues that are 0.6% above estimates, which compares to a long-term (since 2002) average surprise factor of 1.3% and the average surprise factor over the prior four quarters of 2.5%.
The estimated earnings growth rate for the S&P 500 for 22Q4 is -2.9% [-1.6% on Jan. 1]. If the energy sector is excluded, the growth rate declines to -7.1% [-6.7%].
The estimated revenue growth rate for the S&P 500 for 22Q4 is 4.2% [4.1%]. If the energy sector is excluded, the growth rate declines to 3.4% [3.3%].
The estimated earnings growth rate for the S&P 500 for 23Q1 is -1.2% [+1.4%]. If the energy sector is excluded, the growth rate declines to -2.9% [-1.1%].
Revisions are 60% negative in January.


- 19 companies in the index have issued EPS guidance for Q1 2023. Of these 19 companies, 17 have issued negative EPS guidance and 2 have issued positive EPS guidance. The percentage of companies issuing negative EPS guidance for Q1 2023 is 89% (17 out of 19), which is above the 5-year average of 59% and above the 10-year average of 67%.
- At the sector level, the Information Technology has the highest number of companies issuing negative EPS guidance 12. The ratio of the number of companies issuing negative EPS guidance to positive EPS guidance in this sector is 12 to 1. (Factset)
The relationship with LEIs suggests there is more to come:

Trailing EPS are now $221.70. Full year 2023e: $226.01.
- Historic Crash for Memory Chips Threatens to Wipe Out Earnings The $160 billion memory-chip industry is suffering one of its worst routs ever.
(…) There’s a glut of the chips sitting in warehouses, customers are cutting orders, and product prices have plunged.
“The chip industry thought that suppliers were going to have better control,” said Avril Wu, senior research vice president at TrendForce. “This downturn has proved everybody was wrong.”
The unprecedented crisis isn’t just wiping out cash at industry leaders like SK Hynix Inc. and Micron Technology Inc., but also destabilizing their suppliers, denting Asian economies that rely on tech exports, and forcing the few remaining memory players to form alliances or even consider mergers. (…)
Already, Samsung Electronics Co. and its rivals are losing money on every chip they produce. Their collective operating losses are projected to hit a record $5 billion this year. Inventories — a critical indicator of demand for memory chips — have more than tripled to record levels, reaching three to four months’ worth of supply. (…)
The industry is suffering from a unique combination of circumstances — a pandemic hangover, the war in Ukraine, historic inflation and supply-chain disruptions — that have made the slump much worse than a regular cyclical downturn.
Micron, the last remaining US memory chipmaker, has responded aggressively to plummeting demand. The company said late last month that it will cut its budget for new plants and equipment in addition to reducing output. The rate at which the industry rights itself will depend on how quickly the company’s counterparts make similar moves, Chief Executive Officer Sanjay Mehrotra said. (…)
Chip-manufacturing equipment maker Lam Research Corp. said last week that it’s seeing an unprecedented reduction in orders as memory customers cut and postpone spending. Executives at the company, which counts Samsung, SK Hynix and Micron as its top customers, declined to predict when such actions might help the memory market rebound.
“We’ve seen extraordinary measures within the memory market,” Lam CEO Tim Archer said on a call with investors. “It’s at levels that we haven’t seen in 25 years.” (…)

Note: Memory-chip king Samsung reports tomorrow.
The Korean tech giant has typically continued to spend during downturns, hoping to exit them with superior production and higher profitability when demand picks up. This time around, the market has been betting the company will tighten its chip supply, lifting its stock price in recent weeks.
TECHNICALS WATCH
- 13/34–Week EMA Trend (CMG Wealth)


From The Market Ear:
Who has been buying outside of short covering?
MS QDS team says that it’s mostly from the systematic buyers and retail buyers outside of normal short covering activities. Specifically, the team estimates that there were ~$20bn of systematic demand this week on top of approx $11bn of net buying from Retail over the last 9 trading days ($6.8bn last week & $4.4bn WTD.) Meanwhile, corporate buybacks are coming back online and there is only small supply in US Equity from Month End Pension rebalancing (US $2.5bn sale). (MS QDS)

Global GDP by country in 2022

Source: Visual Capitalist Read full article
China Says No New Covid Variant Found in Lunar New Year Holiday
China has yet to detect any new Covid mutations during the seven-day Spring Festival holiday that ended Friday, Chen Cao, a researcher at the Chinese Center for Disease Control and Prevention, says at a briefing.
- The CDC will keep monitoring for any new mutations as large numbers of college students will return to schools from their hometowns, Chen says
- The Covid outbreak in China has eased to a “low level,” says Mi Feng, spokesman for the National Health Commission
- Domestic trips via railway, roads, airlines and waterway in 7-day holiday rose 71% from the holiday in 2022 to 226m trips
- Cross-border trips grow 121% y/y in the holiday
FYI: 


By The New York Times | Sources: Institute for Health Metrics and Evaluation at the University of Washington, Small Arms Survey, World Bank