MANUFACTURING PMIs
USA: S&P Global: Renewed drop in output as demand dwindles, with price pressures dissipating in June
The seasonally adjusted S&P Global US Manufacturing Purchasing Managers’ Index™ (PMI™) posted 46.3 in June, down from 48.4 in May. The index therefore signalled the steepest decline in operating conditions in 2023 so far, as the recent downturn intensified. Manufacturing performance has deteriorated in seven of the last eight months.
Underpinning the latest PMI reading was a marked contraction in new orders in June. The decrease was the steepest of the year so far and the second-fastest in over three years. Firms commonly attributed the decline to suppressed demand due to inflationary pressure and higher interest rates.
At the same time, external demand weakened. New export orders fell for the thirteenth month running and at a sharp rate that was among the fastest in the last three years.
Subsequently client reticence ensured that production moved back into contraction territory following a three month period of expansion. The rate of decline was the joint sharpest in 2023 to date. Some companies also stated that additional production was no longer being used to replenish tocks amid weak demand.
Prices pressures dissipated in June as input costs fell for a second month running. Manufacturers saw the sharpest drop in material prices since May 2020. Suppliers were often reported to offer promotions in an effort to entice purchases of inputs.
Output charges, meanwhile, were broadly unchanged on the month. The respective seasonally adjusted index was at its lowest level in three years. Although some firms noted the pass through of cost savings to customers, others stated that they continued to transfer previous cost increases to clients in an effort to protect margins.
Input buying at goods producers contracted at the steepest rate since January, as dwindling new orders led firms to adjust their spending downwards. Some companies also mentioned that lower purchasing activity reflected efforts to destock and wind down inventories.
Subsequently, stocks of purchases fell at an accelerated pace that was the second-fastest since May 2020. Firms sought to reduce current holdings of inputs for cost considerations. At the same time, stocks of finished goods declined sharply, and at the quickest rate since November 2021.
Despite fragile demand conditions, manufacturers hired new workers in June. Employment growth was modest overall, and softer than in May. Companies continued to highlight more successful recruitment campaigns for long-held vacancies as driving job creation. Nonetheless, backlogs of work were depleted at the second-fastest pace in over three years.
Subdued sentiment at customers was reflected in weaker business confidence in June. The degree of optimism in the year ahead outlook for output softened. Although still forecasting an increase in output, expectations were the lowest in 2023 to date.

USA: The ISM:
The June Manufacturing PMI® registered 46 percent, 0.9 percentage point lower than the 46.9 percent recorded in May. Regarding the overall economy, this figure indicates a seventh month of contraction after a 30-month period of expansion. The New Orders Index remained in contraction territory at 45.6 percent, 3 percentage points higher than the figure of 42.6 percent recorded in May. (…)

Of the six biggest manufacturing industries, only one — Transportation Equipment — registered growth in June.
Demand remains weak, production is slowing due to lack of work, and suppliers have capacity. There are signs of more employment reduction actions in the near term. Seventy-one percent of manufacturing gross domestic product (GDP) contracted in June, down from 76 percent in May. More industries contracted strongly, however, as the share of manufacturing GDP registering a composite PMI calculation at or below 45 percent — a good barometer of overall manufacturing weakness — was 44 percent in June, compared to 31 percent in May.


The seasonally adjusted S&P Global Canada Manufacturing Purchasing Managers’ Index® (PMI®) remained below the 50.0-change mark during June. Moreover, falling slightly from 49.0 in May to 48.8, the index signalled its worst performance since March. It was the second month in a row that a deterioration in operating conditions has been registered.
Firms commented that market demand was subdued, amid reports that high interest rates and the uncertain macroeconomic outlook were leading to the postponement of spending decisions by clients. Companies noted that new export orders were again down, with some firms noting lower demand from the neighbouring USA. The overall decline in new orders was steeper than that seen for production.
And in a sign that the fall in new work was a little sharper than expected, Canadian manufacturers reported a marginal rise in warehouse inventories for a second month in a row. In contrast, inventories of purchases were reported to have declined for an eleventh successive survey period, and to a stronger degree. Companies signalled a preference of utilising existing inventory, rather than buy in new inputs.

- Mexico: “New orders decreased at the end of the second quarter, with survey members attributing the downturn to subdued demand and a reluctance among clients to move forward with pending quotations. As has been the case on a monthly basis since March, new export orders decreased in June. Panellists suggested that challenging economic conditions internationally and weak
sales to the US dampened external orders.”
The HCOB Eurozone Manufacturing PMI, compiled by S&P Global, fell to 43.4 in June, down from 44.8 in May and a twelfth successive month in sub-50.0 contraction territory. Overall, the headline figure signalled the sharpest deterioration in the health of the euro area goods-producing sector since May 2020.
At a country level, June survey data showed manufacturing performances were at their worst since the initial phase of the COVID-19 pandemic in the first half of 2020 for many of the monitored nations. Austria, Germany, Italy, Ireland and the Netherlands registered their sharpest declines in business conditions for over three years. Greece once again bucked the broad trend of deterioration and recorded a fifth consecutive improvement in manufacturing sector performance.
June survey data signalled a third successive monthly reduction in manufacturing output levels across the euro area. The decrease was strong, accelerating since May to the strongest since October last year. According to market groups data, contractions in consumer, investment and intermediate goods output all accelerated on the month, with the latter recording the quickest decrease.
Production volumes were curtailed by marked weakness in demand conditions. Total new order intakes fell rapidly and at the strongest pace for eight months during June. Demand from foreign clients also contracted, marking a sixteenth successive monthly decline in new export business.
Notably, the reduction in new orders outpaced that of output by a considerable magnitude as production continued to be partially supported by firms’ efforts to tackle backlogs of work. June survey data indicated another steep reduction in the volume of orders pending completion, with the rate of depletion accelerating to the quickest in just over three years. Amid falling workloads, factory staffing levels were reduced across the euro area during June for the first time since January 2021.
Stronger declines in key barometers of business conditions such as new orders and output clearly affected firms’ confidence in the outlook during June. Expectations, while still positive on balance, were at their most subdued in seven months.
Subsequently, eurozone factories ramped up their destocking activity at the end of the second quarter. Input purchasing fell at a substantial pace that was among the fastest in 26 years of data collection. The volume of pre-production items stocked in warehouses declined for a fifth month in a row, while firms registered the quickest drop in inventories of finished goods since April 2022.
Supply conditions remained favourable for buyers during June, as signalled by another strong improvement in delivery times. The latest survey data pointed to a further steep reduction in average input prices paid by eurozone manufacturers. In fact, June’s decrease in factory costs was the fastest since July 2009. Market groups data revealed an especially steep drop in operating expenses at intermediate goods producers. With cost burdens easing and falling demand causing competitive pressures to rise, prices charged for goods across the euro area declined for a second successive month. The decrease was the strongest in three years.

China: Softer rise in manufacturing production in June
The headline seasonally adjusted Purchasing Managers’ Index™ (PMI™) remained above the neutral 50.0 level at 50.5 in June, signalling a back-to-back improvement in the health of the sector. That said, the reading was down from 50.9 in May and indicative of only a marginal improvement that was below the series trend.
After rising at the quickest rate in 11 months in May, Chinese manufacturing output expanded only slightly in June. Where production increased, companies often linked this to firmer demand conditions and greater intakes of new work.
Total new business expanded modestly in June, with the pace of growth slowing slightly from May. Data suggested that the upturn was largely driven by improved domestic sales, as new export business was broadly unchanged. There were a number of reports that relatively weak global economic conditions had dampened foreign demand.
Nevertheless, the back-to-back rise in total new order volumes led companies to expand their purchasing activity again in June. This in turn contributed to a further increase in inventories of inputs, though the rate of accumulation was only marginal. However, stocks of finished items fell slightly again.
Manufacturers in China maintained a cautious approach to employment, which fell for the fourth month in a row. The modest reduction in headcounts was often attributed to muted sales growth and efforts to readjust capacities. Moreover, firms signalled little pressure on current production schedules, with backlogs of work rising only slightly in June.
Companies registered quicker delivery times for inputs again at the end of the second quarter, albeit with the rate of improvement remaining marginal. Faster lead times were often linked to the increased availability of raw materials.
The improved supply situation and softer than expected demand placed further downward pressure on prices. Notably, input costs fell at a solid pace that was the quickest seen since January 2016. Panel members widely cited lower costs for raw materials, including steel, cement, food and oil. However, increased market competition and efforts to boost sales led firms to generally pass on cost savings to clients through reduced selling prices.
When assessing the 12-month outlook for output, companies were generally optimistic in June amid hopes of stronger economic conditions and improved sales. That said, the degree of positive sentiment edged down to an eight month low, as some firms expressed concerns over relatively sluggish market conditions.


Japan: Renewed deterioration in manufacturing operating conditions in June
At 49.8 in June, the headline au Jibun Bank Japan Manufacturing Purchasing Managers’ Index™ (PMI) dipped from 50.6 in May, indicating a fractional deterioration in the health of the sector. Production levels fell for the eleventh time in the past year during June, commonly associated with falling new orders and a lack of suitable staff. The rate of decline was only modest, however.
New orders also fell back into contraction during June, albeit only fractionally. Panel members often mentioned a lull in demand for manufactured goods, notably for semiconductors and electronics. This extended to export orders, which fell for the sixteenth successive month in June and at the fastest pace since February amid weak demand from mainland China especially.
In response to weaker operating conditions, buying activity fell for the eleventh month in a row at the end of the second quarter amid production cutbacks at Japanese manufacturers. That said, the reduction was the joint-softest recorded this year. Firms noted that vendor performance had continued to improve, as suppliers’ delivery times shortened to the greatest degree since March 2016.
Firms looked to hold on to inventories of both pre-production goods and finished items, in order to prepare for the eventual recovery in demand. June data signalled that high raw material, energy and labour costs placed sustained pressure on average operating expenses at Japanese goods producers as input costs rose for the thirty-seventh month running. While marked, the rate of inflation slowed from May and was the softest recorded since February 2021. This translated to output charges, which rose at a sharp pace that was nonetheless the slowest for 21 months.
Manufacturers also commented that a lack of demand had enabled firms to work through and complete existing orders, as evidenced by a sustained fall in outstanding business. The pace of reduction was little-changed from May and moderate overall. At the same time, firms raised employment levels at the second-fastest pace in the year to date. Anecdotal evidence suggested that a number of
temporary and part-time workers were taken on in June.Business confidence regarding activity over the coming year strengthened in the latest survey period, pushing the overall degree of positive sentiment to the strongest since October 2021. Firms cited hopes that sales would be boosted by a broad-based economic recovery and the dissipation of the impacts of the conflict in Ukraine as well as semiconductor market improvements.

The J.P.Morgan Global Manufacturing PMI™ posted 48.8 in June, a six-month low and down from 49.6 in May. The PMI has signalled a worsening in operating conditions for ten consecutive months.
The main factor underlying lower production was a further contraction in new order intakes, which fell for the twelfth successive month.
International trade flows remained especially weak, as new export business contracted for the sixteenth successive month. The rate of decline accelerated to the strongest in six months, with reductions signalled in the US, euro area, Japan, South Korea and Brazil (among others), while mainland China saw only a negligible increase.
Average selling prices also posted back-to-back decreases in May and June.


The vast majority of goods consumed in the U.S. are imported. Americans’ covid splurge on goods peaked in March 2021, 20% above pre-pandemic levels in volume. Goods imports (black) jumped 22% but peaked later in Q1’22 due to delayed shipments. Since then, U.S. goods consumption and imports have stalled though still 16-18% above pre-covid levels. Canada has been a prime beneficiary but appears very vulnerable:

Manufacturing is only 10.7% of U.S. GDP (Canada 9%), but 16% for the world, including 27% in China, 20-25% in South East Asia, 19% in Germany and 18% in Mexico.
But manufacturing feeds many services such as banking, logistics, transportation, trade, etc., so the question is how long can the manufacturing recession last before it begins to also meaningfully impact services?
In 2007-08, aggregate hours worked in manufacturing declined 3.6% before services peaked. Aggregate manufacturing hours peaked in January 2023 and are down 1.0% since, all of the decline stemming from reduced weekly hours amid flat employment. Weekly hours are now at their lowest levels since 2010 (ex-pandemic). Services are up 0.2% during that time with employment up 1.1% and weekly hours down 1.0% to their normal level.
Aggregate Hours Worked, Manufacturing & Services

Since average weekly hours are now back to their pre-pandemic levels in both goods and service-providing industries (and both at the low end of their 2010-19 range), the risk is rising that actual employment starts declining.
Based on the June PMIs, this is not happening just yet:
- manufacturing “employment growth was modest overall, and softer than in May”;
- “Services firms continued to hire amid greater new orders. That said, the rate of job creation eased to the weakest since January amid challenges replacing voluntary leavers.”
UPS Drivers Head Toward Possible Strike After Labor Talks Fail
(…) The current labor contract — the largest private-sector union agreement in the US with 330,000 workers — expires at the end of July, but labor leaders have said they need a few weeks to educate their members and persuade them to ratify it. Union employees will not work beyond July 31 when the current contract expires, Deniz said, and no more bargaining sessions are scheduled. (…)
Full-time delivery drivers make $95,000 a year, and tractor trailer drivers typically make six figures, according to UPS. But the Teamsters say wages haven’t kept up with the profits the company raked in during the Covid-19 pandemic — or matched the risk workers faced to deliver packages. (…)
- Union seeks $8,000 ‘inflation adjustment’ for B.C. port workers on strike International Longshore & Warehouse Union Canada seeking signing bonus in addition to wage increases of 11 per cent in first year and 6 per cent in the second year
- Labor costs are the main source of inflation (The Transcript)
“While certain commodity spot prices are down from their highs, we continue to see labor as the main source of ongoing inflation, showing up in our suppliers’ conversion costs, at our copackers’ facilities, in our own plants, and downstream in our warehousing and logistics network.” – General Mills (GIS ) CEO Jeff Harmening
“Going forward, we do expect additional headwinds from wage inflation in a generally tight labor market, particularly for manufacturing workers. Wages in key geographic regions, particularly in Mexico, continue to increase, while availability remains constrained” – Lear Corporation (LEA ) Senior VP & CFO Jason M. Cardew
China Services Growth Softens in Fresh Sign of Weakness
The Caixin China services purchasing managers’ index declined to 53.9 from 57.1 in May, Caixin and S&P Global said in a statement Wednesday, the weakest since January and well below the median forecast of 56.2 among economists surveyed by Bloomberg. Any reading over 50 indicates an expansion from the prior month, while a number below that suggests contraction. (…)
Domestic travel spending during the recent holiday for the dragon-boat festival was lower than pre-pandemic levels. Home sales figures are below the level in previous years, while estimates for June car sales showed a drop from a year ago. (…)

More from the Caixin report:
Although total new business continued to expand at the end of the second quarter, the rate of growth moderated to a six-month low and was modest overall. New export business meanwhile expanded solidly, despite the rate of increase edging down to the softest since January. There were a number of reports that the sector continued to benefit from a revival in tourism and travel since the easing of pandemic restrictions. (…)
Services companies in China signalled a solid rise in average input costs at the end of the second quarter, with the rate of inflation little changed from that seen in May. Where higher operating expenses were reported, businesses generally attributed this to rising staff costs and greater raw material prices.
Although input prices rose solidly, prices charged by service providers rose only slightly in June. While some companies mentioned raising their fees to reflect higher operating expenses, others indicated that efforts to remain competitive had limited their overall pricing power.

Defaulted developer Shimao Group Holdings Ltd. failed to find a buyer for a $1.8 billion project at a forced auction, even at a heavy discount. Sino-Ocean Group Holding Ltd. saw its bonds tumble on news that the state-backed builder told some creditors it’s been working with two major shareholders on its debt load.
They’re the latest indications that China’s two-year real estate crisis is likely to remain one of the biggest drags on the world’s second-largest economy. A brief rebound after the nation scrapped Covid restrictions has quickly faded, with home sales resuming declines and property investment worsening — hurting markets ranging from iron ore to high-yield bonds. (…)
The nation’s second-largest developer by sales, China Vanke Co., said last week that the home market is “worse than expected,” joining a chorus of investors and analysts who have become bearish on the sector. (…)
“Investors are concerned not only about credit risk on individual names now, but also about the sector as whole as the restructuring process remains slow,” UBP’s Nip said.
Markets Ignore the Looming Debt Peril Rates are still rising. The economy will be held back by the need to shore up highly indebted companies.
(…) The CCC-rated borrowers closest to default have returned 10% this year. The worst performing are safe investment-grade borrowers, with AA-rated corporate bonds returning 2.7%.
For now, it is only among smaller companies that shareholders seem to care. Just as junk-bond investors like the trashiest investments, big stocks with the weakest balance sheets—measured using economist Robert Merton’s distance-to-default scores—are beating those with stronger balance sheets, according to an analysis by Andrew Lapthorne, head of quantitative research at Société Générale. (…)
The weakest borrowers benefited because the most-widely-forecast recession in history simply refused to arrive. The creditworthy didn’t gain much because the Federal Reserve will keep rates higher for longer as a result. In investment-management-speak, credit risk has done well, while interest-rate risk has done badly. (…)
Interest rates may yet prove to have teeth.
If you missed that last week:
 Worth listening to: Conversations – This Time Might Be Different with Howard Marks and David Rosenberg
Howard Marks (Co-Chairman) and David Rosenberg (Co-Portfolio Manager, U.S. High Yield, Global High Yield, Global Credit) discuss topics from the June 2023 edition of The Roundup. They consider the evolution of the high yield bond market, investor optimism, and why this time might actually be different in financial markets.
This chart will help you visualize what David calls the coming reckoning. Floating rate debt now costs 550bps more than in 2021. Fixed rate debt is being renewed at double its pre-2022 cost. The hit on cashflow will only keep growing through 2025.

Since U.S. nonfinancial corporate debt reached $12.7T as of Q1’23, a 550bps incremental cost would reduce annualized cashflow by $636B or $500B after tax, a 16% setback on total corporate cashflow and 20% on corporate profits.
Smart Charts
Via Callum Thomas:
- All Well And Good: So if we take October 2022 as the low, while the headline market cap weighted S&P500 has done decent (+24%) the equal-weighted version has way undershot (+17%) (and Nasdaq way overshot (+41%), more on that in a minute), but it’s also undershot vs previous and typical bear market recoveries. Bull market for some, bore market for others.

Source: @WarrenPies
- It really is just a case of big tech carrying the market, if we look at the percentage of Nasdaq stocks with negative earnings, it has just reached a new all-time high. If you argue that it is a fundamental driven rally, it ain’t showing up in the numbers (at least not yet?).

Source: @_rob_anderson
- This chart is interesting because in one sense it looks like the real yields narrative has broken and things have decoupled, in another sense it kind of displays just how AI hype is now in control. But it also shows how valuations have gone back to expensive levels, and how the bond market may still get the last word on this whole thing.

Source: @EquitOrr
- Interesting thing implied by this chart is that previous Fed-hiking-cycle-triggered bear markets basically needed the Fed to switch to cuts to get back to bull… and not only have we not had that yet, but the Fed insists that no cuts are happening any time soon. Which begs the question of whether AI hype is enough to offset Fed hiking (or even whether it’s setting up for a harder landing).

Source: @callieabost
- This chart raises an interesting point — “Household equity exposure peaked (at a new all-time high) in Q4 2021 and has since pulled back. Similar peaks in the late 60’s and late 90’s were followed by lost decades for stocks.“ Now, to be fair, those periods could be described as nothing remotely boring, but the point is rather than getting a sustained period up or down, a sustained long-term and large range-trade is also an option. Which is great if you can navigate the ups and downs (but perhaps trickier for buy-and-holders).

Source: @WillieDelwiche at Hi Mount Research
This is one of the most important charts you will see as it is extremely helpful in providing a glimpse into what to expect over the next decade for US equity prices and other major asset classes. (…)
Given the tightness of fit for these two lines (note the correlation figure in the top left-hand corner of the chart), I have created a model to project forward returns for the S&P 500 Index (see chart below).
The current “Average Investor Allocation to Equities” figure is 46.23% as of March 31, 2023 (our most recent update). This corresponds to a projected annualized return of -0.07% over the next 10 years for the S&P 500 Index. (…)
The following chart is the same as the first chart in this article but I have added a few elements to it.
I have segmented the chart into three sections. Each section represents a full cycle of the “Average Investor Allocation to Equities” cycle. Note that the first two cycles took 29 years and 27 years, respectively. I used an average of the first two cycles to suggest that this current cycle may take 28 years in total. For the record, it could be longer or shorter, this is simply an educated guess based on the last two cycles.
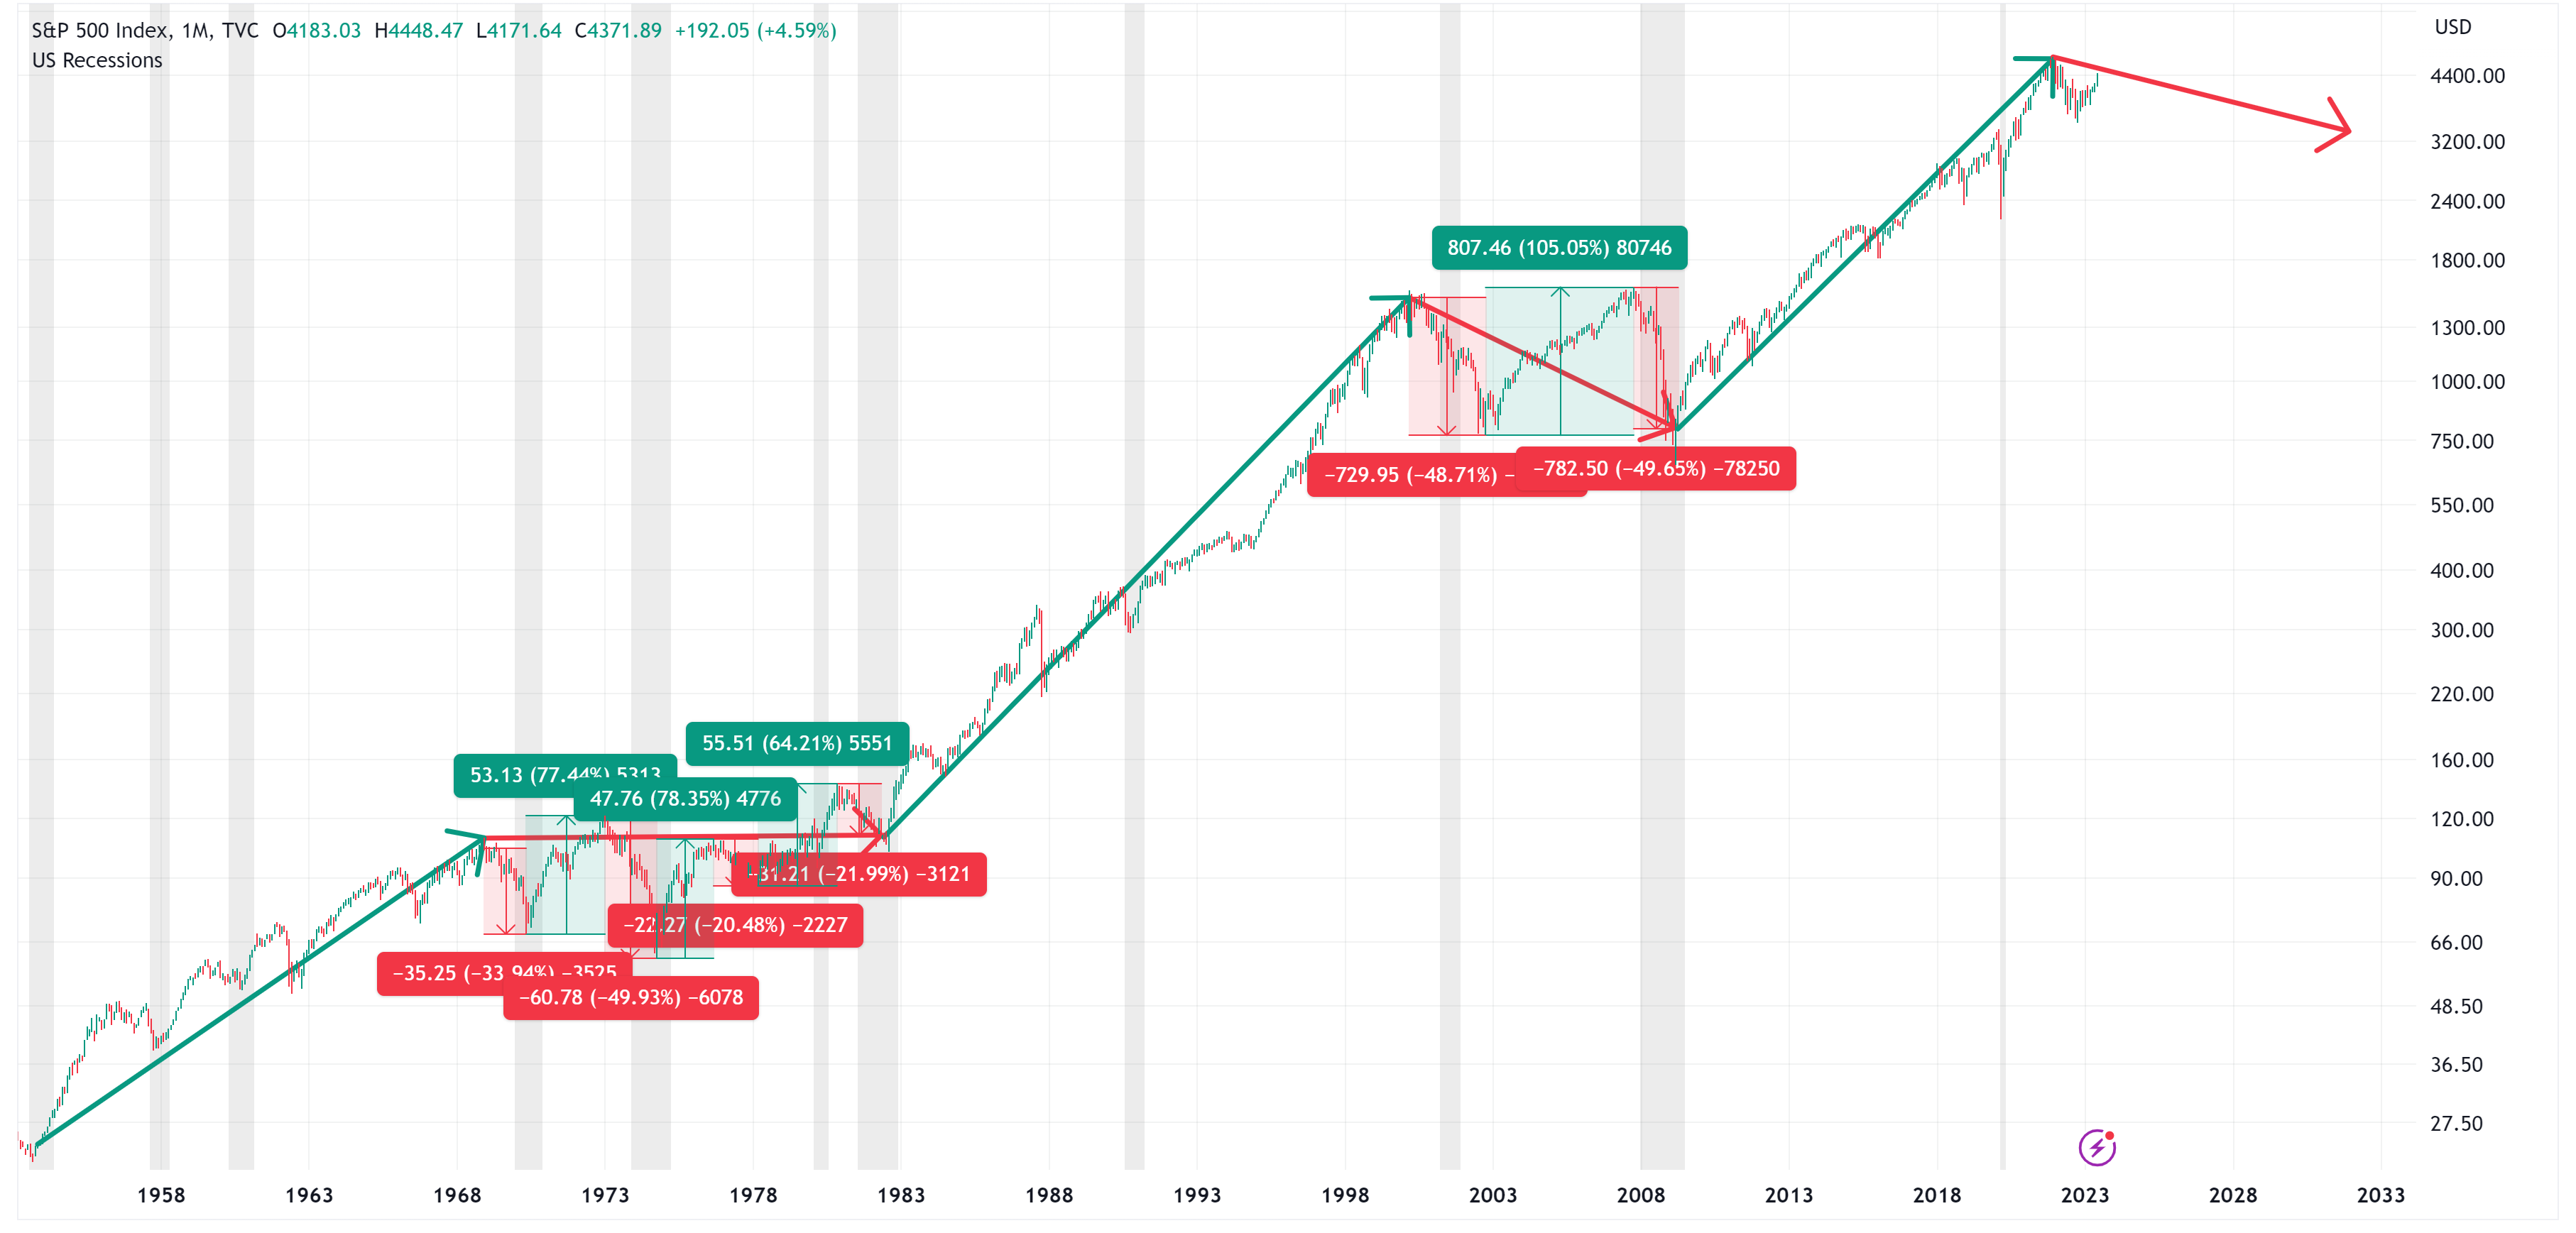
The key takeaway here is not the length of the cycle but to understand where you are in the cycle. The first half (“green arrows”) of the cycle is typically associated with rising equity prices as the equity allocation in an investor’s portfolio steadily increases. Alternatively, the second half (“red arrows”) is typically associated with lower equity prices and increased volatility as the equity allocation in an investor’s portfolio steadily declines.
When we translate the above logic/metrics to the S&P 500 Index, we get the following chart. The “green arrows” below are the first half of the cycle, and the “red arrows” are the second half of the cycle. (…)
We are currently in the back half or “red arrow” portion of the current cycle. As noted above, this would suggest that we should expect the following market/economic conditions over the next decade: 1) increased market volatility, 2) sideways to lower returns for the S&P 500 Index, and 3) a recession or two.
To get a bit more specific with regard to the S&P 500 Index and where it may be headed, I have created a “fair value” model. Here are the model results plotted against actual results. While no model is perfect, an R-Squared value of 0.81 is pretty decent.
When we take the results of the model and plot them against the S&P 500 Index and into the future, we get the following chart.
The model suggests that the fair value for the S&P 500 Index is currently 2,567. Compare this figure to the current value for the S&P 500 Index (4,365) and this would suggest that the S&P 500 Index would need to decline by approximately -41% to reach fair value.
While this may seem like a large decline (and it is), it’s not unprecedented. Note the four highlighted areas on the chart (yellow circles). These circles represent the point at which the S&P 500 Index reached its fair value after having been severely extended like we are today.
In two of these instances, the S&P 500 Index would go on to decline well through the fair value line. In the other two instances, the decline stopped at the fair value line.
The average peak-to-trough decline in these four episodes was -39% with two of these episodes registering declines greater than -50%.
(…) we can make a couple observations.
First, in each of the four highlighted scenarios outlined above, the market fell to or through the fair value line. With that said, we should expect the S&P 500 Index to decline to its fair value line at some point in this cycle.
Second, in all four instances, the market bottom was not reached until our Z-score metric (grey histogram in the chart) reached a value between -3.0 to -4.0. In the chart below, I have highlighted with red circles when this occurred. As a point of reference, the current Z-score is +1.23 so we have a ways to go. (…)


It Isn’t Just Boomers. Lots of Older Americans Are Stock Obsessed. At Vanguard, one-fifth of taxable brokerage account investors aged 85 or older have nearly all their money in stocks.
(…) Nearly half of Vanguard 401(k) investors actively managing their money and over age 55 held more than 70% of their portfolios in stocks. In 2011, 38% did so. At Fidelity Investments, nearly four in 10 investors ages 65 to 69 hold about two-thirds or more of their portfolios in stocks.
And it isn’t just baby boomers. In taxable brokerage accounts at Vanguard, one-fifth of investors 85 or older have nearly all their money in stocks, up from 16% in 2012. The same is true of almost a quarter of those ages 75 to 84. (…)


