US consumer spending flattens; core inflation still hot
(…) The unchanged reading in consumer spending last month, reported by the Commerce Department, followed a downwardly revised 0.1% gain in February. Consumer spending, which accounts for more than two-thirds of U.S. economic activity, was previously reported to have increased 0.2% in February.
Spending on services rose 0.4%, driven by housing and utilities as well as healthcare. Goods outlays fell 0.6% as purchases of motor vehicles, mostly new light trucks, decreased. Lower gasoline prices also contributed to the decline in goods spending. Economists polled by Reuters had forecast consumer spending dipping 0.1%. (…)
Last month’s flat reading in consumer spending set consumption and the overall economy on a lower growth path in the second quarter. (…)
A temporary boost to the Supplemental Nutrition Assistance Program (SNAP) benefits authorized by the U.S. Congress to cushion low-income people and families against the hardships of the COVID-19 pandemic expired in March.
SNAP is commonly known as food stamps. Researchers from the Commerce Department’s Census Bureau on Thursday estimated the end of the extra benefits had resulted in roughly 32 million people getting smaller monthly SNAP payments. They estimated that a household of four with a net monthly income of $2,000 was now getting $600 less in food stamps each month. (…)
The personal consumption expenditures (PCE) price index gained 0.1% in March, the smallest increase since last July, after rising 0.3% in February. In the 12 months through March, the PCE price index increased 4.2%. That was the smallest advance since May 2021 and followed a 5.1% rise in February.
Excluding the volatile food and energy components, the PCE price index rose 0.3%, matching February’s gain. The so-called core PCE price index gained 4.6% on a year-on-year basis in March after rising 4.7% in February. The Fed tracks the PCE price indexes for its 2% inflation target.
Economists estimated that core services excluding housing, being closely watched by policymakers, increased 0.2%. The smallest gain since last July followed a 0.3% rise in February, and reflected a drop in portfolio management fees. (…)
Solid wage gains are helping to support personal income, offseting the drag from declining government benefits like food stamps. Income rose 0.3%, matching February’s increase.
The saving rate jumped to 5.1%, the highest since December 2021, from 4.8% in February, boosted by a plunge in tax payments in January as well as fears of a recession. (…)
The historically tight relationship between labor income (aggregate payrolls) and total spending has returned post pandemic effects. In March, the 6.2% YoY growth in spending perfectly matched labor income growth. But satiated demand for goods is showing in retail sales up only 2.3% YoY in March from +7.4% in January.

Labor income got a 0.9% MoM boost in January due to start of the year increases in minimum wages, inflation adjustments and warm weather (e.g. construction) but February and March were both +0.3% or 3.6% annualized.

Wages and salaries, up 6.1% YoY largely thanks to the January bump, are thus set to decelerate rapidly in coming months/quarters unless employment growth picks up from its slow +0.15% monthly March pace.
Personal income taxes have declined every month since October 2022, and very sharply in January (one-time tax relief and credits from state and local governments), boosting disposable income, quickly spent in the same month. During the last 6 months, personal income grew 2.8% or 5.7% annualized but after tax disposable income exploded 5.1% or 10.5% annualized!
No wonder rising inflation and interest rates have had so little impact on consumption.
As these “anomalies” normalize, growth in labor income will prevail again, like it did in March, as the main determinant of consumption growth. Fortunately, inflation has also been slowing down:

From Visa conf. call:
In March, payments volume growth ticked down and has remained at similar growth levels through the first 3 weeks of April. The primary driver of the tick down in the growth rate has been U.S. ticket size, while transaction growth remains in line with Q1 levels at around 8%. Ticket size was up over 1% year-over-year in the first quarter and is down about 2% in March through April 21. Ticket sizes are declining as inflation moderates.
The latest PCE inflation data are encouraging. Core PCE rose 0.31% in both February and March, lower than the +0.41% average of the previous 6 months.
![]()

Importantly, services inflation slowed from +0.6% in each of December and January to +0.4% in February and +0.2% in March.
A “data-dependent Fed” will thus be debating slowly improving inflation data amid strong consumer demand in Q1 overall, but weakening fundamentals as the quarter progressed.
With a potential banking crisis seemingly averted, another 25bps ratchet is likely this week with wording suggesting a possible pause in June. The chart below shows changes in bi-weekly loans and leases up to last Friday.

The National Association of Credit Managers produces its own index of credit conditions as assessed by corporate credit managers. Members of NACM are credit and financial executives, primarily representing manufacturers, wholesalers, financial institutions and varied service organizations. A sort of PMI but from the credit managers’ perspectives. The latest survey was conducted during the last two weeks of March. Encouraging…

…until you notice that rejections of new credit applications recently abruptly slid to 47.9, “its lowest level since July 2009 during the great recession and financial crisis.”
(…) the steep deterioration in approvals of new credit applications is disheartening. Several respondents indicated that they are having to work with customers having cash flow problems due to capital being tied up in inventories, which requires them to be flexible on terms. But that can only go on so long, as these firms also have obligations that must be met.”
The credit crunch is affecting manufacturers a bit, but the amount of credit extended is still robust. For now, manufacturers seem to have avoided problems with credit availability. (…)
However, the sharp pull back in approvals of new credit applications [from service providers] is worrying. Customers are still seeking new credit, and the amount of credit extended is still very sound. But if you need credit, getting a new line approved is proving quite tough.


Ed Yardeni: “The members of the FOMC could still make a mess of the situation by continuing to vote to tighten monetary policy.”
This next piece is about monetary lags, from Bridgewater:
The Tightening Cycle Is Beginning to Bite
The tightening cycle began roughly one year ago. It takes about that long for a tightening to have significant economic impacts, and signs are emerging that the effects are now spreading and deepening. Damage to the banking system is a manifestation of the tightening and is now likely to be a contributor. Economies rely on the steady flow of liquidity from cash and credit to assets and spending. This liquidity pipeline runs from the central bank as the originator, through the financial system as an intermediary, to the markets, and finally to spending and income.
The combination of central banks raising interest rates and draining reserves with banks experiencing more constrained deposit and capital conditions and now tightening credit standards is very likely to constrain the flow of money and credit to markets and the economy, with impacts on spending and income. Manifestations of this are now showing up in the data. (…)
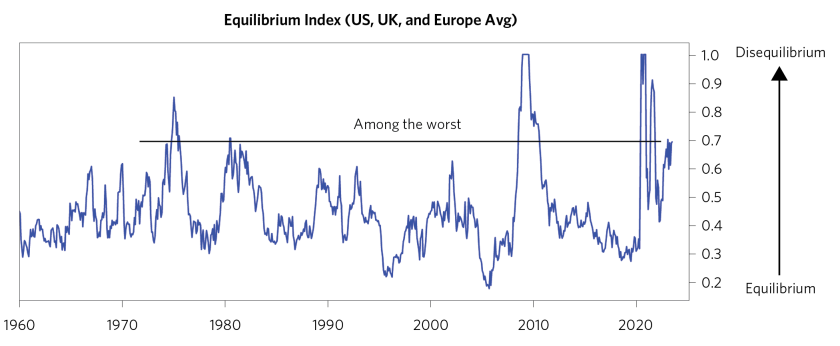
The closer an economy is to equilibrium, the easier it is to fix problems and the lower the volatility of markets. The further an economy is from equilibrium, the bigger the policy moves required to fix problems and the higher the market volatility. Within our systems, we measure the degree to which an economy is near or far away from equilibrium and connect that to the policy responses and the market movements that normally result. (…) the greatest disruption of equilibrium today remains the high level of nominal spending, which, when compared to the ability of the economy to produce more, leads to inflation rates that are significantly above target.
Aggregating a number of indicators of equilibrium conditions, the following chart shows the degree to which the US, Europe, and the UK have veered away from equilibrium. These economies remain quite far from equilibrium for similar reasons, and this is leading to big policy shifts and high market volatility. Furthermore, despite aggressive policy action, they have not moved much closer to equilibrium. On the margin, the nature of the disequilibrium has shifted from too much inflation to not enough growth, with the risk premiums on assets falling relative to cash.
In Japan and China, because spending is more aligned with labor output, inflation is under control, giving policy makers room to support economies and markets.
The path from disequilibrium to equilibrium allows for big swings in markets, which can be in either direction, so this is not a good short-term timing measure. But it is a frame of reference for longer-term positioning that has a good track record.
For example, the following table shows the average returns of assets across various stages, divided into bullish disequilibriums, which typically lead to stimulative policies that are supportive to assets; bearish disequilibriums, which generally require tighter policies and are bad for assets; and near-equilibrium conditions, where volatility is lower and you are likely to earn a normal risk premium on assets held.
*All asset returns scaled to 10% volatility
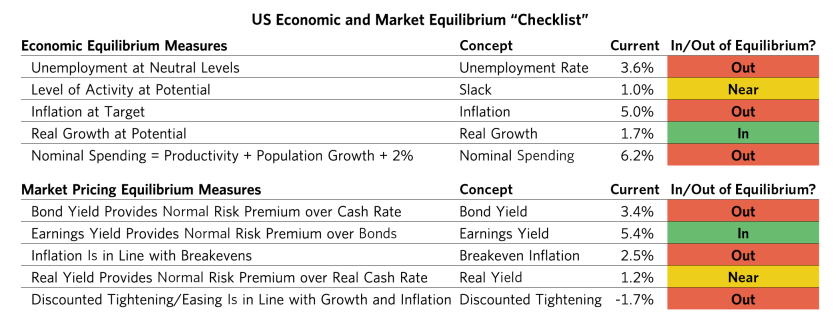
Taking a look at why we are now in the bearish disequilibrium, the following table summarizes a few key measures for the US economy.
With respect to the economy,
- the inflation rate is too high, the rate of nominal spending is too high to bring that down,
- the rate of unemployment is too low to bring wages down,
- and despite nominal growth being too high, the real growth rate is lower than desired.
Of course, a weaker real growth rate is required to resolve the other imbalances, but that is a form of disequilibrium on its own, illustrating the challenge of having to create one disequilibrium in order to resolve another, and then iterating back and forth as policy makers try to bring all of them in line.
With respect to the markets,
- bond yields are too low in relation to cash and discounted inflation rates are well below current and projected inflation rates, so there is no risk premium in bonds.
- There is a roughly normal risk premium in equities relative to bonds based on current earnings and the current bond yield. But if you get a recession as needed to get the desired inflation rate, earnings would be about 20% lower, making the earnings yield too low in relation to bonds at the same time as the bond yield is too low in relation to cash.
In other words, in order to deal with today’s economic disequilibriums, central banks are having to make cash very attractive, which is making bonds and stocks unattractive in relation to cash. At the same time, nominal spending is too high and the labor markets are too tight to allow for the easing of policy that is priced into the front of the yield curve, which is the easing that would be necessary to provide for a normal risk premium in bonds.
When you add up this picture, you can see why the degree of disequilibrium is so high and why we favor cash in relation to assets in most developed economies until these imbalances are closer to being resolved. On the other hand, we favor assets in relation to cash in Japan, China, and much of Asia because they are either closer to equilibrium or are in disequilibriums that favor an expansion of liquidity that makes cash unattractive in relation to assets.
As described in previous research, we outlined what we see as the path to equilibrium:
- In order to have a sustainable 2% inflation rate at a 2% real growth rate, you need wage growth to fall to around 2.5%.
- To reduce wage inflation, you need to cut nominal spending and income growth in half to 3-5% and raise the unemployment rate by 2% or more (P=$/Q).
- To raise the unemployment rate, you need to drive nominal GDP growth materially below wage growth, compressing profit margins enough to produce about a 20% decline in earnings.
- Then central banks need to remain restrictive for about 18 months, until 2% wage growth is achieved.
- Then they can restore a normal yield curve and risk premium in bonds by cutting short-term interest rates to about 1% below bond yields.
Updating that picture, what has happened is that we have moved incrementally in the direction of an economic contraction with a slight moderation in inflation. The cracks in the banking system are a move in that direction and are a direct result of the aggressive easing and then aggressive tightening of monetary policy. (…)
We are also seeing the first signs of a rise in savings rates that would be more consistent with the past year’s rise in interest rates and weakening of asset markets. This month’s ISM survey was the first that showed both a weakening of orders and a weakening in employment. The JOLTS figures also showed a drop in job openings. And business loan demand has collapsed. These are all signs that the tightening is passing through to the economy. This raises the odds of a pause in the tightening cycle, but at the cost of a decline in earnings and a rise in risk premiums.
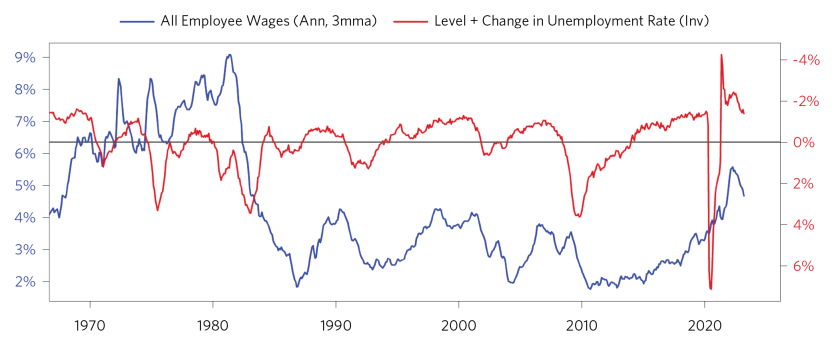
It takes big moves over a sustained period of time to restore equilibriums once they have deviated substantially from desired levels. (…) Broad inflation and the wage inflation around which it is anchored have moderated a bit, but both remain significantly elevated relative to equilibrium levels. (…)
Wages are simply a price set by the supply and demand of labor. The supply/demand balance today does not resemble the conditions that led to past wage declines. (…)
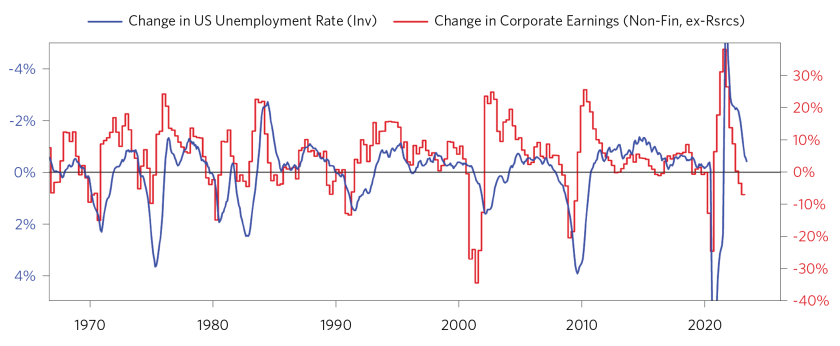
Looking directly at corporate profits shows a bit more progress toward equilibrium, but we estimate corporate profits need to fall roughly 20% and are currently down a bit less than 10%. More pain is needed to raise unemployment, reduce wages, and moderate inflation.
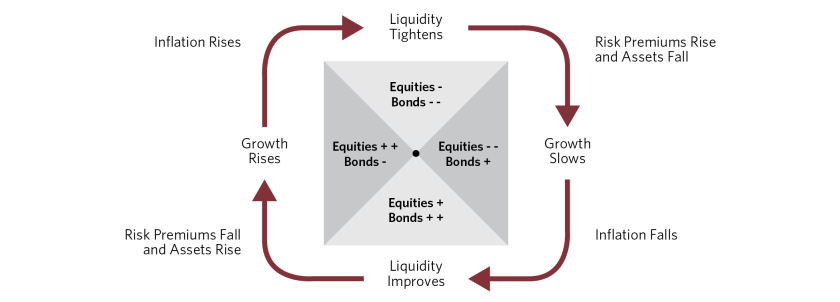
(…) across most of the developed economies of the West, tightenings of monetary policy have reversed the flow of liquidity and driven money from assets to cash. That tightening has driven up discount rates (i.e., the discounted real yield of cash) but so far hasn’t had much impact on risk premiums or growth. That is likely what comes next. In contrast, Japan, China, and much of the East are in the opposite stage of the cycle where policy makers are supporting the flow of money and credit, which lowers discount rates and risk premiums and supports growth.
Relating the liquidity cycle to asset returns, in the West, the coming stage is bad for stocks and less bad for bonds than where we’ve been.
(…) Given the next stage of the cycle, a weakening of the US economy will make US assets less attractive, particularly if the Fed pauses or eases while Asian economies recover and the ECB continues to tighten monetary policy to catch up. So, the dollar is vulnerable as relative conditions and policies
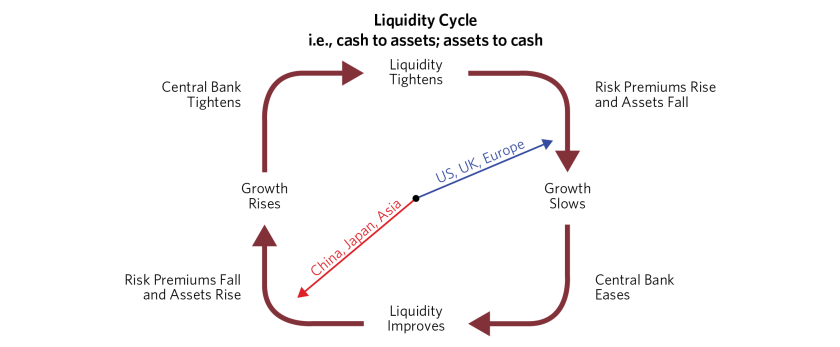
Richard Bernstein Advisors may not agree with Bridgewater’s statement that Japan, China “and much of the East policy makers are supporting the flow of money and credit”. Yield curve inversions are more widespread than in 2009 and 2000.
Table 1 shows the performance of Regional Bank stocks during the 3, 6, and 12 months after the yield curve has historically inverted. The stocks perform relatively well over the subsequent 3 and 6 months because business remains strong. However, by 12 months after inversion, the excessive risk taking begins to affect the bank stocks and they generally underperform.
In fact, Regional Bank stocks tend to underperform 75% of the time during the 12-month periods after the yield curve inverts. Because the yield curve inverted in July 2022, the recent underperformance of the Regional Banks seems to fit the historical norm.
Profits and liquidity fundamentals are still deteriorating, but investors seem aware. (…) According to [the Bank of America Global Fund Managers Survey], fund managers’ portfolios are underweighted bank stocks more than any other group, and they now view a bank credit crunch as the biggest tail risk.
This suggests that the risks are well known. If fundamentals do improve, then it could imply a stronger weight in the sector might be appropriate. For the time being, however, we feel comfortable with our sizable underweight.

North American non-financial corporate rating downgrades continue to exceed upgrades, a trend that began late last year, says Fitch Ratings. Most of the downgrades over the past three months were in non-investment grade rating categories, with the downgrade-to-upgrade ratio for these companies at 1.7x during 1Q23, compared to 1.0x for our portfolio of publicly-rated investment issuers and 1.5x for all publicly-rated issuers included in our universe.
Technology, Media and Telecommunications, Utilities, Retail and Consumer sectors led our downgrade activity while Industrials, Utilities and Natural Resources sectors experienced the most upgrades.
Downgrades were primarily driven by changes in financial profiles due to factors such as increased or expectations of higher leverage, changes in capital structure or reduced financial flexibility. Bankruptcy filings and M&A also drove downgrades in the quarter.
The distribution of Rating Outlooks for North American corporates is 11% Negative, 8% Positive and 79% Stable. Additionally, as highlighted in Fitch’s Global Corporates Macro and Sector Forecast – March 2023 data file, 77% of issuers have headroom in 2023 leverage metrics. This should help mitigate the risk of widespread downgrades if slower yoy economic growth pressures operating performance and results in higher leverage. Fitch’s March 2023 U.S. real GDP forecast is 1.0%, down from 2.1% in 2022 and 5.9% in 2021, with expectations of a recession in late 3Q23.

Americans Go Hungry, Economic Growth Under Pressure as SNAP Benefits Expire
About 8 million Americans that received enhanced food-assistance benefits have been going hungry ever since the program ended earlier this year. It’s also hitting economic growth. (…)
A family of four with an income of $2,000 per month now gets $340 on average in Supplemental Nutrition Assistance Program benefits each month — $600 less than before the expiration. According to economists at Morgan Stanley, the impact is already visible in the latest figures on gross domestic product for the first quarter.
“Consumption was weak late in the quarter due to a drop in SNAP benefits in March, as well as warmer weather pulling consumption activity forward,” Morgan Stanley economists led by Ellen Zentner wrote in a note Thursday, following the release of a Commerce Department report showing GDP growth slowed to 1.1% annualized over the last three months.
“The loss of benefits will carry on” into the second quarter, “and is expected to weigh on consumption,” they said.
The Morgan Stanley team estimates that the expiration of benefits resulted in a hit to disposable income as large as $4 billion from February to March, or $50 billion annualized. They also see the end of Covid-era stimulus translating into a significant drag on disposable income in the second quarter, resulting in a decline in overall consumer spending. (…)
A rising number of Americans are now turning to credit cards and less regulated types of financing to make ends meet as pandemic-era benefits get lifted one after another.
Apartment Market Continues to Loosen, Transactions Pull Back Further Amidst Economic Uncertainty
Apartment market conditions continued to weaken in the National Multifamily Housing Council’s (NMHC) Quarterly Survey of Apartment Market Conditions for April 2023, as the Market Tightness (31), Sales Volume (26), Equity Financing (23), and Debt Financing (29) indexes all came in well below the breakeven level (50).
“Apartment operators reported an uptick in vacancies and concessions this quarter,” noted NMHC’s Vice President of Research Caitlin Sugrue Walter. “And while some of this softness can be attributed to seasonality, investors remain concerned about the coming wave of supply in some markets and the prospect of slower economic growth in 2023. Only 11% of Quarterly Survey respondents believe that the Fed will be able to achieve a soft landing this year in its effort to rein in inflation.
“The transaction market, meanwhile, remains at a virtual standstill, with current apartment owners unwilling to offer buyers the lower prices necessary to compensate for both this diminished economic outlook and the elevated cost of debt.”
- The Market Tightness Index came in at 31 this quarter—below the breakeven level (50)—indicating looser market conditions for the third consecutive quarter. More than half of respondents (51%) reported markets to be looser than three months ago, while only 14% thought markets have become tighter. Meanwhile, around a third of respondents (34%) thought that market conditions were unchanged over the past three months.
- The Sales Volume Index reading of 26 marked the fourth consecutive quarter of decreasing deal flow. Yet, while a majority of respondents (56%) reported lower sales volume, this is down from 82% of respondents who reported lower sales volume in January, 89% of respondents in October and 83% of respondents in July. Just 9% of respondents thought that volume was higher than three months ago, while 30% reported no change in volume.
Our national rent index increased by 0.5 percent over the course of April. This is the third straight monthly increase in rent prices, but represents a slight slowdown from last month at a time of year when growth is typically picking up steam. This month’s increase was also less than the typical April price change that we saw in pre-pandemic years. Even though prices are trending up again, a combination of sluggish demand and increasing supply is keeping rent growth in check.
Year-over-year rent growth is continuing to decelerate, and now stands at 1.7 percent, its lowest level since March 2021. Year-over-year growth is now below the average rate from 2018 to 2019 (2.8 percent), and it is likely to decline even further in the months ahead.
On the supply side, our vacancy index currently stands at 6.8 percent, surpassing the average pre-pandemic rate and continuing to trend upward. With a record number of multi-family apartment units currently under construction, some property owners may start struggling to fill vacancies for the first time since the early stages of the pandemic.


Keep in mind that this index tracks new leases, always much more volatile than renewed leases. Goldman Sachs says that “Outsized rent increases for continuing leases as they catch up to current market rates are likely to keep CPI and PCE shelter inflation elevated this year. We expect year-on-year PCE shelter inflation to fall from 8.3% currently to 5.8% in December 2023 and 4.4% in June 2024.
As to Apartment List’s vacancy index chart, it lacks from a longer term perspective. The red line is where Apartment List’s current reading stands:

EARNINGS WATCH
From Refinitiv/IBES
Through Apr. 28, 267 companies in the S&P 500 Index have reported earnings for Q1 2023. Of these companies, 77.9% reported earnings above analyst expectations and 17.2% reported earnings below analyst expectations. In a typical quarter (since 1994), 66% of companies beat estimates and 20% miss estimates. Over the past four quarters, 74% of companies beat the estimates and 22% missed estimates.
In aggregate, companies are reporting earnings that are 7.7% above estimates, which compares to a long-term (since 1994) average surprise factor of 4.1% and the average surprise factor over the prior four quarters of 4.2%.
Of these companies, 72.6% reported revenue above analyst expectations and 27.4% reported revenue below analyst expectations. In a typical quarter (since 2002), 62% of companies beat estimates and 38% miss estimates. Over the past four quarters, 71% of companies beat the estimates and 29% missed estimates.
In aggregate, companies are reporting revenues that are 1.5% above estimates, which compares to a long-term (since 2002) average surprise factor of 1.3% and the average surprise factor over the prior four quarters of 2.3%.
The estimated earnings growth rate for the S&P 500 for 23Q1 is -1.9% [was -4.7% last week]. If the energy sector is excluded, the growth rate declines to -3.5% [-6.1%].
The estimated revenue growth rate for the S&P 500 for 23Q1 is 2.3% [+1.9%]. If the energy sector is excluded, the growth rate improves to 3.0% [2.7%].
The estimated earnings growth rate for the S&P 500 for 23Q2 is -4.3% [-4.4%]. If the energy sector is excluded, the growth rate improves to 0.6% [0.5%].
The beats are impressive, particularly among consumer discretionary, energy and tech companies.
And particularly among larger companies where 61% were revised up last week against only 47% for non-S&P 500 companies.


Goldman Sachs: “So far 1Q is shaping up to actually be a bit better than usual. In addition to strong results from mega-cap Tech, we have also seen a better-than-feared if not outright strong earnings from the banks, airplane manufacturers, industrials more broadly, the airlines (for the most part), and even toy makers.”
Trailing EPS are now $218.68. Full year 2023: $220.03e ($219.58 last week). Forward 12-m: $225.91 ($225.86).
From Ed Yardeni:
Why has the stock market been holding up so well so far this year despite lots of pessimism about an impending recession? One possible explanation is that industry analysts are turning more optimistic on the earnings prospects of the companies they follow. We have been tracking the percent of S&P 500 companies with positive three-month percent changes in analysts’ consensus forward earnings (chart). (FYI: “Forward” earnings is the time-weighted average of analysts’ consensus estimates for the current and following years.) (…)

But: “It is all about the few mega caps leading the rally. Rest of the pack stays poor.” (The Market Ear)

GS
Speculation seems to have largely disappeared, ex crypto…

(Topdown charts)
Equity Bulls Count on Fed-Cycle Math That Worked For Decades Over eight previous monetary-tightening cycles, the S&P 500 ended up higher by an average 13% a year after the last interest-rate increase, per Strategas Securities.
![]() Beware of averages. While it is true that equities eventually tend to do well after Fed easing episodes, “eventually” is the key word here: most times, the Fed eases for “good” reasons. Equity markets are not always in sync with the FOMC and some lags have been very costly.
Beware of averages. While it is true that equities eventually tend to do well after Fed easing episodes, “eventually” is the key word here: most times, the Fed eases for “good” reasons. Equity markets are not always in sync with the FOMC and some lags have been very costly.
I found 15 “Fed changes of posture” since 1957.
- From the first pause to the market low, the S&P 500 troughed 9 months after, on average. But the range is -3 months to +31 months.
- From the first cut to the market low, the S&P 500 troughed 6 months after, on average. But the range is -3 months to +21 months.
Actually, since 1957, the S&P 500 declined after every Fed cut but five (1966, 1980, 1984, 1989, and 1995). Equities dropped between -4.0% to -47.7% (month end data) with an average of -16.1%. If we exclude 1974 (inflation) and 2001 and 2007 (bubbles), the average is -5.9% (range: 0.0% to -19.9%).
And I found no stable correlation with valuations, inflation and profit trends that could help decide when it might be safe to jump in.
A dovish turning Fed then only tells us to reduce our underweight and get ready to buy more aggressively.
FYI:
- Stockmarket Seasonality: Another cautionary against getting too hopeful is the seasonally sloppy patch we are heading into. And the chart below maps out the seasonal trends across global markets… (and yes: market seasonality is a global phenomenon).

Source: Ben Laidler at eToro via Callum Thomas
- Could it be that the break in energy costs the world got in the past year is near its end?

- The Oldest Mistake in Economics Chile nationalizes its lithium reserves, in another sign of Latin America’s left turn.
 China Locks Information on the Country Inside a Black Box Restrictions on Wind database and other information channels add to campaign to curb foreign influence
China’s party-state, long steeped in secrecy, is creating a black box around information on the world’s second-largest economy, alarming global businesses and investors.
Prodded by President Xi Jinping’s emphasis on national security, authorities in recent months have restricted or outright cut off overseas access to various databases involving corporate-registration information, patents, procurement documents, academic journals and official statistical yearbooks.
Of extra concern in recent days: Access to one of the most crucial databases on China, Shanghai-based Wind Information Co., whose economic and financial data are widely used by analysts and investors both inside and outside the country, appears to be drying up.
Following recent expansion of China’s anti-espionage law, aimed at fighting perceived foreign threats, many foreign think tanks, research firms and other nonfinancial entities are finding they can’t renew subscriptions to Wind over what Wind described as “compliance” issues, according to interviews with Western researchers and macroeconomic analysts. (…)


 Data: FactSet, Bureau of Economic Analysis; Chart: Axios Visuals
 Data: Google, Amazon and Microsoft; Chart: Axios Visuals