The enemy of knowledge is not ignorance, it’s the illusion of knowledge (Stephen Hawking)

It ain’t what you don’t know that gets you into trouble. It’s what you know for sure that just ain’t so (Mark Twain)

Invest with smart knowledge and objective odds

YOUR DAILY EDGE: 11 October 2024

New feature: EDGE AND ODDS’ DaiLY CHAT.

Most days, I will provide a link to an AI generated chat on the day’s post courtesy of Google’s NotebookLM. Not totally satisfying but worth offering to readers on the go. No support charts however and some AI generated conclusions not really mine….

And there is much more on the blog itself.

And if you sense hallucinations, editorializing and patronizing, I will totally fault AI Winking smile.

October 9, 2024

October 11, 2024

September CPI: Minor Turbulence

The bumpy ride to slower inflation continued in September. Overall consumer prices rose 0.2%, which was a tick higher than the Bloomberg consensus. Despite the somewhat larger-than-expected outturn, prices over the past year are up 2.4%, which marks the lowest one-year change in consumer prices since February 2021.

Consumers received some respite at the pump in September, with gasoline prices falling 4.1% last month. However, grocery store prices picked up sharply, increasing 0.4%. This was the largest monthly gain in nearly two years and was driven by a jump in egg prices (+8.4%) and the relatively volatile food component of fruits & vegetables (+0.9%). Even with September’s jump, prices for food at home have risen 1.3% over the past year, down from a 12-month pace of 2.4% this time last year and a recent peak of 14% in the summer of 2022.

Excluding food and energy prices, core CPI came in at 0.3% (0.31% unrounded). This was modestly higher than we expected. Core goods prices rose 0.2% in the month, halting a six-month streak of deflation for prices in the goods sector. Small increases for prices of new and used vehicles contributed to the move higher, as did a 1.1% increase in apparel prices. Lower prices for medical care goods and recreation goods helped keep the increase in core goods prices in check.

Core services inflation was 0.4% in September (0.36% unrounded), a modest cooldown from the 0.41% pace registered in August. The drivers of services inflation in September were much different from what took place the prior month. Owners’ equivalent rent came in at 0.3% in September, reversing the puzzlingly-strong 0.5% reading in August. Rents rose 0.3%, a tenth slower than September. However, outside primary shelter, services inflation jumped on the back of higher prices for airfares (+3.2%), motor vehicle insurance (+1.2%) and medical care services (+0.7%).

Looking through the month-to-month noise, the underlying trend in core services inflation in recent months seems to have been between 0.3% and 0.4%, about a tenth or so stronger than the monthly pace that prevailed before the pandemic.

Overall core CPI inflation has risen at a 3.1% annualized pace over the past three months, slightly below the year-ago pace (+3.3%) and about a percentage point faster than core CPI inflation in 2019.

The September CPI report is consistent with our view that, while the overall trend in core inflation remains lower, further improvement is likely to be slower-going. The deflationary impulse to goods prices has waned with supply chain pressures no longer receding and inventories largely replenished.

The downdraft to overall inflation from food and energy also has weakened, with the risks to energy costs for the time-being seeming to lie to the upside. However, we look for services inflation to continue to slow as housing inflation eases further and service providers benefit from tamer input cost growth for goods and labor.

While the next leg lower in inflation may take more time, the good news is that with the jobs market remaining in good shape and solid growth in productivity, average hourly earnings growth, up 4.0% over the past year, continues to outpace inflation. Thus, we do not see slower improvement on the inflation front as an impediment to real spending and output.

While today’s inflation report may make some of the more hawkish members of the FOMC somewhat more reluctant to ease monetary policy further at the Committee’s next meeting on November 7, we do not believe it is strong enough to warrant a pause. With inflation continuing to slow on trend and upward pressure on prices dissipating amid a cooler labor market and encouraging trends in productivity, there is still likely scope in the near term for policy to “recalibrate” further.

There are many ways to skin a cat, many more ways to skin a CPI report. Trying to keep it simple:

  • The Fed aims at ~2.0% core inflation. On a MoM annualized basis, it was 4.5% in Jan-March, it slipped to 0.7% in June but it has increased every month to reach 3.7% in September.
  • Services prices followed the same path, from 6.9% in Jan-March to 1.5% in June and 4.5% in September, roughly the trend in wages (see below).
  • The surprise last month was in durables prices, up 1.0% monthly after 15 consecutive monthly declines. Not because of the heavy weights new or used vehicles (+0.2% and 0.3%) but because of several items such as vehicle parts and equipment (0.9%), furniture (1.7%), cookware (5.7%) and jewelry (4.7%).

image

A monthly aberration? Maybe, but also consider that

  • commodity prices ex-energy bottomed in the spring and are up about 15% since.

image

  • Deflation from China may also have reached its worst readings:

Services (64% of CPI and 81% of core-CPI) have re-accelerated to just below 5% and not only because of shelter (+4.7% YoY ).

Services less rent spiked 0.6% MoM in September after being flat for 2 months. Medical care, transportation services, airline fares were the main drivers last month but others were contributors in previous months since wages are the main factor in services inflation.

The Atlanta Fed updated its Wage Growth Tracker yesterday: whether we look at the total, the stayers or the switchers, the 3-m moving average has stabilized just under 5% growth.

image

In my August 26 Lucky Fed! post I wrote “there is no such thing as an immaculate disinflation. China’s inability to boost its domestic economy deflated imported goods and oil prices which kept inflation expectations anchored. Part of the normalization of the labor market came from surging immigration. The fundamentals of supply/demand normally arising from a “very restrictive monetary policy” have not really materialized just yet.”

I advised to

  • Watch China trying to mend its housing mess and boost domestic demand
    (it’s seems to be trying harder lately)

  • Watch oil prices
    (up 10% in recent weeks)

  • Watch the USD
  • Watch immigration (elections)

Note also that my CPI-Essentials index (food, energy, shelter) is now up 2.9% YoY from 5.4% one year ago and 4.4% last May. The consumer is in good shape.

image

John Authers says mission accomplished:

Inflation Is Finally Losing Its Power Over Markets The stubbornness of services still needs grinding down, but the Fed has won this war of attrition.

(…) US inflation has not completed its journey to the Federal Reserve’s target, but it is dull again, and that suggests that much of the Fed’s work is done. (…)

What was so dull? If we break down inflation into its four main components, we find that it’s substantially all about services at this point. That’s been true for a while. Goods prices are deflating, but helped cause some of the disappointment because that’s happening less quickly than earlier in the year:

Simplifying that chart, this is how core services’ contribution to overall inflation compares to all of the index’s other components. The great spike in price rises that came the year after the pandemic was almost comprehensive, and it has run its course. What remains is grinding down the services inflation that followed the rest, and tends to be driven by wages:

On this front, the Fed’s favored “supercore” measure of inflation, of services excluding shelter prices, has some bad news. It’s ticking up again, and the annual rate remains above 4%. That would make continued jumbo interest rate cuts difficult:

Other measures are more hopeful. The Fed sets great store by the trimmed mean, as calculated by the Cleveland Fed, in which the outliers are stripped out and an average taken of the rest. It’s declining but still a little above 3%. Sticky prices that take a while to change are also falling slowly, and are now at 4%:

If there’s reason for concern, it’s that the period of steep decline seems to be over (and goods prices have even ticked up again), with headline inflation still above 2%. TS Lombard’s Stephen Blitz produces a diffusion index of the proportion of Consumer Price Index components whose three-month average is higher than their 12-month rolling  average — a measure of whether the trend is increasing or decreasing. On that basis, it looks like inflation has come to rest at a level that is still too high for comfort: (…)

Hmmm…

Here’s the detailed supercore CPI courtesy of zerohedge:

Image

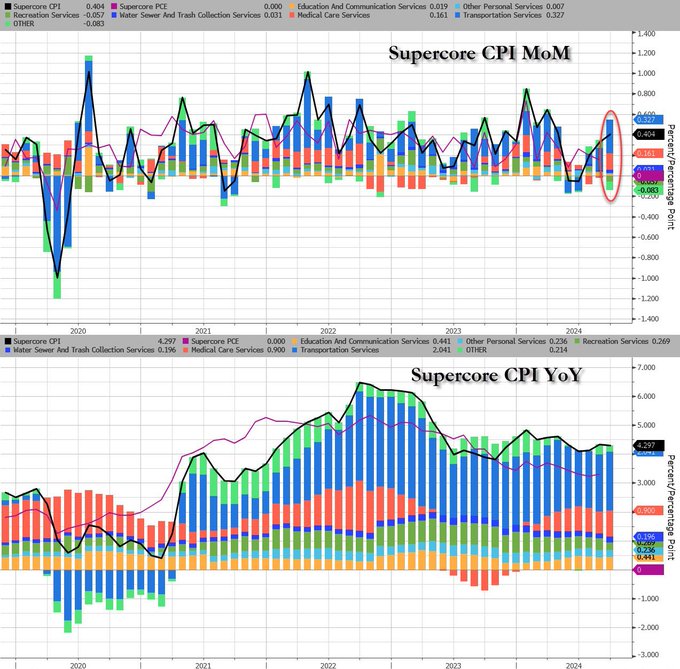
Remember that supercore conveniently excludes rent which, as Ed Yardeni says is disconcerting:

The waiting game for shelter inflation to fall isn’t going as planned. We still expect shelter CPI inflation to decline as price increases for new market rentals slowed. But the recent upticks in the 3-month annualized rates are disconcerting.

US Jobless Claims Soar to Year High, Hit by Helene and Auto Cuts Initial filings rose by 33,000 to 258,000 in the latest week

On an unadjusted basis, more than half of the advance was tied to states affected by Helene, including North Carolina and Florida.

Michigan, home to a number of auto assembly plants, led all states with a nearly 9,500 increase in applications — the most since the first week of July. (…)

The jobless claims data are likely in for stretch of volatility in the wake of hurricanes Helene and Milton, which landed in Florida on Wednesday night, complicating efforts by the Federal Reserve to accurately gauge underlying developments in the US labor market. While many people in the southeastern US are unable to work because of the storms’ destruction, some may also have difficulty or delay applying for unemployment benefits. (…)

“The hurricane influence is not unusual for this time of year, but the scope of Helene’s destruction points to a heavy and prolonged bulge in initial claims,” he said. (…)

Three Fed Officials Shrug Off CPI Report, Bostic Open to Pause NY Fed’s Williams says appropriate to continue moving rates

Three Federal Reserve policymakers on Thursday were unfazed by a higher-than-forecast September inflation report, suggesting the US central bank can continue lowering interest rates, but a fourth hinted he may favor a pause at their next meeting.

“Month to month, there’s wiggles and bumps in the data, but we’ve seen this pretty steady process of inflation moving” downward, New York Fed President John Williams said during an event at Binghamton University. “I expect that that will continue.”

Bank of Chicago President Austan Goolsbee, in an interview on CNBC, said “the overall trend” for inflation over 12 to 18 months was clearly moving down. His counterpart from the Richmond Fed, Thomas Barkin, said inflation was “definitely headed in the right direction.” (…)

YOUR DAILY EDGE: 10 October 2024

New feature: EDGE AND ODDS’ DaiLY CHAT.

Most days, I will provide a link to an AI generated chat on the day’s post courtesy of Google’s NotebookLM. Not totally satisfying but worth offering to readers on the go. No support charts however and some AI generated conclusions not really mine….

And there is much more on the blog itself.

And if you sense hallucinations, editorializing and patronizing, I will totally fault AI Winking smile.

October 8, 2024

October 9, 2024

CONSUMER WATCH

Overall, in our view, the consumer continues to show modest forward momentum. Bank of America aggregated credit and debit card spending per household fell 0.9% year-over-year (YoY) in September, following a 0.9% YoY rise in August. But the timing of Labor Day impacted the YoY comparisons over August and September. Seasonally adjusted spending rose 0.6% month-over-month (MoM) in September, following a 0.2% decline in August.

Looking at quarterly averages, Services spending growth remains very persistent, with no clear direction to retail spending growth.

imageHurricane Helene, which resulted in a tragic loss of life and widespread displacement of communities, occurred relatively late in the month, so the impact on overall credit and debit card spending was limited at the national level. However, in the last week of September, card spending was down sharply in impacted states.

Bank of America internal data on after-tax wages and salaries growth continues to be supportive of consumer spending. Though higher-income growth has made notable gains over the past six months, lower-income wage growth remains strongest at 3.5% YoY in September.

Americans’ home equity as a percentage of home values is at its highest since the 1950s, according to Federal Reserve data. This is a product of many factors. For one, house prices have increased sharply over the past five years. And at the same time, the level of housing transactions has been low, with many homeowners reluctant to move given rising mortgage rates and often being ‘locked in’ to much lower, fixed rates.

image

Wage Growth and Labor Market Tightness

Just released by the NY Fed:

Good measures of labor market tightness are essential to predict wage inflation and to calibrate monetaryvpolicy. This paper highlights the importance of two measures of labor market tightness in determiningvwage growth: the quits rate and vacancies per effective searcher (V/ES)—where searchers include bothvemployed and non-employed job seekers.

Amongst a broad set of indicators of labor market tightness, wevfind that these two measures are independently the most strongly correlated with wage inflation and alsovpredict wage growth well in out-of-sample forecasting exercises.

Conversely, transitory shocks to productivity have little impact on wage growth.

image

image

The Heise-Pearce-Weber (HPW) Tightness Index uses both the quits rate and V/ES jointly:

image

Figure 3 demonstrates the fit of the HPW Index visually by plotting it against wage growth, measured using a 3-period moving average of the 3-month growth in the ECI (both series are normalized to have a mean of zero and variance of one for ease of comparison). We compare our measure against a common measure of labor market tightness: the Conference Board’s survey measure of consumers’ perception of job availability.

Both the Conference Board measure and the HPW index track wage growth well in the prepandemic period. However, in the pandemic period, our measure performs significantly better.

Having shown the ability to predict contemporaneous wage growth, we now turn to a forecasting exercise where we leverage the quits rate and V/ES to make predictions on wage growth.

Based on our methodology, we predict an annualized 3-month ECI reading of 3.33 percent in 2024:q3 (0.82 percent compared to the previous quarter), after 3.41 percent annualized in 2024:q2.

image

FYI, the ECI wage growth was 4.0% YoY in Q2, down from 4.3% in Q1 and 3.0% in Q4’19. On a QoQ basis, ECI-Wages slumped from +1.1% in Q1 to +0.8% in Q2. In 2019, ECI-Wages growth averaged +0.74% per quarter.

image

Also FYI, the Atlanta Fed Wage Growth Tracker was at 4.6% YoY in August (3m m.a.):

image

German Government Slashes Economic Forecasts Germany has struggled to recover from the economic hit from Russia’s full-scale invasion of Ukraine

The German economy should contract 0.2% this year, Germany’s economy ministry said in a fall economic projection, considerably lower than the 0.3% rise it anticipated in April.

That would mean Germany’s economy would shrink for the second-straight year—it contracted 0.3% in 2023—for the first time since the early-2000s. That marks a contrast with other developed economies, such as the U.S., which grew 2.9% last year and 3% in the second quarter of this year on an annualized basis.

Germany has struggled to recover from the economic hit from Russia’s full-scale invasion of Ukraine, which caused energy prices to spike, scarring its energy-intensive manufacturing sector that has yet to recover its pre-pandemic output.

Europe’s largest economy is also weakly placed as a typically export-driven nation amid the recent global economic slowdown, with demand for German goods in China tailing off.

The economy minister, Robert Habeck, said Wednesday that Germany also has less leeway to stimulate the economy than other leading nations, including the U.S., due to a constitutionally enshrined fiscal rule that prohibits large deficits. (…)

Berlin expects gross domestic product to rise 1.1% in 2025 and 1.6% in 2026, as private consumption and a recovery of exports help boost growth. (…)

Germany’s government expects inflation to fall from an average of 5.9% last year to 2.2% in 2024 and 2.0% in 2025—the latter matching the ECB’s target.

France’s government is to deliver its 2025 budget on Thursday with plans for 60 billion euros ($65.68 billion) worth of tax hikes and spending cuts to tackle a spiralling fiscal deficit.

Prime Minister Michel Barnier’s new government is under increasing pressure from financial markets and France’s European Union partners to take action after tax revenues fell far short of expectations this year and spending exceeded them.

But the budget squeeze, equivalent to two points of national output, has to be carefully calibrated to placate opposition parties, who could not only veto the budget bill but also band together and topple the government with a no-confidence motion.

Lacking a majority by a sizeable margin, Barnier and his allies in President Emmanuel Macron’s camp will have little choice but to accept numerous concessions to get the budget bill passed, which is unlikely before mid to late December. (…)

Barnier has said he will spare the middle class and instead target big companies with a temporary surtax and people earning over half a million euros per year.

All taxpayers will nonetheless be hit by plans to restore a levy on electricity consumption to where it was before an emergency reduction during the 2022-2023 energy price crisis.

The government has said the budget bill will reduce the public deficit to 5% of gross domestic product (GDP) next year from 6.1% this year – higher than almost all other European countries – as a first step towards bringing the shortfall into line with an EU limit of 3% in 2029.

China Wages End Two Quarters of Gains, Adding Deflationary Risks Salaries offered to new hires decrease 0.6% from a year ago

Average monthly salaries offered by companies to new recruits in 38 key Chinese cities fell 0.6% in the third quarter from a year ago to 10,058 yuan ($1,423), according to data provided by online recruitment platform Zhaopin Ltd. and compiled by Bloomberg. The decrease follows a modest uptick of 2.2% and 0.5% in the first and second quarters, respectively.

The figures add to other recent data in revealing a worsening job market that’s discouraging residents from spending more and deepening a cycle of price and wage declines. (…)

image

The Q3 earnings season begins.

Ed Yardeni:

The stock market rally continues to broaden as more stocks participate. The percentage of S&P 500 companies with positive y/y price changes is at 85% (chart).

The stock market has rallied even as the 10-year Treasury bond yield rose from 3.62% on September 16 to 4.07% today (chart). That surprised plenty of bond investors who expected the Fed’s 50bps cut in the federal funds rate (FFR) and very dovish forward guidance to push yields lower.

We weren’t surprised because the backup in the bond yield confirms our view that the Fed is stimulating an economy that doesn’t need additional stimulus. Today’s reading of the Atlanta Fed’s GDPNow tracking model shows a 3.2% (saar) increase in Q3’s real GDP, following Q2’s 3.0% (chart). In other words, real GDP also continues to notch new record highs. (…)

We think the FOMC will leave rates unchanged next month. None-and-done is still our outlook for the rest of this year.

From Goldman Sachs:

 image image

image

The much stronger-than-expected September employment report accelerated the adjustment higher in UST yields as the market quickly reduced the likelihood of large Fed cuts, and we think the upward pressure on rates has room to run. While the adjustment has so far played out most prominently in front-end rates, we continue to think that, over the medium term, further accumulation of good growth news should drive yields higher across the curve.

The strong employment report also further boosted the broad Dollar, and we think the report is sufficient to put a floor under the Dollar, which should also continue to benefit from its safe-haven status.

Further escalation in the Middle East conflict has continued to raise questions about the growth and market impacts of a broader war in the region. We continue to think that the biggest impacts of such a scenario would come through a disruption in energy supplies, with a potential disruption to Iranian oil production likely to lead to a further rise in oil prices.

Indeed, we estimate that Brent prices could rise by $10-20/bbl by 2025 in the event of a 1mb/d persistent disruption or 2mb/d 6-month disruption to Iran supply, with the ultimate impact depending on whether OPEC chooses to offset the production losses by deploying spare capacity.

In both disruption scenarios, we caution that a potential reversal in speculative positioning—which currently sits in the lowest 1% of history—may increase the upward pressure on prices and risk premia.

On the gas front, we estimate that a full, sustained disruption to Israel’s Leviathan and Tamar gas fields this winter would tighten the global LNG market by around 2%, which would leave European markets vulnerable to price spikes, especially this winter.

AI CORNER

Internet Hype in the ’90s Stoked a Power-Generation Bubble. Could It Happen Again With AI? The current electricity boom has echoes of—but also important differences from—an earlier boom-bust cycle

(…) Hugh Wynne, co-head of utilities and renewable-energy research at SSR, worked at a power-project development company from the mid-1990s to 2001. He said developers at the time assumed that the long-term power price would match the long-run marginal cost of new power-plant capacity, covering both variable operating costs as well as capital costs. In fact, Wynne said, after the aggressive build-out resulted in a surplus of capacity in many markets, power prices fell sharply, covering only the operating costs of these power plants—not enough for the companies to pay off the debt they raised to build them.

Could the current market face similar problems? Likely not in quite the same way. For one thing, the drivers of electricity-demand growth are more tangible this time around. Tech companies are spending real money on building out AI infrastructure, and the Chips Act contains clear incentives for nearshoring chip manufacturing. At the same time, energy demand from transportation and industrial applications—including fracking equipment—is steadily shifting to electricity.

Secondly, the industry today is more familiar with how competitive power markets work. Independent power producers and the financiers backing their projects were burned enough by the last gold rush that they aren’t likely to invest in new power plants without some kind of long-term power-purchase agreement, Wynne said. Always-available power is important for data centers, and tech companies have been willing to sign long-term contracts at premium prices. (…)

image

Notably, utilities’ long-term demand forecasts have changed a lot over the past few years and are likely to keep being revised. In early 2021, utilities in aggregate expected load to grow 8.2% by 2035 compared with 2021 levels, according to analysis by the Rocky Mountain Institute. As of June 2024, the expected growth was 23.9%. (…)

Independent power producers might not be the only beneficiaries of rising electricity demand. Regulated utilities have been teaming up with tech companies to develop new generation, including Berkshire Hathaway-backed NV Energy and Duke Energy. Utilities in certain states aren’t allowed to own their generation, but some have said they would push for legislation to change that.

The power industry has matured a lot in the past two decades. But the same fundamental lesson holds: High-voltage expectations can lead to painful burns.

Related: Power Play

The technology projects a green circle on packages to be delivered at each stop and red Xs on those to be delivered later, Amazon said Wednesday at a Nashville media event focused on its logistics and online shopping initiatives.

Called Vision Assisted Package Retrieval and in development since 2020, the tool will be deployed in 1,000 Amazon vans next year and will shorten the typical delivery route by about 30 minutes, the company said.

The tool uses computer-vision technology initially developed in Amazon warehouses to identify products without using barcode scanners. The technology was adapted for vans’ cramped cargo areas and integrated with delivery-route navigation software.

“Delivery drivers will no longer have to spend time organizing packages by stops, reading labels or manually checking key identifiers like a customer’s name or address to ensure they have the right packages,” Amazon said in a release. “They simply have to look for VAPR’s green light, grab and go.”

  • OpenAI may be a tech darling but data indicate it won’t actually turn a profit until 2029, The Information reported. Losses are expected to be as high as $14 billion in 2026. (Bloomberg)