Personal income shot higher in April rising 0.8%, well north of the 0.3% that had been expected. The fact that it comes on the heels of an upwardly revised increase the prior month makes the gain all the more impressive. Looking at the underlying details, a standout was a surge in transfer payments from the U.S. government.
The increase in government social benefits was driven mostly by Social Security payments, reflecting payments associated with the Social Security Fairness Act. This act, passed in December, granted benefits to more than three million retirees from a variety of sectors including teachers, law-enforcement officers and other workers receiving public pensions who had not previously been receiving full benefits for a variety of reasons.
Note that the saving rate jumped to 4.9%, the highest in nearly a year. Take that with a grain of salt as it is driven partly by this one-off jump in income.
Consumer spending rose 0.2% in April, but for the most part, the gains were in services categories, the largest of which were non-discretionary categories such as housing and utilities as well as health care.
Consumers cut back on spending in most goods categories in April after having pulled forward demand to get ahead of tariffs earlier in the year. The retreat was led by non-durable goods and motor vehicles as well as clothing and recreational goods. The only two goods categories that were meaningfully positive in April were household furnishings which notched a $1.1 billion gain and gasoline where the gain was mostly attributable to rising prices at the pump.
We got a glimpse of downward revisions in yesterday’s second-estimate of first-quarter GDP growth. While overall GDP was revised up, consumer spending was revised down; real personal consumption expenditures advanced at just a 1.2% annualized pace in Q1, or the slowest in a year and a half.


Source: U.S. Department of Commerce and Wells Fargo Economics
At this early stage, there is not any particularly compelling evidence tariffs have had a material impact on inflation…yet. Headline PCE rose just 0.1% in April, coming on the heels of last month’s goose-egg, the year-over-year measure slipped to just 2.1% from 2.3% in March.
Core PCE similarly rose just 0.1% in April putting the annual rate of core PCE inflation at 2.5%. As we think about the rest of the year, we suspect inflation will be characterized by a continued slight cooling in services inflation and a boost from the goods side that will largely be a function of how things play out in the ever-changing world of tariffs.
The big question is whether tariff-induced uncertainty will cause households to stop spending. One way to gauge consumer concern is through the personal saving rate, which measures how much income households have left after spending on traditional goods and services and other outlays, like interest, each month. However the jump this month as we mentioned is a little suspect due to the jump in social security payments.
In the absence of that income jolt, the saving rate would remain near the lower-end of its recent range and well below pre-pandemic averages. Overall the household sector remains in a sturdy financial position helping mitigate recent uncertainty, but we suspect household will remain very price sensitive in coming months.

It’s true that discretionary spending was soft in April (and BofA card data suggest a soft May) but real expenditures on durables was only off 0.8% MoM after a 3.8% surge in March. Not much of a payback.
That said, real durables have declined in 3 of the first 4 months this year, –4.0% annualized YtD.
That said, though volatile, Americans are keeping their consumption of durable goods in stride with their labor income:

It’s also true that there is no evidence that tariffs are causing higher inflation, overall, but durable goods price rose 0.5% MoM in April and are up 3.3% annualized YtD, sharply above last year’s –2.1%.
Recall that
- core goods PPI rose 0.4% in April after +0.3% in each of February and March. Last 3 months annualized: +4.1% following +2.0% in the previous 8 months when monthly gains were limited to 0.1-0.2%.
- import prices for consumer goods increased 0.3% in April, the first monthly advance since October 2024 (import prices exclude tariffs).
There is clearly price pressures in the goods pipelines.
But YoY, durables inflation is still negative while services inflation is slowing thanks to slowing wages and lower oil prices.


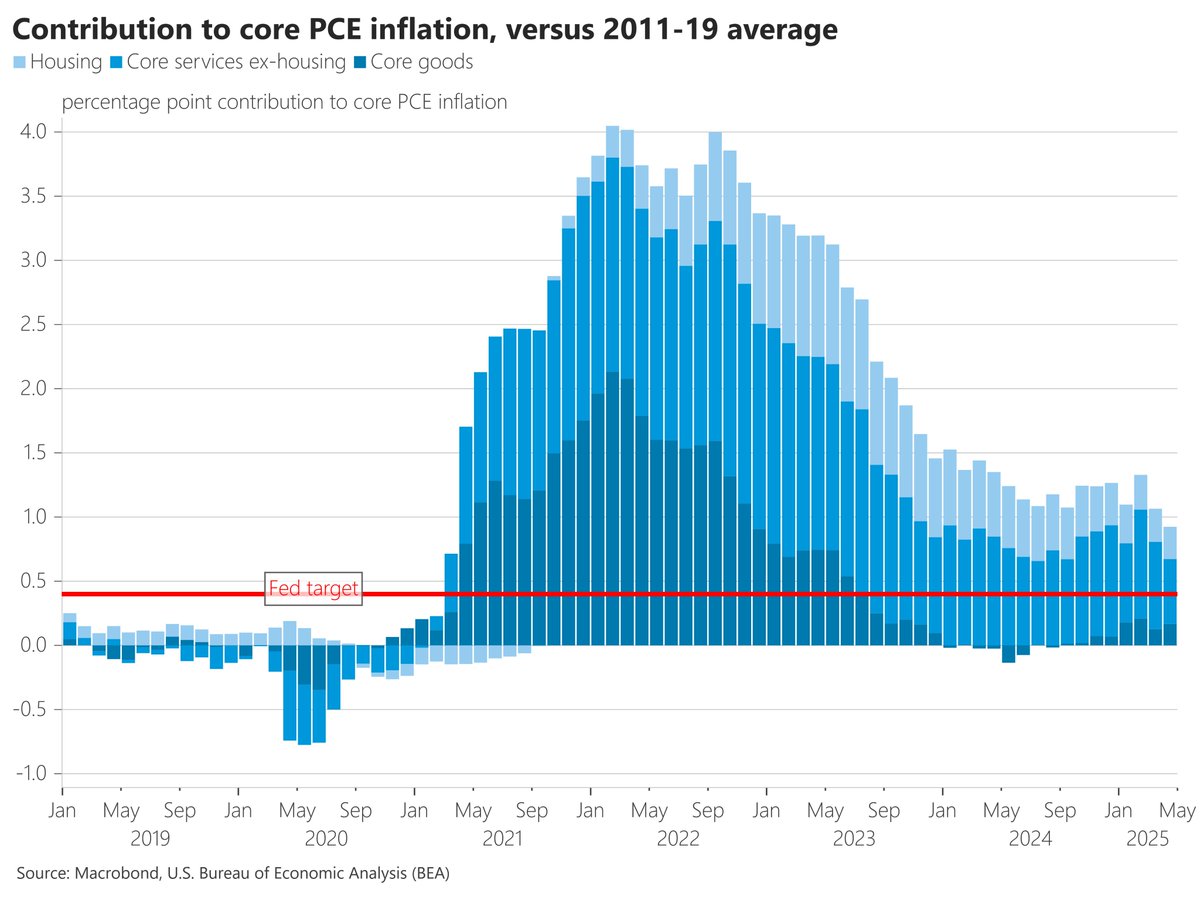
- “This chart looks at what’s driving the continued overshoot of core inflation from the Fed’s target versus the 2011-19 level. Right now, the overshoot is being driven mostly by core nonhousing services, but the gap continues to narrow.” (Nick Timiraos)
American Consumers Are Still Gloomy on the Economy Changing tariff policies have made it difficult to forecast prices
The final May reading for the University of Michigan’s closely watched index of consumer sentiment was 52.2, unchanged from the previous month.
It was slightly higher than a preliminary reading of 50.8 that was released two weeks ago. It was still one of the lowest ever recorded, in data going back to 1952. (…)
People expect prices to surge 6.6% over the next year. That was up from April’s reading of 6.5% and the highest since 1981. Still, the previous four months saw much larger increases in people’s inflation expectations. Inflation expectations for the next five years fell slightly, to 4.2% in May from 4.4% in April.
Still helping:
(…) The kingdom steered the group to agree the third super-sized monthly output hike in a row, despite dissent from a faction led by Russia. The Saudis are doubling down on a historic shift, driving oil prices lower as they seek to punish the alliance’s quota cheats and reclaim their share of global markets.
The policy change dragged crude futures to a four-year low below $60 a barrel in April, affecting everyone from American drivers to petrochemical users in Asia. (…)
The meeting’s outcome marks a new peak in the Saudis’ long-running dominance of OPEC+. It raises questions over the future of the alliance and the complex web of relations between Crown Prince Mohammed bin Salman and Russia’s Vladimir Putin — as well as President Donald Trump. (…)
Russia — the only member with comparable oil production and geopolitical clout to Saudi Arabia — was supported by Oman and Algeria as it argued for OPEC+ to hold output steady in July and wait to assess the impact of earlier increases.
But with no other opposition, the Saudi proposal for another 411,000 barrels a day was approved. While Russia and its allies acquiesced, and delegates denied there was any real split, there was no doubt who carried the day.
The agreement means OPEC+ is just over halfway through its accelerated revival of 2.2 million barrels-a-day of halted production. The coalition will meet again on July 6 to discuss its supply increase for August, when the differences between Moscow and Riyadh will come back into play.
“Saudi Arabia is really in the driving seat,” said Jorge Leon, an analyst at Rystad Energy A/S, who previously worked at the OPEC secretariat. “This isn’t just supply management — it’s strategic calibration with geopolitical intent.”
Goldman: “We are maintaining our cautious Brent/WTI oil price forecast averaging $60/56 in the remainder of 2025 and $56/52 in 2026. This reflects our forecast that strong supply growth outside of US shale will drive surpluses of 1.0mb/d in 2025 and 1.5mb/d in 2026.”
(…) Imports of goods for April totalled $276.1bn, down 19.8 per cent from March, according to the Census Bureau’s advance economic indicators report, released on Friday. The drop is the largest in the bureau’s data dating back to 1992 and marks a stark turnaround from March, when companies rushed to buy foreign goods before Trump’s April 2 “liberation day” tariffs announcement. (…)
A worldwide manufacturing slump underway?
MANUFACTURING PMIs
China Manufacturing Activity Improves in May
The official manufacturing purchasing managers index for May came in at 49.5, sharply [?] up from April’s 49.0 and narrowly missing the 49.6 tipped by a Wall Street Journal poll of economists, according to data released by the National Bureau of Statistics on Saturday. (…)
The production subindex increased to 50.7 in May from 49.8 in April. The subindex for total new orders rose to 49.8 in May, compared with 49.2 in April, while that for new export orders jumped to 47.5 from 44.7.
Meanwhile, China’s nonmanufacturing PMI, which covers both service and construction activity, edged down to 50.3 in May from 50.4 in April, said the statistics bureau.
The subindex tracking service activity rose to 50.2 in May from 50.1 in April, while the construction subindex declined to 51.0 from April’s 51.9.
S&P Global’s China manufacturing PMI is out tomorrow. The US later this morning.
- Japan Manufacturing PMI improved a little from 48.7 to 49.4. “Total new business fell modestly, with lower sales generally linked to subdued demand conditions amid US tariffs and increased client hesitancy. The decline in new export orders also moderated since April, but remained solid overall. The health of the consumer goods sector meanwhile weakened after an improvement in April. Average input costs faced by Japanese goods producers increased at a softer pace in May, with the rate of inflation the weakest in 14 months. At the same time, selling price inflation also eased in May, with charges rising at the softest rate in nearly four years.”
- The HCOB Eurozone Manufacturing PMI rose to 49.4 in May, from 49.0 in April. “Demand conditions were broadly stable midway through the second quarter. Relative to the trend over the past three years, this marked an improvement, as new orders had previously fallen sharply on average since May 2022. Sales made to customers in export markets likewise came close to stabilising, with the respective HCOB index posting a 38-month high that was only just below the neutral 50.0 level. Input costs decreased for a second month in a row in May. The rate of decrease was the quickest in 14 months. There was evidence of companies passing on cost savings to their clients as output charges were discounted for the first time since February.”
- In Vietnam, “ as was the case in April, new orders decreased during May, with survey respondents linking the latest fall to tariffs and subdued market demand. The impact on demand was most keenly felt in export markets, with new business from abroad
declining at a much faster pace than total new orders. The fall in new export orders was broadly similar to that seen in April. With input costs down, manufacturers continued to lower their own selling prices midway through the second quarter. Charges have now decreased in each of the past five months, with output prices down modestly again in May.”
- In Indonesia, “International demand also reduced further, albeit at a softer pace, as manufacturers signalled particular falls in exports to the US. Firms looked to increasingly absorb higher input costs and even offer discounts as part of efforts to stimulate demand. As a result, output prices rose at a fractional rate that was the softest in the current eight-month sequence of charge inflation.”
- In Taiwan, “Total new business fell solidly in May, despite the rate of contraction easing slightly from April, while new export orders declined at the steepest pace in nearly a year-and-a-half. Companies often looked to pass on any cost savings to customers as part of efforts to attract new orders, cutting their selling prices for the third month in a row. The rate of discounting was the quickest seen in nearly two years and solid.”
- In South Korea, “New orders fell at the fastest pace since June 2020, and the strongest rate in almost a decade if the COVID-19 pandemic period is excluded. Respondents particularly mentioned the US as a source of falling new export orders. Goods
producers raised charges at the slowest rate in the current six-month sequence of inflation.”
President Trump said he would double tariffs on imported steel, a move he said would bolster the domestic industry and protect U.S. jobs.
Trump announced the higher duties at a rally near Pittsburgh promoting a $14 billion deal between Tokyo-based Nippon Steel and U.S. Steel, which the president said would ensure U.S. control over the storied steelmaker. (…)
Trump said tariffs on imported steel, as well as aluminum, would increase to 50% from the current 25%, effective June 4. Global prices for steel have been falling in recent months, making it easier for steel buyers to pay the existing duty on imports and still acquire steel at a discount to domestic prices.
The higher tariff also will give domestic steelmakers more power to raise prices. Steel demand and prices have been cooling since April. (…)
The WSJ Editorial Board:
(…) Higher tariff walls may help Cleveland-Cliffs stanch its red ink, but they are unlikely to save or create jobs. They will raise costs for steel consumers including auto-makers and machinery manufacturers and could boomerang.
His first-term steel and aluminum tariffs caused prices to rise for a period, but higher prices hurt customers and caused demand to fall. A Federal Reserve Board of Governors study estimated the tariffs cost 75,000 manufacturing jobs. Employment in fabricated metals manufacturing is still some 33,000 lower than when the tariffs took effect.
[Cleveland-Cliffs CEO] Mr. Goncalves noted in a recent quarterly earnings call that Mr. Trump’s auto and steel tariffs on Canada “impacted our clients” who sell products in the U.S. “That was not part of our plan. Absolutely not. Nobody saw that coming,” he said, adding he wouldn’t have bought Canadian steelmaker Stelco “if I knew that Canada would not be treated like a friend.”
That’s what happens when your main business model is political mediation. The politicians can’t be trusted. The new 50% tariff wall will hurt Mr. Goncalves’ “clients” doubly hard.
Charts from Goldman Sachs. Spot US HRC prices are 31% higher than EU and Brazil, 50% higher than Japan and 107% higher than China. On rebar: +21-36%, +44% and +93% respectively. Yet, we import less of the lower cost stuff. What cost MAGA?


Bruce Mehlman
China Hits Back Against Trump Claims That It Broke Trade Truce Recent developments have damped optimism that the two superpowers will reach a lasting deal
U.S. trade policy is making China great again — at the United States’ expense, per an analysis from Morning Consult that looks at global favorability ratings, and finds China’s rising while America’s falls.
The drop in America’s reputation is already costing the country economically — through a fall in foreign visitors turned off by White House policies, and even the decline of the dollar. (…)
As of the end of May, China had an 8.8 net favorability rating, compared to -1.5 for the U.S., according to favorability data for last month provided exclusively to Axios by Morning Consult.
In January 2024, the U.S. rating was above 20 and China was in negative territory.
The data tracks net favorability ratings, or the share of respondents with a positive view of a country minus those with a negative view.
Morning Consult surveyed adults in 41 countries including Canada, France, Japan, Russia and the U.K.
The U.S. had a largely positive reputation last year — but it dropped sharply after President Trump took office.
- “Since January 2025, the overwhelming majority of countries simultaneously exhibit worsening views of the United States and improving views of China,” McMann writes.
- “Only in Russia have views of America meaningfully improved.”
Meanwhile, China’s rating has been negative going back to October 2020, when Morning Consult first began tracking; it started trending into positive terrain after election day last year.
- But most of the country’s improvements have come since March — including a sharp tick up after Trump’s “Liberation Day” tariff announcements.
- “The reputational damage done by the “Liberation Day” tariff announcements has now sealed the deal,” per the report.

The US Dollar Index will fall about 9% to hit 91 by around this time next year, strategists including Matthew Hornbach predicted in a May 31 note. (…)
“We think rates and currency markets have embarked on sizeable trends that will be sustained — taking the US dollar much lower and yield curves much steeper — after two years of swing trading within wide ranges,” the strategists wrote.
The Morgan Stanley report adds to a chorus of voices questioning the outlook for the dollar, as traders and analysts weigh up US President Donald Trump’s disruptive approach to trade. JPMorgan Chase & Co. strategists led by Meera Chandan told investors last week they remain bearish on the US currency, instead recommending bets on the yen, euro and Australian dollar.
The US Dollar Index has dropped nearly 10% since a February peak as Trump’s trade policies dent sentiment on US assets and trigger a re-think on the world’s reliance on the greenback. Still, the bearishness is far from historical extremes, underscoring the potential for more dollar weakness ahead, Commodity Futures Trading Commission data showed. (…)
The bank said that 10-year Treasury yields will reach 4% by the end of this year, and stage a much larger decline next year as the Federal Reserve delivers 175 basis points of rate cuts.
Obituary of the US Dollar as the Sole Lifeblood of the World Economy
By: Hubert Marleau
A few days ago, Donald Trump told the Americans that “if we lost the dollar as the world currency…that would be the equivalent of losing a war”. Indeed, the U.S.’s reserve currency status does bring exorbitant privilege:
- First, it creates demand for dollars, thereby tending to reduce borrowing rates and keep them lower than they would otherwise be.
- Second, such reserves become important and very handy in fighting financial crises.
- Third, there is a big national security element, because a huge percentage of the global financial network essentially goes through U.S. regulators, gaining all kinds of information to ward off terrorist threats, alert intelligence services, and implement sanctions in place of military interventions.
- Fourth, net trade patterns are caused by financial flows, not the other way around, allowing consumers to spend more, and businesses to invest more, than they would be able to otherwise.
On this last point, the US has a structural trade deficit, while the EU has a structural trade surplus, yet the US invests a lot more, as a percentage of GDP, than the EU. In fact, a big amount of the US’s structural net inflow of capital is spent on R&D and data centers to train AI, which is what affords the U.S. to take big investment risk and keep its current innovative edge without reducing household consumption.
America should be grateful that it can suck in the savings of others to fund what they envy so much. For example, Canada holds $2.6 trillion of US securities, contributing capital to American firms, holding down borrowing costs, and boosting the net worth of US households. According to Bloomberg, Canadian holdings are equivalent to more than 40 times the 2024 US goods trade deficit with its northern neighbour. It’s one of the many illustrations of how what may appear to some as a waste of money actually accrues to American interest.
Is the US Dollar Still Dominant? Yes
As it stands today, the dollar is the world’s leading currency because the U.S accounts for 26% of the global economy; remains about the same size as it was in the 1980s; is still the foremost military power; remains at the frontier of technological development, has the deepest, most diversified and liquid market financial market in the world; holds independent institutions that regulate its domestic markets; plus a central bank that acts as a lender of last resort in times of crisis for the rest of the world as a whole.
These are the reasons why 58% of global reserves are in dollars, 81% of world trade is conducted in dollars, 48% of international bonds are denominated in dollars, and 47% of cross-border claims are set in dollars.
There is another area where the dollar leads the world as a currency. The US economy has been able to attract extraordinary amounts of foreign capital for decades, sucking the world dry of capital. The inflow of funds to the U.S. has been driven from destructive investment policies of the European Union, China’s closed economic model, and the uniquely attractive returns of the US as the global innovator. The sheer appetite for claims on the US has reshaped its external balance sheet.
As a result, the U.S. net international investment position – the difference between US residents’ foreign financial assets ($35.89trn) and liabilities ($62.12trn) – was -$26.23 trillion at the end of 2014, representing about 85% of the N-GDP.
Based on the Federal Reserve trade-weighted index, which measures the dollar against the currencies of countries with which the U.S. trades most, the almighty dollar is 5 times more expensive today than it was in 1973, when the Middle-East oil producers hit the world with an oil shock.
Could Something Go Wrong? Yes
In 1971, President Nixon stopped the convertibility of dollars into gold, which led to a floating exchange rate system that was based on a theory that currency reserves would cease to be necessary because the free market price mechanism would make the necessary adjustments to keep the international balance of payments in an acceptance equilibrium. Nonetheless, the system has been subject to a plethora of crises since, notably the Asian crisis of the late 1990s, and the great financial crisis of 2008-09.
As US exceptionalism erodes gradually, and the damaging effects of Trump’s economic nationalism and protectionism grow, the dominant role of the US dollar in the world monetary order is being challenged by three candidates: the EU (euro), the BRICS (yuan), and the Underground Economy (cryptocurrencies). The bottom line here is that the dollar is fraying at the edges. The euro is growing its footprint, the renminbi is breaking free of the dollar, and crypto is ousting the dollar in the world’s underground economy, where governments do not control things, or not much.
Progress has been limited. Nonetheless, a shift away from the dollar is ongoing. But this process could speed-up somewhat, because the Trump administration offers mixed signals. It wants the dollar to weaken against other major currencies, while retaining its status as the anchor of global finance. Scott Bessent, US Treasury Secretary, says the US wants a strong dollar policy, while Horward Lutnick, the Commerce Secretary, promotes the benefits of a weak dollar. Meanwhile, Stephen Miran, chair of the White House’s Council of Economic Advisers, talks about the burden of owning the reserve currency.
Trump’s erratic policies are giving the European Central Bank a prime opportunity to take steps to strengthen the euro’s international role. Its president, Christine Lagarde, is pushing this idea, as a global euro moment, because it would allow the EU currency bloc to enjoy the privileges so far reserved for the US.
In this connection, she has urged the members of the European Monetary Union to maintain a steadfast commitment to open trade, underpinned with security capabilities; to complete a single market by trimming regulations; to build a savings and investment union; and to foster financings at the European level to fund large projects, including defence, thereby creating a deeper pool of securities and a larger bond market – prerequisites for a greater international role for the euro.
This year’s BRICS summit will focus on the creation of a multi-jurisdictional gold custody network, whose vaults are already under construction as the backbone of a new settlement system, where gold is the primary collateral asset, replacing the U.S. Treasury as the standard bearer of trust. Under the plan, gold would serve as the store of value, replacing US Treasuries, and the yuan as the medium of exchange, replacing the US dollar.
According to Kenneth Rogoff, from the IMF and Federal Reserve, who help shape the dollar-led global economic and monetary order, the growing influence of cryptocurrencies is chipping away at the greenback’s global standing. The underground economy already accounts for about 20% of the global GDP, according to World Bank literature. This is about people who pay in cash for amiable services like tips and home services, and for harmful ones like arms dealing, human trafficking, and drugs, plus tax evasion, which is quantitatively larger.
I’ve concluded that the world will slowly move toward a multi-currency power, with the dollar being less dominant than today, but still deeply entrenched. Keep in mind that it reigns in part because the US economy is huge- as big as China, Germany and Japan combined. Remember, too, that talk of the dollar’s demise in the 1990s at the hands of the Japanese yen, and in the 2000s by the euro, did not amount to much.
Ray Dalio has this chart showing how and why empires peak and eventually decline. Education always peaks first, followed by innovation and competitiveness, eventually leading to a fall in the currency reserve status.

BTW:

Source: Apollo via Mike Taylor
(…) “You are going to see a crack in the bond market, OK?” Dimon said during an interview at the Reagan National Economic Forum in California. “It is going to happen.” (…)
Dimon noted that Covid had left the debt markets in disarray in early 2020, until the government responded with several actions that normalized trading and stimulated the economy. But “they massively overdid” it in the years that followed, he said.
Regulations imposed on banks after the 2008-09 financial crisis have left them with less flexibility to hold bonds and other securities on their balance sheets. That makes it difficult for financial firms to step in between sellers and buyers when credit markets freeze up, Dimon said.
Treasury Secretary Scott Bessent and other banking regulators have pledged to loosen capital requirements to let banks hold more Treasurys.
Without substantial changes, the U.S. is headed for a reckoning, Dimon said. “And I tell this to my regulators…it’s going to happen, and you’re going to panic,” he said. “I just don’t know if it’s going to be a crisis in six months or six years.” (…)
A potential debt-market crisis isn’t the only scenario that has Dimon worried. He also believes that if America’s economic and military might erodes, the dollar’s pre-eminent status is at risk.
“If we are not the pre-eminent military and the pre-eminent economy in 40 years, we will not be the reserve currency,” he said. “People tell me we are enormously resilient. I agree with that. I think this time is different. This time we have to get our act together and do it very quickly.”
Dimon acknowledged that China, the primary target of Trump’s trade war, is a “potential adversary.”
“What I really worry about is us,” he said. “Can we get our own act together—our own values, our own capabilities, our own management?”
The U.S. Plan to Hobble China Tech Isn’t Working Chinese solar panels, electric vehicles and drones are better than those made in the U.S. Is AI next?
China’s EVs are cheaper and by many measures better than America’s. The country dominates in consumer drones. Autonomous vehicles have rolled out on the streets of Wuhan and Beijing at a pace that Waymo and Tesla have yet to match. China produces the lion’s share of the world’s solar panels and batteries. And while the U.S. and its allies maintain a narrow lead in advanced microchips and AI, the gap appears to be closing faster than ever.
The result is a fierce debate between senior leaders in the current administration, and critics outside it. White House officials and their proxies are almost uniformly in favor of choking off China’s tech advance by banning the export of AI microchips and the tools to make them. Some outside the administration, including the head of Nvidia, say such policies are backfiring by accelerating China’s development of its own tech ecosystem. (…)
On Wednesday, during an earnings call, Huang doubled down on his criticism, saying “Shielding Chinese chip makers from U.S. competition only strengthens them abroad and weakens America’s position. Export restrictions have spurred China’s innovation and scale.” (…)
Each of Huawei’s latest Ascend 910C AI chips are only one-third as powerful as Nvidia’s, but five times as many are crammed into each of the company’s CloudMatrix 384 AI supercomputers. In terms of raw power, and in the all-important metric of how much memory is crammed into each CloudMatrix computer, Huawei is already beating Nvidia.
And though Huawei’s CloudMatrix 384 requires four times as much electricity, China has a huge advantage in terms of energy production, says Doug O’Laughlin, an analyst at SemiAnalysis who has studied Huawei’s new AI supercomputers. “China has been adding energy production for the past 10 years, and has the entire supply chain on lock to continue to do that,” he adds.
SMIC, which makes Huawei’s processors, is now the third-biggest chip maker in the world, and has managed to innovate in the manufacture of high-quality chips despite having older-generation, pre-export-ban tech.
Bryan Burack, a China analyst at the Heritage Foundation, the conservative DC think tank with significant influence in the current administration, says export controls on tech like AI are more important than ever because the U.S. is in a new Cold War. Burack was a member of the National Security Council until last week, when 100 staffers were cut, and says his time on the council strengthened his convictions on the matter.
“Are we comfortable helping China create dual-use AI that can be used to acquire targets for guided weapons,” Burack says, “even if it’s a sound business?”
Over and over again, China has purchased advanced tech from the U.S. and copied it, then scaled it into huge businesses, a process O’Laughlin likens to a student copying another’s homework. “I sound almost antibusiness saying this, but I really can’t express enough that we shouldn’t make their jobs easier,” he adds. (…)
The better China’s chips got, the more the U.S. attempted to slow down China’s advance, including by banning the export of chipmaking machinery and materials to China.
This doesn’t mean China’s domestic chipmaking ecosystem is equal to what can be marshaled by the U.S. and its allies. But the idea that it is far behind—or will remain so forever—flies in the face of history, says Patrick Moorhead, a semiconductor-industry analyst who was an executive at AMD for 11 years.
“I’ve been in tech for 30 years, and I’ve heard a lot of, ‘Oh, China won’t figure this out,’” he adds. “Now I think the only question is when they will figure it out.” In the long run, China could be in a position to locally source everything it needs to match or even exceed the capabilities of companies like Taiwan’s TSMC and U.S.-based Intel, he says. (…)
In the best of all worlds, the U.S. would have allowed its chip and software champions to continue dominating the domestic Chinese market, says Wang. But since export controls initiated years ago have made that impossible, the only logical way forward may be to keep up the controls—and probably even tighten them.
“What we have now is not the second-best solution, but a seventh-best solution,” says Wang. “There’s certainly no way to restore trust with Chinese companies.”
EARNINGS WATCH
From LSEG IBES:
488 companies in the S&P 500 Index have reported earnings for Q1 2025. Of these companies, 76.0% reported earnings above analyst expectations and 19.1% reported earnings below analyst expectations. In a typical quarter (since 1994), 67% of companies beat estimates and 20% miss estimates. Over the past four quarters, 77% of companies beat the estimates and 17% missed estimates.
In aggregate, companies are reporting earnings that are 6.3% above estimates, which compares to a long-term (since 1994) average surprise factor of 4.3% and the average surprise factor over the prior four quarters of 6.8%.
Of these companies, 63.2% reported revenue above analyst expectations and 36.8% reported revenue below analyst expectations. In a typical quarter (since 2002), 62% of companies beat estimates and 38% miss estimates. Over the past four quarters, 62% of companies beat the estimates and 38% missed estimates.
In aggregate, companies are reporting revenues that are 0.9% above estimates, which compares to a long-term (since 2002) average surprise factor of 1.3% and the average surprise factor over the prior four quarters of 1.2%.
The estimated earnings growth rate for the S&P 500 for 25Q1 is 13.6%. If the energy sector is excluded, the growth rate improves to 15.6%.
The estimated revenue growth rate for the S&P 500 for 25Q1 is 5%. If the energy sector is excluded, the growth rate improves to 5.4%.
The estimated earnings growth rate for the S&P 500 for 25Q2 is 5.5%. If the energy sector is excluded, the growth rate improves to 7.4%.

The Moline, Ill.-based farm equipment manufacturer on May 15 said it incurred about $100 million in tariff expenses in the latest quarter and expects more than $400 million in additional expenses through the end of its fiscal year in October. The company booked $7.1 billion in net income for the year ended last October, down 30% from a year earlier, and roughly $45 billion in net sales, down 19%.
At the same time as new tariff costs, Deere and other manufacturers continue to face weak demand for farm equipment from farmers grappling with lower crop prices and higher production costs. (…)
Deere said soft demand for equipment and significant past price increases due to inflation have tempered the company’s desire to raise prices. The company expects to raise prices in some cases, not necessarily due to tariffs, but also as a result of general inflation, Jepsen said.
Deere has already begun rolling out price increases of 2% to 4% for its early order program for sprayers and planters for the 2026 model year in response to inflation. The company hasn’t added tariff surcharges to prices during the year ending in October, Jepsen said. (…)
Deere has said that about 80% of the equipment it sells in the U.S. is manufactured there, and roughly three-fourths of its suppliers are based in the country. Nevertheless, its international operations play a critical role in its supply chain. The company attributes 60% of its estimated $500 million tariff cost to levies on goods from the European Union, Mexico and China.
Deere’s calculation also factors in potential retaliatory tariffs on the U.S., which would affect its exports around the world, according to Jepsen. “We have a lot of focus on how we ensure that we stay competitive on those export markets because it is an important part of the volume that we produce in our U.S. factories,” he said. (…)
Meanwhile, “M&A activity has reached a 20-year low; with the more recent drop linked to multiple sources of uncertainty driving decision paralysis and wait-and-see mode for many corporate teams.” (Callum Thomas)

Source: Reuters via @MichaelAArouet


Data: Redfin. Chart: Axios Visuals


