It’s been a while…You may need a long weekend to go through all these accumulated links and stuff.
-
The Next Perfect Banking Storm
-
Andy Hall: Oil Prices Could Be Headed To $80 In Next 12 Months
-
A Different Take on Brexit
-
Ranking America’s industries by profitability and tax rate
It doesn’t get nearly as many pixels as the gross domestic product figures or the trade balance, but America’s statisticians also capture detailed industry-level data on sales, labour costs, taxes, profits, and other input costs. We’ve started exploring these tables and thought we’d share some of what we’ve found so far.
First, here’s a chart showing earnings before interest, tax, depreciation, and amortisation as a share of total revenues by industry sector, as well as corporate tax paid as a share of Ebitda:

(Everything in this post is based on averages from 2011 through 2014, the latest available data. Our source is the Bureau of Economic Analysis KLEMS tables on the “composition of gross output”. Official BEA defintions here.)
Across the American private sector, companies have an ebitda margin of about 28 per cent, and pay about 15.5 per cent of these earnings in net tax.
Focusing only on the goods-producing industries — mostly manufacturing, but also construction, mining, oil and gas, agriculture, and forestry — profit margins are a bit lower (22 per cent), while effective tax rates are significantly lower (7.4 per cent). Businesses in the services sector, which covers everything from waste management to restaurants to law firms to software companies, have average ebitda margins of 30.6 per cent, and pay about 18.2 per cent of ebitda in net tax.
Another way of reading this: goods-producing industries account for 31.2 cent of American gross output (sales) but only 24.9 per cent of total ebitda and just 11.8 per cent of net tax paid by companies.
There is much wider variation when you look at a more detailed industry breakdown. We organised the data into 46 industry groups, the largest of which (Other) accounts for only 7.5 per cent of total private gross output. The median industry accounts for about 1.5 per cent of total private gross output and the average industry accounts for about 2.2 per cent.
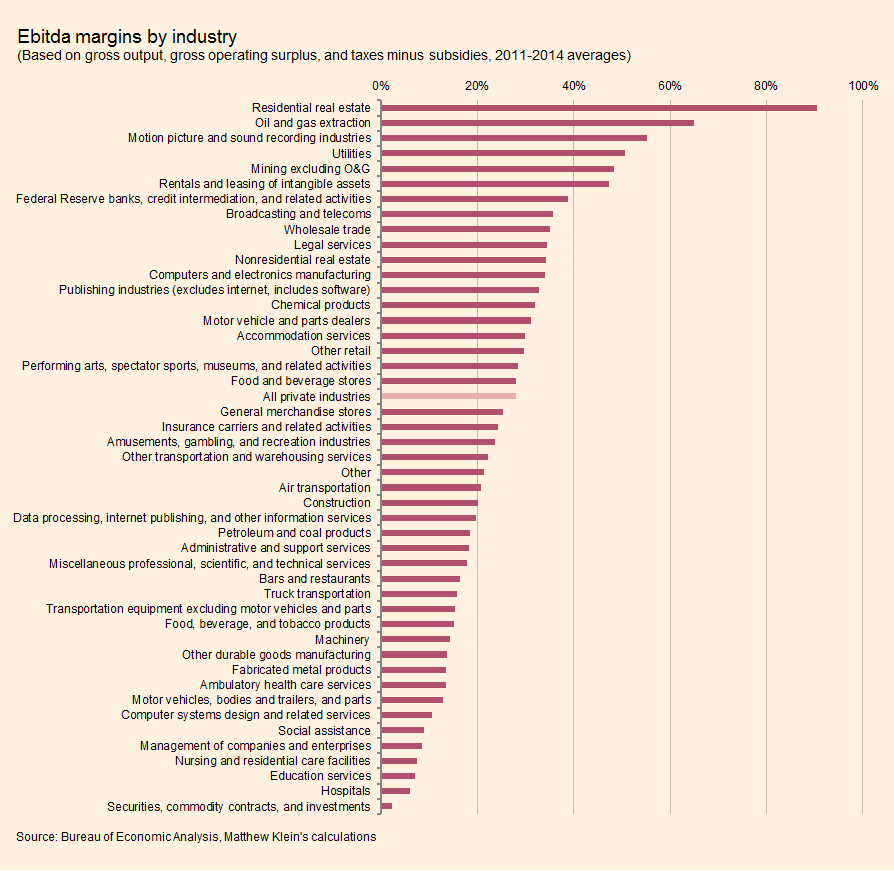
The chart below ranks these 46 industry categories by their ebitda margin:

At one extreme is residential real estate services, which have a staggering ebitda margin of 90.4 per cent. Combine that with the industry’s relatively large size and it turns out the business of selling and renting housing is responsible for nearly a quarter of the earnings before interest, tax, depreciation, and amortisation generated by the entire American private sector:

At the other end are schools, hospitals, and investment banks, which all have ebitda margins at or below 7 per cent.
Some of this variance reflects differences in business models. One of the drawbacks of using ebitda as a measure of profitability is that D can be very important. Companies in oil and gas extraction, mining, utilities, and telecoms need to spend large chunks of their operating cash flow on maintaining and replacing their investments in physical capital before any money is available to return to creditors or shareholders.
The flipside of this is labour compensation. For residential real estate, less than 1 per cent of revenues go to pay employees. In schools, health services, and investment banking, about half of revenues are paid to workers, although “computer systems design” workers nab the biggest share of the pie for themselves, with 58.1 per cent:

What about tax?
Once again, there is enormous variation across industries. First, let’s look at taxes minus subsidies relative to total ebitda:

Much of this reflects differences in investment spending, which gets deducted from the tax bill. Some may also reflect skills at exploiting the limits of the law to minimise tax owed, which could help explain the exceptionally low tax rates on software publishing, “data processing and other information services”, and “miscellaneous professional and scientific services”. Finally, we shouldn’t underestimate the importance of using interest deductability to minimise tax owed, which might explain the low tax rates paid by nonresidential real estate firms, as well as “administrative and support services”.
The last chart we’ll show you today is net tax as a share of total sales:

There is an intriguing symmetry in the tax rates paid by industries at different points in the supply chain for the same product.
Manufacturers of motor vehicles and parts pay among the lowest in tax, relative to sales, of any industry in the US private sector. By contrast, dealers who actually sell those cars and parts to the public pay among the highest tax rates, relative to sales, of any industry. Companies in the business of selling residential real estate pay high tax rates, relative to sales, while construction firms, which actually build the real estate, pay almost no tax, relative to sales.
Petroleum and coal products manufacturers — companies that refine raw materials into usable fuel — pay the lowest share of revenues to the tax man. By contrast, companies in the oil and gas extraction and mining industries, which create the raw materials used as inputs for the petroleum and coal makers, pay significantly higher tax, as a share of sales, than the average across the private sector.
We don’t pretend to have any deep insight into why this might be, although it’s reassuring the tax (sometimes) seems to get paid somewhere along the line.
In a subsequent post we’ll look at how other input costs vary across sectors.


-
Alibaba has a huge plan to train 1 million teenagers to run online businesses
-
Should You Buy A Company After A Dividend Cut?
-
The Obama Doctrine The U.S. president talks through his hardest decisions about America’s role in the world.
-
Virtual reality adoption and the weekly roundup in tech and retail by Leah Grace