ADVANCE MONTHLY SALES FOR RETAIL AND FOOD SERVICES, OCTOBER 2019
Advance estimates of U.S. retail and food services sales for October 2019, adjusted for seasonal variation and holiday and trading-day differences, but not for price changes, were $526.5 billion, an increase of 0.3 percent (±0.4 percent)* from the previous month, and 3.1 percent (±0.7 percent) above October 2018. Total sales for the August 2019 through October 2019 period were up 3.8 percent (±0.5 percent) from the same period a year ago. The August 2019 to September 2019 percent change was unrevised from down 0.3 percent (±0.2 percent).
Retail trade sales were up 0.3 percent (±0.4 percent)* from September 2019, and 2.9 percent (±0.7 percent) above last year. Nonstore retailers were up 14.3 percent (±1.4 percent) from October 2018, and gasoline stations were down 5.0 percent (±1.2 percent) from last year.
Stalling?
U.S.-China Trade Deal Near, but Trump Not Ready to Sign Off, Kudlow Says Negotiators have been working to come up with a written ‘phase one’
(…) “The mood music is pretty good,” he said, adding that Mr. Trump “likes what he sees, he’s not ready to make a commitment, he hasn’t signed off on a commitment for phase one, we have no agreement just yet for phase one.” (…)
Elsewhere:
-
China has reiterated its position that removing existing tariffs is a precondition of reaching a deal. (Bloomberg)
-
U.S. attorney-general says Huawei and ZTE ‘cannot be trusted’
-
Further complicating trade talks, the Senate is preparing for accelerated passage of a law to support pro-democracy protesters in Hong Kong by placing the city’s special trading status under annual review. This bill is slightly different than the House’s version, so the two must be reconciled before moving to President Trump for signature. Beijing and Hong Kong strongly object to the legislation. (Fortune)
-
At least one deal may be moving forward. Nancy Pelosi said she’s aiming to have the stalled U.S.-Mexico-Canada free trade agreement approved by the House this year, a sign that Democrats’ negotiations with the Trump administration are wrapping up. The speaker believes an agreement is “imminent.” (Fortune)
Powell Sees Few Risks Likely to Derail Record U.S. Expansion
(…) “Our forecast is, and our expectation very much is, one of continued moderate growth,” Powell told the House Budget Committee Thursday in Washington. “The U.S. economy is the star economy these days,” he said during the second day of testimony before Congress. “There is no reason to think that I could see that the probability of a recession is at all elevated at this time.” (…)
Powell played down the risks of an overheated economy. He said this expansion was “notable” for its lack of sectors that are “really hot” such as the technology sector or housing markets during the last two business cycles.
“I would say this expansion is on a sustainable footing,” Powell said. “We don’t see the kinds of warning signs that appeared in other cycles yet.” The same goes for financial markets, which “don’t have this notable build-up of leverage broadly across the economy, which is troubling from a financial stability standpoint.”
“There is no reason why it can’t last, at the risk of jinxing us, in principle there is no reason to think that I can see that the probability of a downturn is at all elevated,” Powell said. (…)
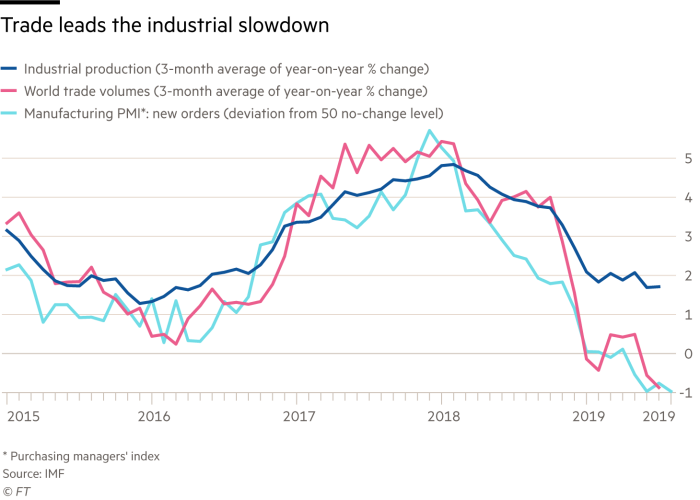
Economic Outlook from Freight’s Perspective
- With the –5.9% decline in October, following the string of declines in May through September (ranging from -3.0% to -6.0%), we repeat our message from the previous five months: the shipments index has gone from “warning of a potential slowdown” to “signaling an economic contraction.
We acknowledge that: all of these negative percentages were against tough comparisons (some extremely tough), and the Cass Shipments Index has gone negative before without being followed by a negative GDP. However, demand is weaker across almost all modes of transportation, both domestically and internationally.
Several key modes, and key segments of modes, are suffering material increases in the rates of decline, signaling the contraction is getting worse.
We know that freight flows are a leading indicator, so by definition there is a lag between what they are predicting and when the outcome is reported. Nevertheless, we see a growing risk that GDP will go negative by year’s end.
The weakness in spot market pricing for many transportation services, especially trucking, along with recent airfreight and railroad volume trends, heightens our concerns about the economy. Weakness in commodity prices, and the ongoing decline in interest rates, have all joined the chorus of signals calling for an economic contraction.
The Index on a 2-year percentage change basis went negative (-0.1%). This suggests that the great surge of 2018, or ‘Trump bump’ as it was characterized by many, has now been completely erased at least from a freight flow perspective, as measured by the volume of freight bills paid by Cass.

Beyond our concern that the Cass Freight Shipments Index is negative on a YoY basis for the eleventh month in a row:
We are concerned about the increasingly severe declines in international airfreight volumes (especially in Asia) and the ongoing swoon in railroad volumes, especially in auto and building materials;
We see the weakness in spot market pricing for transportation services, especially in trucking, as consistent with and a confirmation of the negative trend in the Cass Shipments Index;
As volumes of chemical shipments have lost momentum, our concerns of the global slowdown spreading to the U.S. increase. We see this as confirmed by the deterioration in the ISM to levels below 50 for the last 3 months (49.1, 47.8, and 48.3). The trade war looks as if it has reached a ‘point of no return’ from an economic perspective, as the rates of decline are accelerating. (…)
Allow me to interject here to mention that the Markit U.S. Manufacturing PMI is now giving a more positive signal than the ISM. Markit’s PMI surveys have proven more accurate in recent years.

That said, the Cass Shipment Index is worrisome, even more so when we see that the Chemical Activity Barometer has turned down again:


We should note that dry van trucking volume has historically been a fairly reliable predictor of retail sales (container volume serves a similar role). When studied using the DAT Dry Van Barometer, current demand has fallen below capacity, which suggests that the consumer economy is less healthy than it is widely believed to be and that retail sales are poised to disappoint. We should also point out that this is a period which seasonally should be seeing much stronger volumes. This makes us even more cautious about the outlook for demand for 4Q. (…)

U.S. Producer Prices Increase As Energy & Food Prices Strengthen
The Producer Price Index for final demand rose 0.4% during October (1.1% y/y) and reversed the 0.3% September decline. A 0.3% gain had been expected in the Action Economics Forecast Survey. Producer prices excluding food & energy rose 0.3% last month (1.6% y/y) after a 0.3% decline. A 0.2% rise had been expected. The PPI excluding food, beverages and trade services, another measure of underlying price inflation, edged 0.1% higher (1.5% y/y) last month after holding steady in September. (…)
Prices for core goods for final demand held steady (0.6% y/y) after easing 0.1% in September. Core finished consumer goods prices rose 0.1% (1.6% y/y) for the third time in the last four months. Core nondurable consumer goods costs improved 0.2% and the y/y change fell sharply to 2.2%, down from a high of 3.8% in September of last year. Durable consumer goods prices declined 0.2% (+0.8% y/y) after slipping 0.1%. Passenger car prices weakened 1.5% (+0.2% y/y) but appliance prices rose 0.9% (NSA, 3.0% y/y). (…)
Services prices strengthened 0.3% (2.0% y/y) after declining 0.2%. Trade services prices surged 0.8% (2.2% y/y) and recovered most of September’s weakening. (…) Services prices less trade, transportation & warehousing edged 0.1% higher (1.9% y/y) following two months of strong increase.
Construction costs strengthened 0.4% but the y/y increase weakened significantly to 3.9%. (…)
Prices for intermediate demand rose 0.4% (-3.7% y/y) following two months of decline.

")
Looks like 2.0% is still the norm, unless you are selling core goods where noflation reigns.
")
EARNINGS WATCH
We now have 458 company reports in. Actual earnings growth for the 458 companies having reported so far is –0.5% on revenue growth of +4.1%. The beat rate is 74%, the surprise factor +4.5% and the blended growth rate –0.4% (+2.1% ex-Energy), down from +0.3% on July 1
By comparison, after 463 reports during Q2, the beat rate was 73%, the surprise factor +5.5% and the blended growth rate +2.9%, up from +0.3% on July 1. Actual earnings growth for the 463 companies having reported was +3.1% on revenue growth of +4.9%.
Excluding the effect of buybacks, Refinitiv estimates that Q3 net income declined 2.5% on revenues up 3.8%, a marked deterioration from Q2 when net income rose 2.0% on revenues up 4.7%. Q4 net income is currently expected to decline 2.2% on revenues up 4.0%. This revenue growth estimate looks on the high side given the decelerating GDP growth rate and soft inflation numbers.
On the other hand, buybacks will boost EPS by 2.4% in Q4 and 2.5% in the first half of 2020 from +2.1% in Q3’19 and +1.2% in Q2’19.
Trailing EPS are now $163.90, down from $164.29 at the same time in Q2 and 0.3% lower than the $164.43 and $164.31 at the end of August and September respectively.
Q4 estimates keep being ratcheted down to +0.2% (+2.4% ex-Energy from +5.0% 2 weeks ago). This is down from +4.1% on Oct.1.
TECHNICALS WATCH
Stock-Market Technical Indicators Flash Warning Traders were abuzz this week after two technical indicators, the “Hindenburg Omen” and “Titanic Syndrome,” flashed in unison—an unusual event that sometimes precedes a selloff.
On Tuesday, both indicators turned on at once, according to SentimenTrader, a research firm that uses versions of the two indicators based on the Nasdaq Composite Index.
The Hindenburg Omen flashes when the numbers of stocks reaching both fresh highs and fresh lows pass certain thresholds. SentimenTrader looks at the number of stocks in the Nasdaq that have reached 52-week highs and 52-week lows on a given day. For the indicator to turn on, both of those numbers must exceed 2.8% of the total number of stocks in the Nasdaq that have either advanced or declined that day. A couple other conditions apply too.
The Titanic Syndrome is designed to highlight when there has been a jump in the number of stocks doing poorly, amid a market that is generally doing well. SentimenTrader’s version turns on when the Nasdaq-100 has closed at a 52-week high some time during the past seven trading sessions, and new 52-week lows for stocks in the Nasdaq Composite outnumber 52-week highs.
The last time the indicators flashed in unison was July 18, according to SentimenTrader, not long before stocks sold off sharply amid fears of a possible recession. It also took place in October 1987 and March 2000, ahead of big crashes—although at other times the two indicators flashed together and not much happened afterward. (…)
Both indicators are binary, meaning they are either on or off, and both are designed to show when cracks are emerging in a market that has been on an upswing. (…)
The facts from SentimenTrader’s data:
Since 1986, there have been 16 such occurrences. Ten were followed by negative 1-year returns on the NDX averaging –16.6%. The 6 positives returned 14.0% on average the following year.
Of the 10 negatives, 4 were part of multiple warnings during the same year (1987 :2; 2007:3 and 2018:2). Excluding the multiple warnings, there have been 11 occurrences with 6 negative (average: –22.7%) and 5 positive (+15.7%).

But ST’s Jason Goepfert adds this important warning:
It was very rare to see these trigger, and not see weakness in the Composite over the next couple of months. The signals in 1991 and 1996 managed it, but other than that, not so much. It was also a bad sign for the broader market, with the S&P suffering a poor risk/reward ratio. If these start to trigger for the NYSE as well, then it’ll be even more reason to worry.
With 52-week lows swamping new highs on the Nasdaq on Thursday, both warning signs triggered again. It’s very rare to see both signals trigger on consecutive days. It’s only happened 7 other times in 33 years.
The losses here tended to be more severe. The 1996 instance again managed to avoid any real weakness, and in 2007 it took a while before the gains were reversed. But overall, the risk/reward after consecutive “double trouble” signals was exceptionally poor. (…)
It’s not the only warning. We’ve touched on some “participation problems” a few times in recent weeks, and they seem to be getting worse.
Over the past 7 sessions, the S&P managed to show a gain, but breadth on the NYSE was negative 6 of the 7 days. Negative breadth, in this case, simply means more declining than advancing securities, i.e. an Up Issues Ratio below 50%.
Lowry’s Research also notes weak participation in recent uptrends.
Kissinger warns of ‘catastrophic’ conflicts between China and US
Conflict between the United States and China will be “inevitable” and result in “a catastrophic outcome” that “will be worse than world wars” unless the countries settle their differences, according to former US secretary of state Henry Kissinger.
“We are in a difficult period now. I am confident the leaders on both sides will realise the future of the world depends on the two sides working out solutions and managing the inevitable difficulties,” he said at an event hosted by the National Committee on US China Relations in New York on Thursday.
“There is no doubt many aspects of the evolution of China are challenging to the US,” the 96-year-old said. “It never happened before that two major countries in different parts of the universe were in similar positions.”
But they must understand that a permanent conflict between them could not be won and would end in “a catastrophic outcome” for Beijing and Washington, he said. (…)
“It’s no longer possible to think that one side can dominate the other,” he said. “They have to get used to the fact that they have that kind of a rivalry.” (…)