Inflation Eases for Third Consecutive Month Consumer spending rose 0.1% in May
The Fed’s preferred measure of inflation, the price index for personal-consumption expenditures, rose 1.4% in May from a year earlier, the lowest level in six months, the Commerce Department said Friday. Excluding the often-volatile categories of food and energy, so-called core prices were also up 1.4%, the lowest level since December 2015. (…)
Personal-consumption expenditures, a measure of household spending on everything from new cars to medical care, increased a seasonally adjusted 0.1% in May from the prior month, the Commerce report said. The measure had risen 0.4% the prior two months.
Instead of splashing out, Americans saved more, boosting the personal-saving rate to 5.5%, its highest level in eight months. (…)
Personal income, a measure that includes wages, government assistance and other sources, climbed 0.4% from April, buoyed by a big jump in dividend payments. Wage growth was only 0.1%.
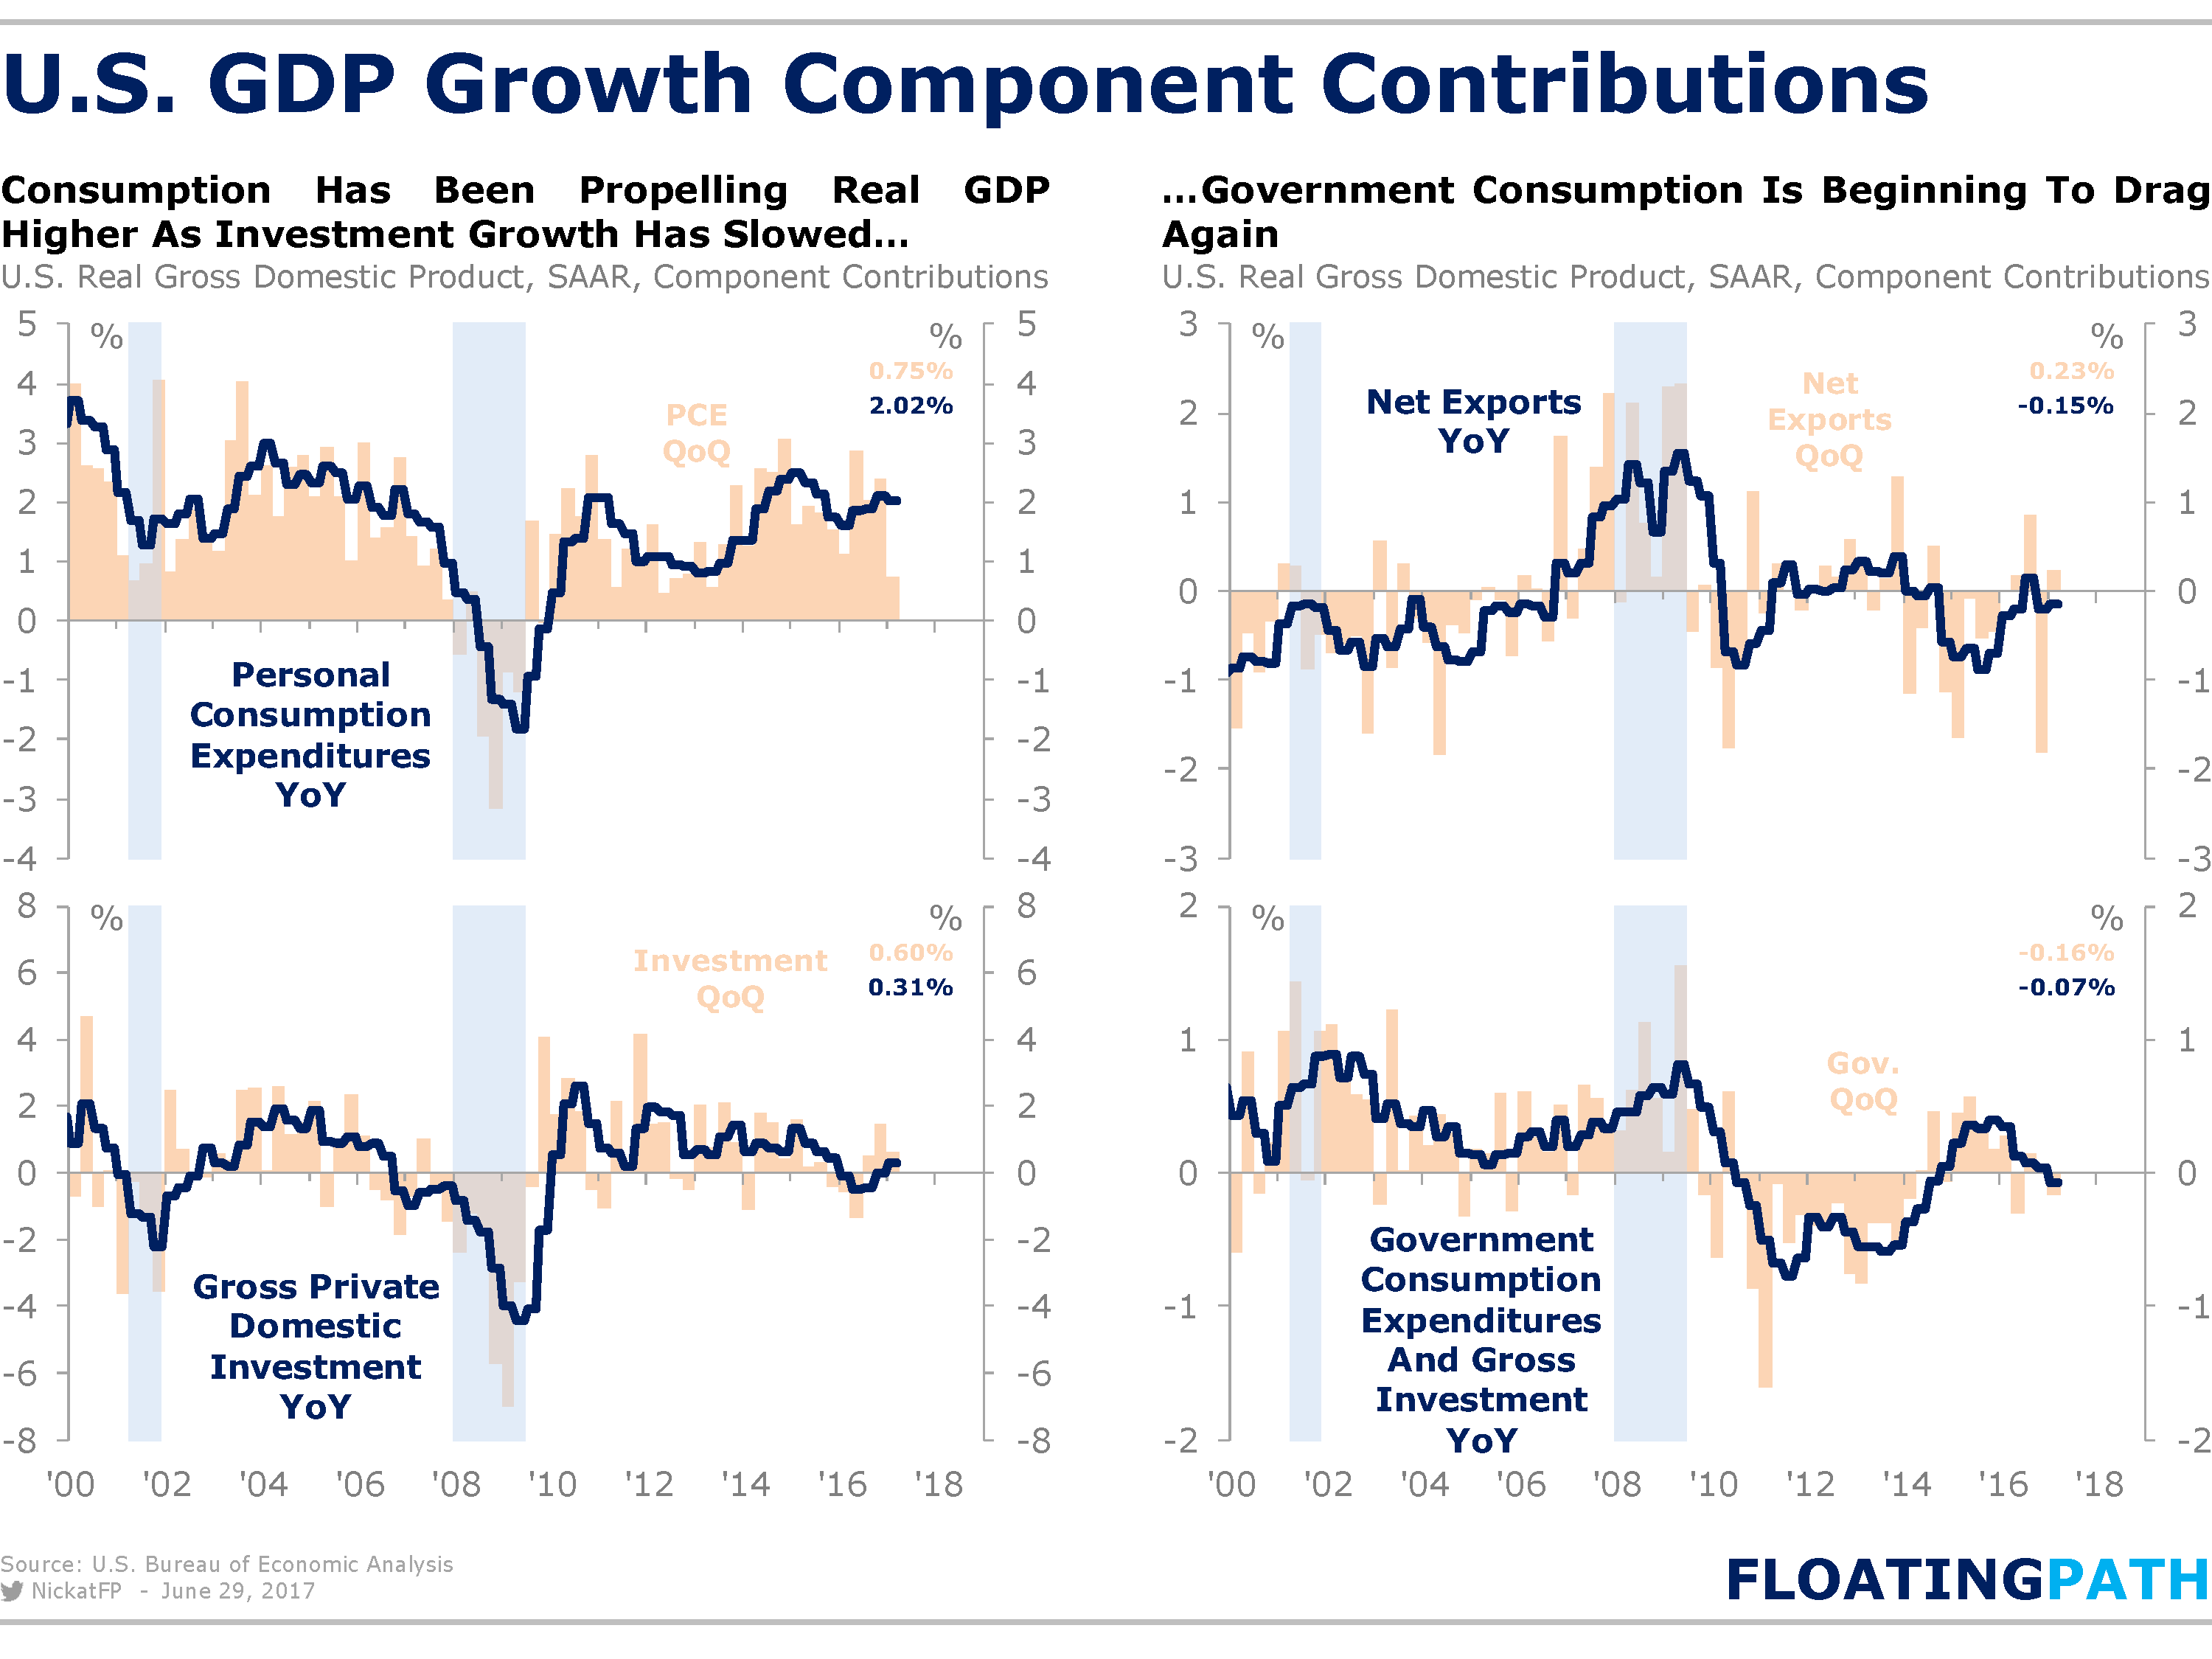
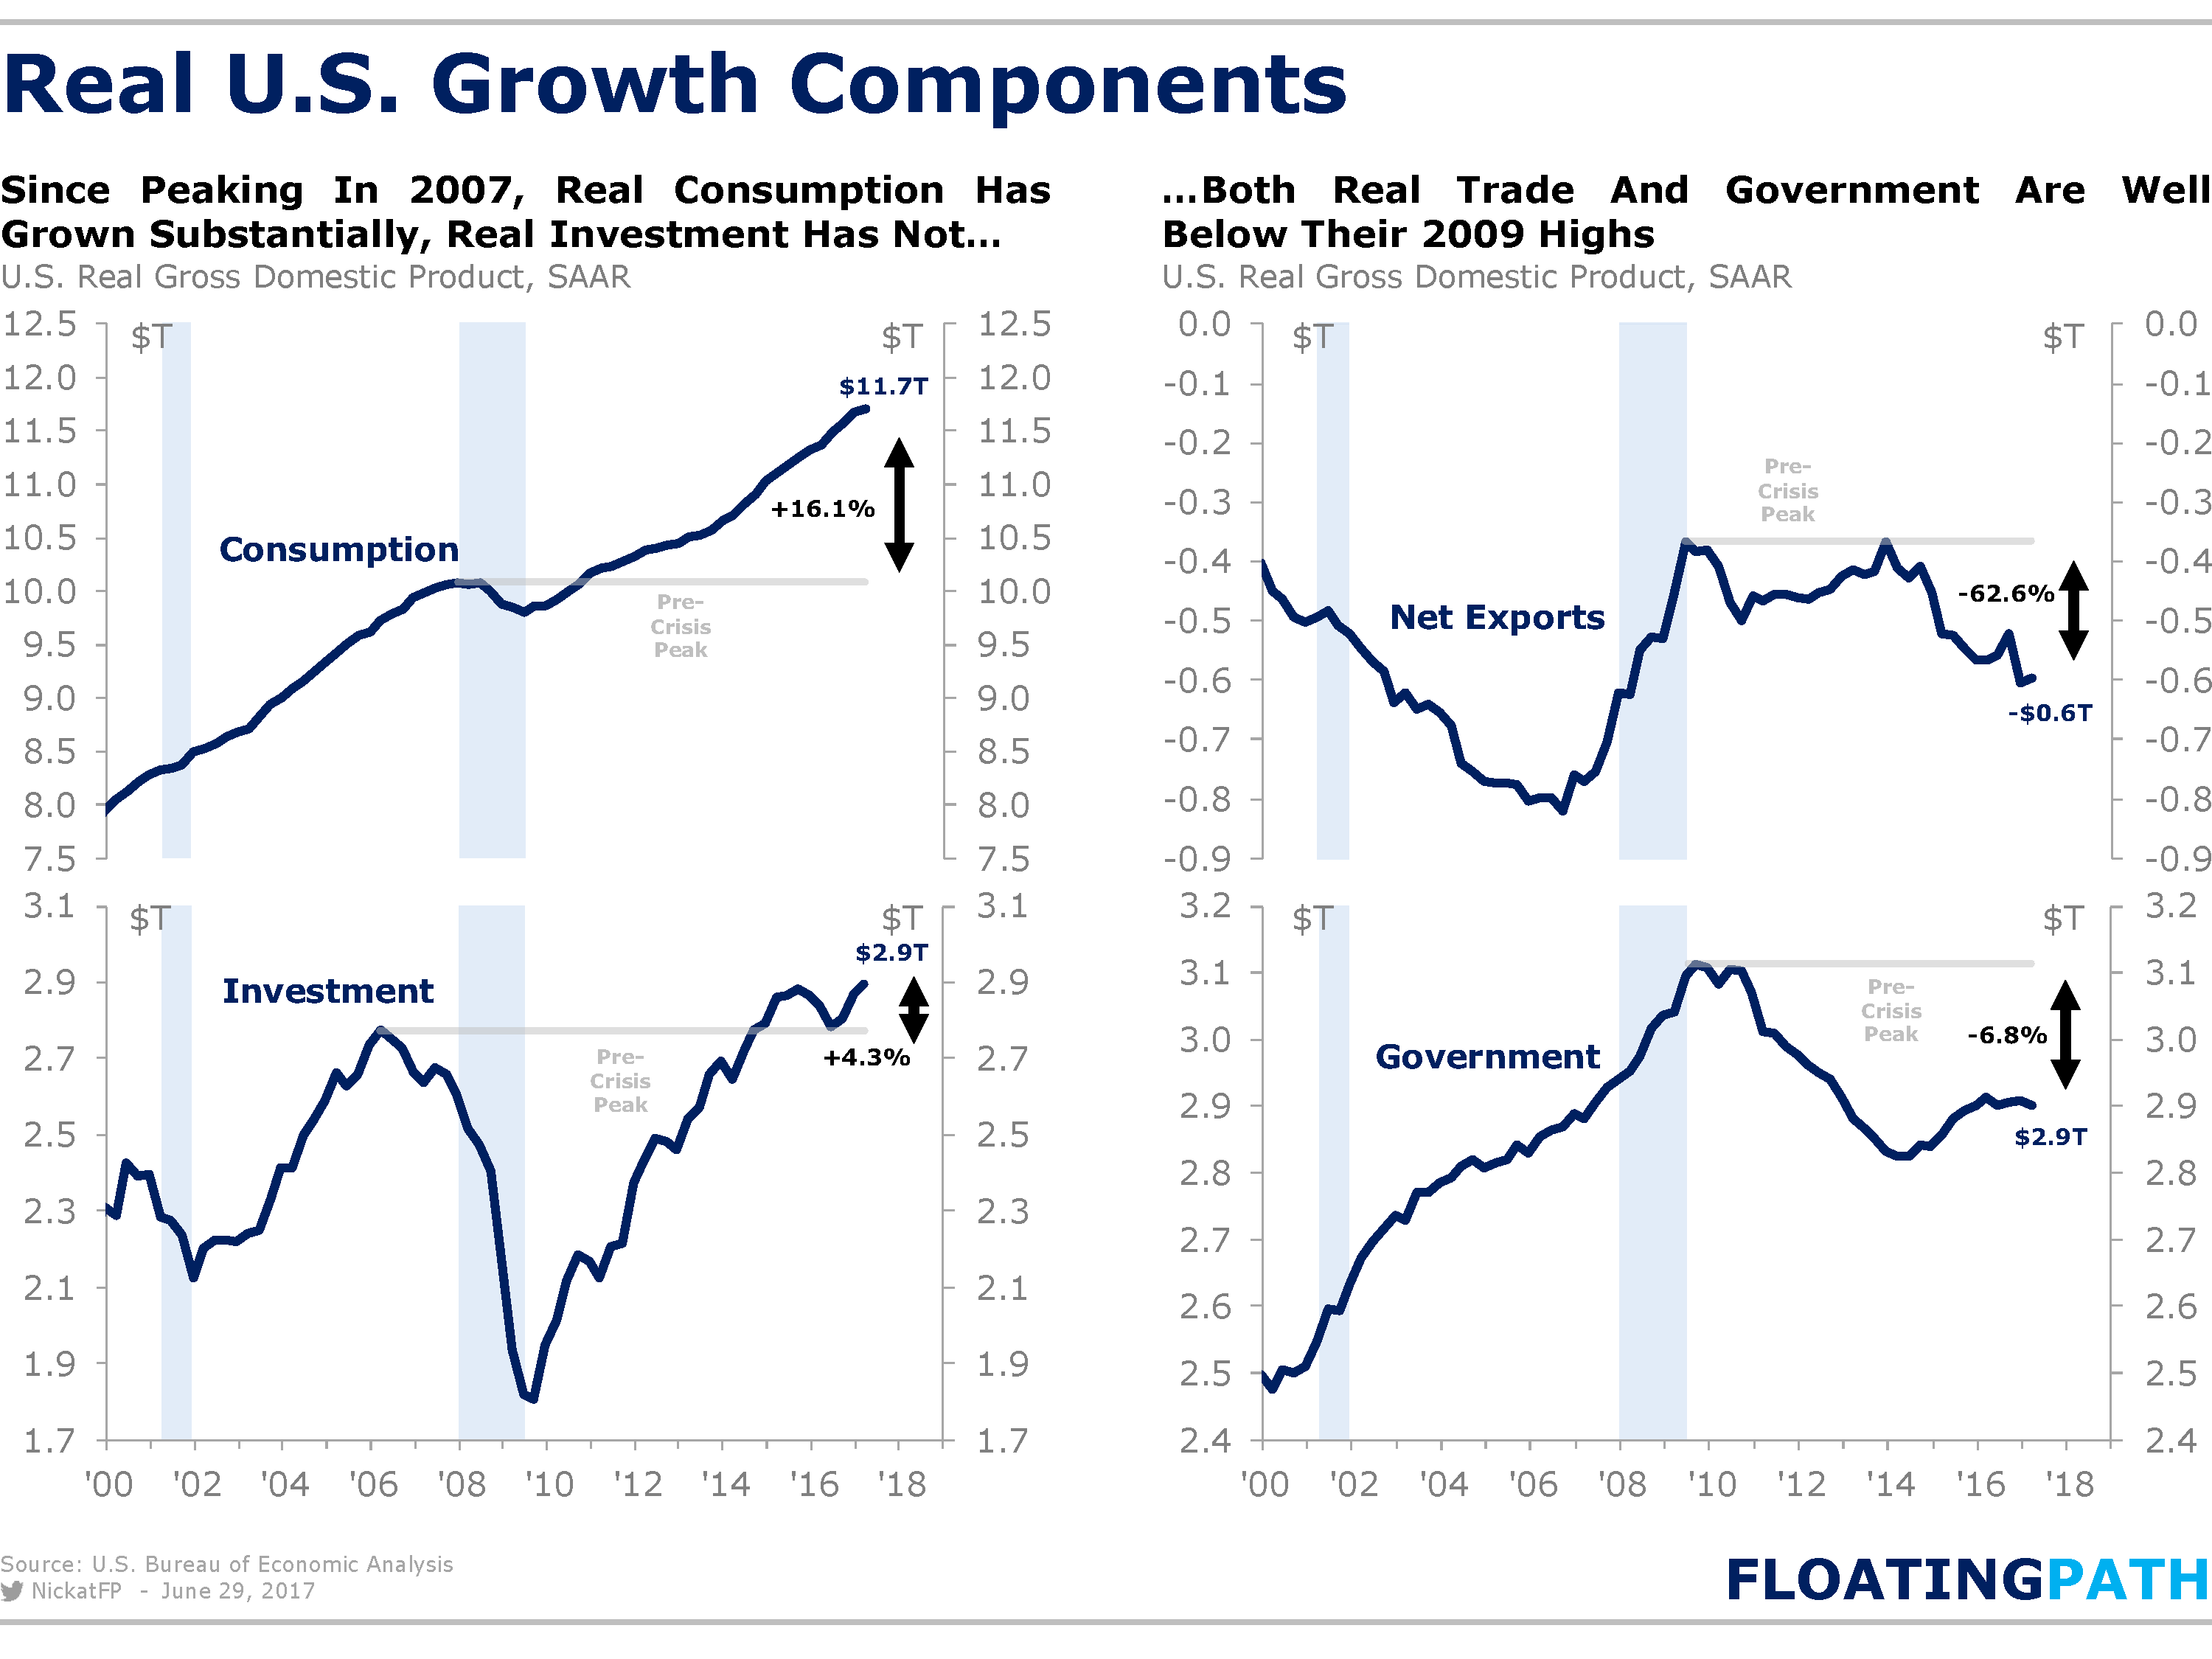
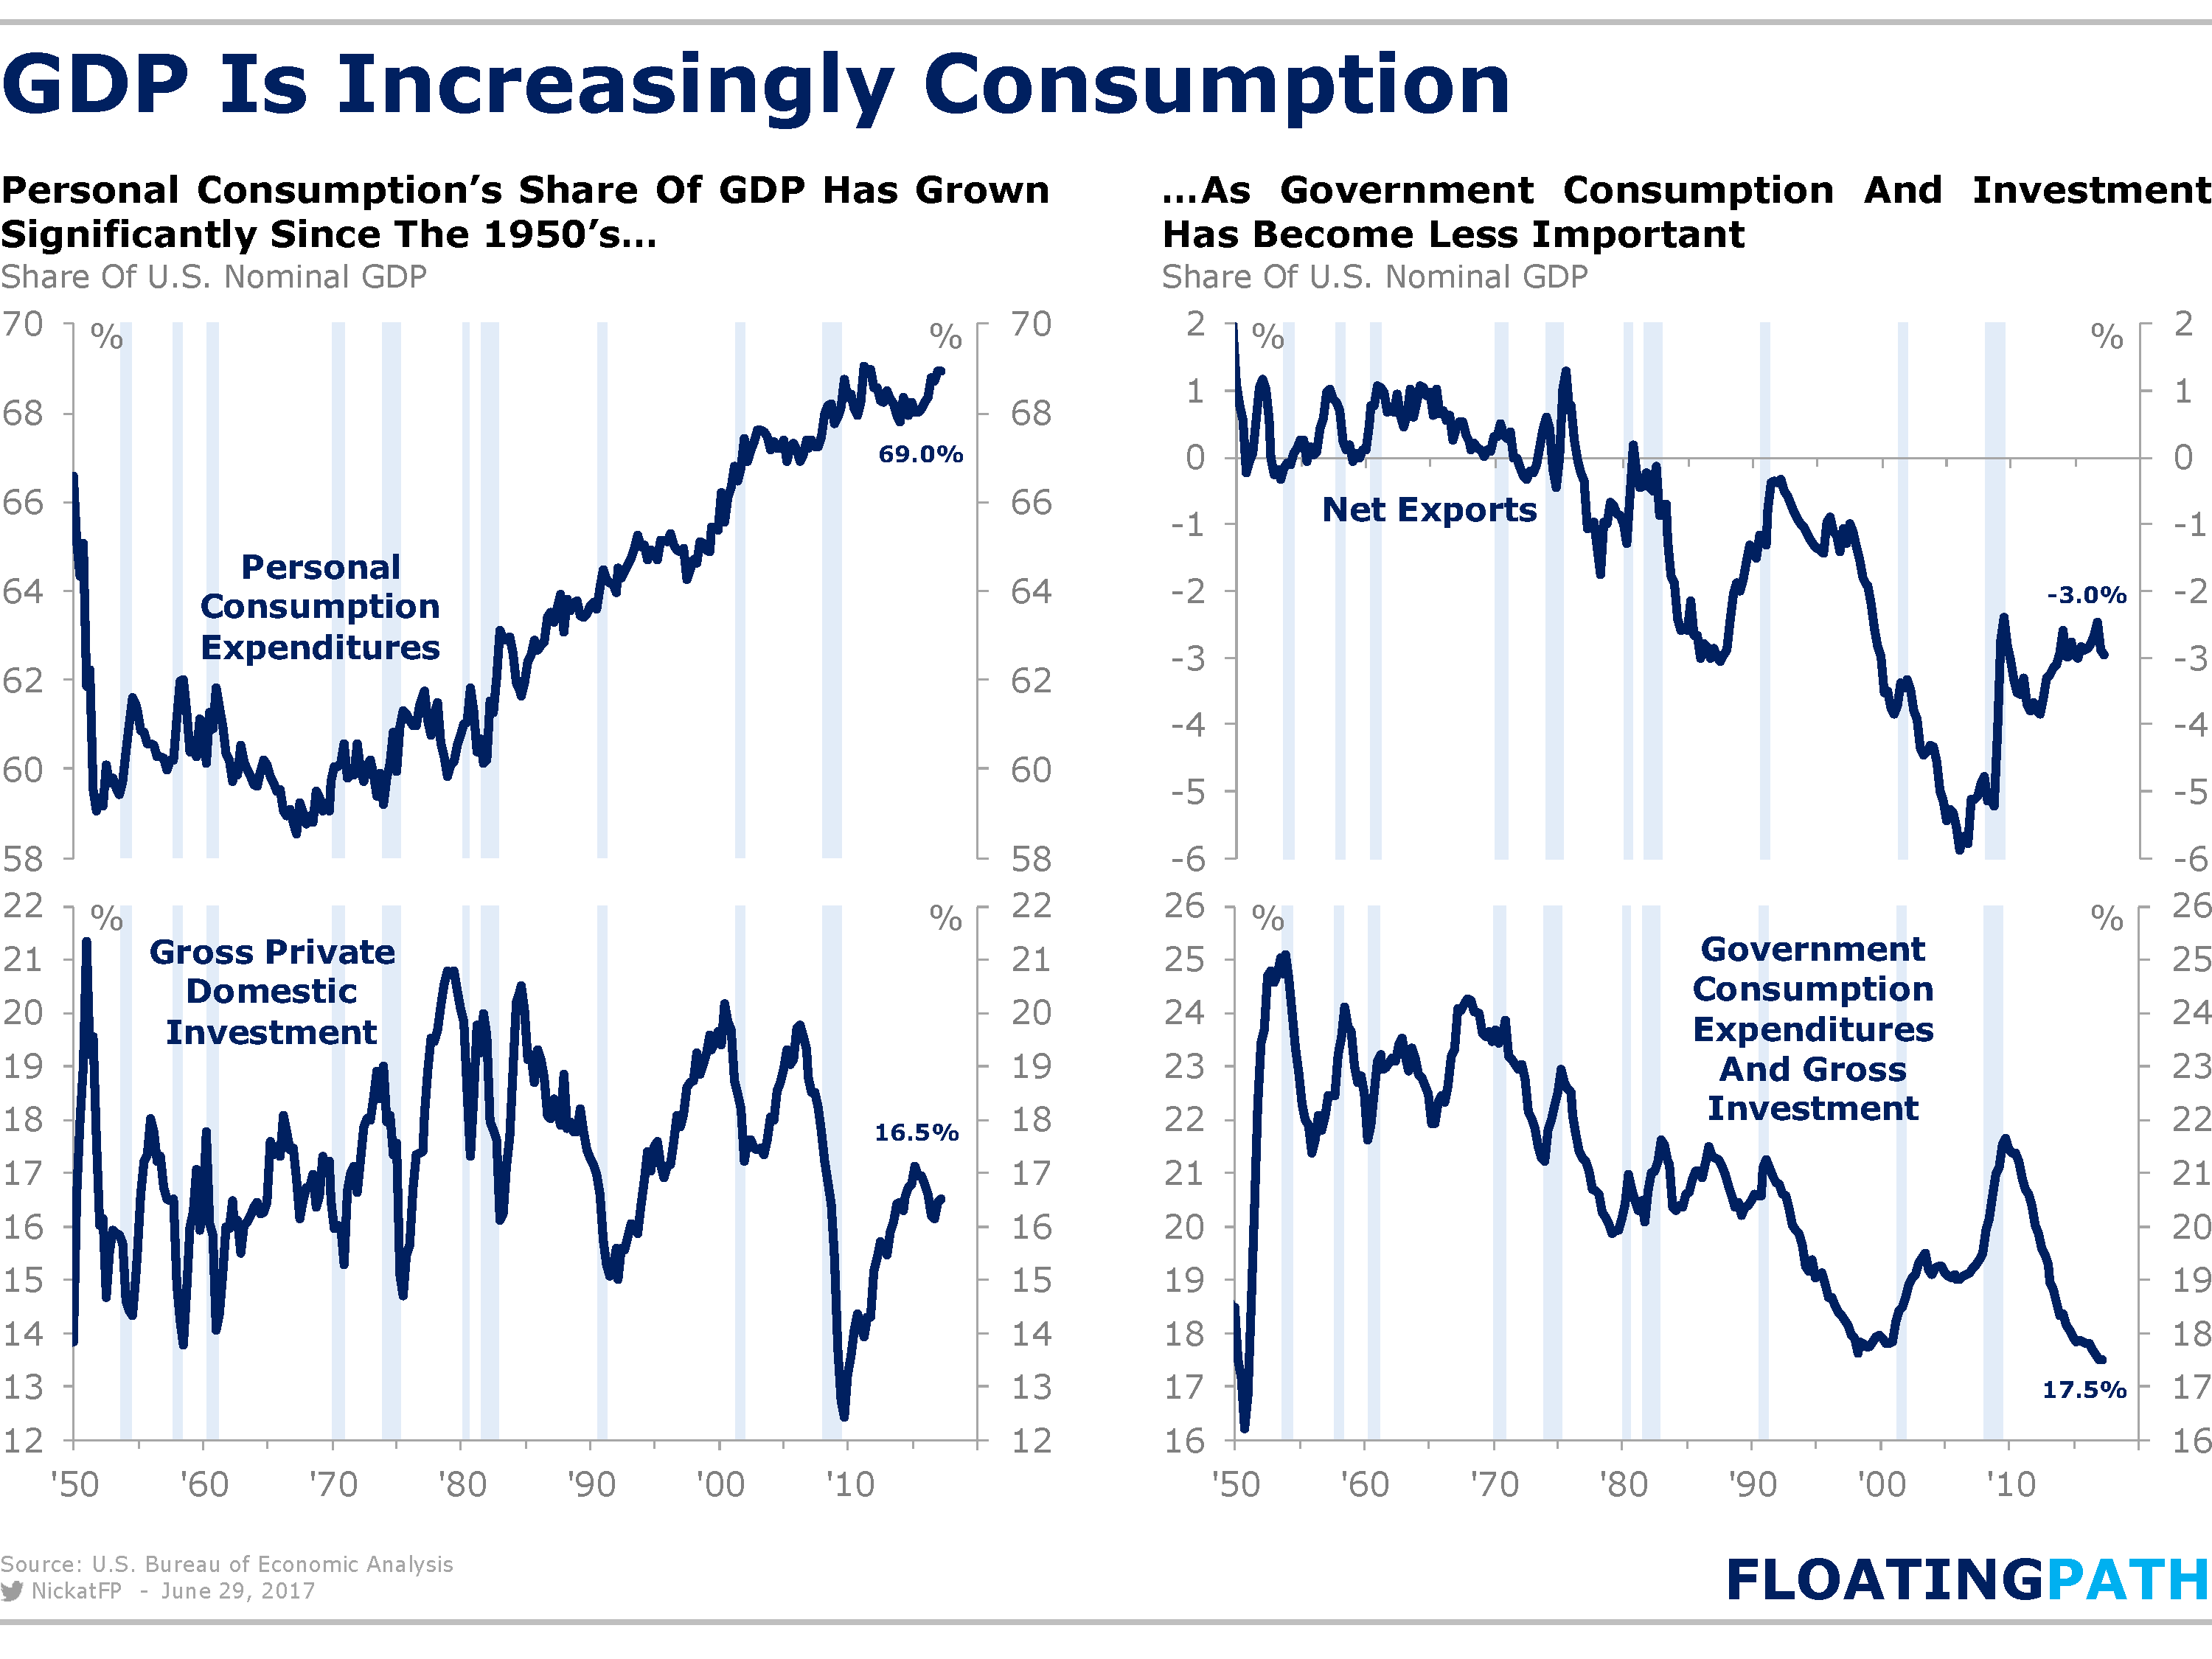
That’s all the WSJ says about the recent stats from perhaps the most crucial area of the U.S. economy! The consumer is the only thing keeping the economy afloat. Let’s dig a little deeper:
- Personal income growth is accelerating (+3.6% a.r. in last 3 months) but wages and salaries are not keeping pace (+2.4%).
- Disposable income growth is also accelerating (+4.0% a.r.) and consumption expenditures are almost keeping pace (+3.6%).
- Total inflation (PCE) was down 0.5% a.r. in last 3 months. Core PCE is +0.3% a.r..
- As a result, real disposable income is +4.9% a.r. in the last 3 months and real expenditures +3.6%.
Overall, these are good enough to sustain the economy. David Rosenberg contends that the key stat is labor income which is growing too slowly to incite consumers to spend on discretionary items like cars, furniture and appliances, home improvement, recreational goods and services and restaurants. For most Americans, spending on essentials like food, clothing, health care, rents and utes consumes most of their weekly paycheck. If the savings rate is going up, it’s because the top 10% are spent out.
In all, the economy does not seem about to accelerate much.
The debate on the Fed possibly making a big policy mistake will get more intense with the inflation data showing the core PCE deflator at +1.4% YoY, down from +1.8% in January, and the core CPI at +1.7%, down from +2.3% in January. Since last December, both measures are +1.3% annualized. Last 3 months: +0.3% a.r. for core PCE, zero for core CPI.

Another way to look at it:

Source: @jbjakobsen, @josephncohen (via The Daily Shot)
And oil and most non-edible commodities are falling…
Scott Minerd, Global CIO, Guggenheim Investments:
In a manner reminiscent of the Greenspan “conundrum” from the 2004–2006 hiking campaign, today long-term yields are falling while the Federal Reserve (Fed) raises short-term rates. The fed funds rate target range is now 100 basis points higher than it was before the current hiking cycle began, but the 10-year Treasury yield is 13 basis points lower. There are three possible explanations for this yield curve behavior:
Rather than being accommodative, the Fed may actually become more restrictive than it expects. The Fed is projecting longer-run inflation at 2 percent, but if the market perceives that inflation is going to stay around 1.5 percent or lower, then the Fed could actually be ahead of the curve on inflation, and a lot closer to the end of tightening. The growing list of categories experiencing downward price pressure, including commodities, energy, apparel, retailing, owner-occupied rent, etc., makes price acceleration to the Fed’s 2 percent target unlikely anytime soon. If this is the case, the market is discounting the fact that the Fed will have to stop the hiking cycle sooner in order to avoid further downward price pressure.
The fed funds rate may already be nearing the neutral rate. The neutral (or natural) rate—the estimated real short-term rate that is in place when the economy is operating at full potential and with stable inflation—has been declining for the past decade in the United States and now is estimated to be essentially zero in real terms. The decline in the neutral rate results from the declining potential for U.S. growth resulting partly from reduced productivity and declining population growth. With core inflation currently running at approximately 1.5 percent, the Fed is less than two hikes away from the neutral rate in nominal terms. Moving the fed funds rate above the neutral rate, could be excessively restrictive. The market is pricing the probability of the Fed getting close to the neutral rate sooner than expected.
Foreign central banks are distorting the term structure of interest rates. As the Bank of Japan, the European Central Bank, and the Bank of England press on with their quantitative easing (QE) programs, the shortage of high-quality assets could be suppressing all yields, including those on risk assets. Moreover, the Fed has already estimated that the large-scale asset purchases and maturity extension program of QE may have reduced the 10-year Treasury term premium by 80–100 basis points. Only when QE has been reversed will long-term rates have the opportunity to rise.
Whatever the source, until the structural issues around growth and inflation are addressed, the markets are likely to be stuck in a low-rate environment perhaps longer than anticipated. This prolonged period of low rates is leading to distortions in asset prices, which will become more pronounced in time and inevitably lead to destabilizing bubbles that will threaten the economic expansion, ultimately bringing down prices on all risk assets.
David Rosenberg:

Real Q1 GDP was revised up 1.4%, twice the initial estimate. Real GDI (Income) is only +1.0% in Q1 while the Philly Fed GDPplus, meant to “improve” on the formers is not better at +1.1%.

- Similarly, the US ECRI index of leading indicators is weakening. (The Daily Shot)

Source: ECRI
Dollar’s Bull-Market Run May Be Ending The U.S. dollar is down 5.6% this year, its worst two-quarter decline since 2011, as investors see economic recoveries around the world gaining on or surpassing growth in the U.S.
 SO, WE ARE IN SECULAR STAGNATION…really? By Charles Gave
Upbeat BoC report boosts chance of rate hike
If Bank of Canada Governor Stephen Poloz wanted more evidence that it may be time to start raising interest rates, he got it with an unequivocally upbeat reading of the mood of Canadian businesses.
Virtually all key indicators of business activity are picking up, including sales momentum, demand, investment plans, capacity pressures, plus the highest-ever reading of hiring intentions, according to the central bank’s latest quarterly Business Outlook Survey, released Friday. (…)
The economy is showing signs of strength, with the job market booming and gross domestic product growing the fastest among the Group of Seven advanced economies.
A composite indicator of the various survey results reached its highest level in six years. Half of the businesses polled expect sales to pick up next year, while two-thirds said they plan to hire over the next year, after months of strong employment growth.
The positive hiring intentions were found across all sectors and regions. Nearly half of the firms even said they would have problems meeting future demand increases.
“Positive business prospects are increasingly widespread across regions and sectors,” the survey said. (…)
One of the only downbeat bits of data was on the inflation front, where expectations of price increases “edged down,” according to the bank. Indeed, all three of the Bank of Canada’s measures of core inflation remain well below its 2-per-cent target.
THE PMIs
The rate of expansion in the eurozone manufacturing sector accelerated to its fastest in over six years in June, reflecting improved performances across Germany, France, Italy, the Netherlands, Ireland, Greece and Austria. Output expanded on the back of rising inflows of new work, encouraging companies to maintain the pace of job creation close to May’s 20-year survey record high.
The final IHS Markit Eurozone Manufacturing PMI® rose to 57.4 in June, up from 57.0 in May and the earlier flash estimate of 57.3. (…) the average reading during the second quarter (57.0) is the best outcome in over six years (since Q1 2011). (…)

Euro area manufacturing production and new orders expanded at the quickest rates since the opening half of 2011, underpinned by robust intakes of new work from both domestic and export* clients. This exerted further pressure on capacity, leading to one of the steepest increases in work-in-hand in the series history. (…)
The latest survey month also saw the sharpest increase in purchasing activity for over six years, reflecting preparations for meeting expected demand growth over the coming months. Part of the expansion in purchasing volumes also reflected efforts to ease pressure on input stocks, which fell for the third month running.
Cost pressures continued to ease in June. The rate of input cost inflation was at an eight-month low, while output charges increased at the second slowest pace since January. Both price measures nonetheless remained above their long-run series averages. (…) with supplier performance deteriorating to the greatest extent since April 2011, inflationary pressures persisted in supply chains.
At current levels, the PMI is indicative of factory output growing at an annual rate of some 5%, which in turn indicates the goods producing sector will have made a strong positive contribution to second quarter economic growth.
Exports continue to play a major role in driving the expansion, increasing in recent months at rates not seen for six years, buoyed in part by the weak euro. But it’s also clear that factories are benefitting from ongoing strong demand from domestic customers.

-
Caixin China General Manufacturing PMI Manufacturing sector expands slightly in June
After declining in the previous month, both input costs and output charges increased at the end of the second quarter. That said, the rates of inflation were much slower than seen at the beginning of the year.
At 50.4 in June, the seasonally adjusted Purchasing Managers’ Index™ (PMI™) moved back above the 50.0 no-change mark. This was up from 49.6 and signalled an improvement in the health of the sector after a marginal deterioration in May. Operating conditions have now strengthened in
nine of the ten past months, though the latest improvement was only slight.Helping to lift the headline PMI was faster growth in new order books. Though only marginal, the latest increase in new orders was the quickest seen for three months. New work from overseas also rose only slightly in June, as panellists noted relatively subdued demand both in domestic and international markets. As a result, production rose at a slightly faster (albeit still marginal) pace at the end of the second quarter.
Relatively subdued customer demand also weighed on optimism towards the 12-month business outlook, with confidence edging down to a six-month low in June. (…)
Output charges followed a similar trend, and rose slightly after a decline in the previous month.

-
Nikkei Japan Manufacturing PMI Rising new export orders support ongoing solid growth during June
The headline Japan Manufacturing Purchasing Managers’ IndexTM (PMI)® recorded 52.4 during June. That compared to 53.1 in May and, despite falling on the month,
represented another solid rate of sector expansion. Operating conditions have improved continuously since September 2016.Although final PMI data for June confirmed that growth slowed, the sector continues to benefit from rising global demand, especially from South East Asia which was a key source of new order wins.
The current broad-based strength of global growth is also having a noticeable impact on supply chains, with Japanese manufacturers suffering the greatest delays to their ordered inputs since early 2014.
Price pressures subsequently remain elevated, and led to a rate of pass-through to clients that matched April’s near two-and-a-half year high.
Market group data indicated that the consumer goods sector comfortably enjoyed the strongest rates of growth in terms of both output and total new orders in June. Noticeably slower growth was seen amongst capital goods providers, marking a turnaround in the fortunes of that sector given its position of leading overall industry expansion during
recent months.Rising new orders and production requirements underpinned another round of employment growth during the latest survey period. Staffing levels in the sector have now risen for ten months in a row, with the latest round of growth solid and amongst the best seen over the last decade. (…)

The main index measuring large manufacturers’ confidence rose to plus 17 in the April-June period from plus 12 previously, according to the Bank of Japan’s quarterly tankan survey. (…)
The survey also showed improved sentiment among large non-manufacturers and a jump in investment plans, though companies were less confident about business conditions three months ahead and about profits for the current business year. (…)

EARNINGS WATCH
Wall Street looks beyond robust earnings Analysts wary of summer pullback as second-quarter reporting season looms
(…) “The second quarter will be fine,” says Russ Koesterich, portfolio manager at BlackRock. “My concern is what winds up happening in the back half of the year. It is possible investors will have to walk back estimates.” (…)
According to a blended rate of reported and estimated earnings, FactSet data point to 6.6 per cent EPS growth in the quarter from a year ago. While that represents less than half the 14 per cent increase in the first quarter, that period was helped by the big rebound for energy companies. Also, given the average amount by which companies typically beat expectations, another quarter of double-digit growth is not out of the question. (…)
More from Factset:
- If the Energy sector is excluded, the estimated earnings growth rate for the remaining ten sectors would fall to 3.8% [3.7% last week] from 6.6%
- The Information Technology sector is expected to report the second highest (year-over-year) earnings growth of all eleven sectors at 10.5%.
- If the Semiconductor & Semiconductor Equipment industry is excluded, the estimated earnings growth rate for the Information Technology sector would fall to 4.3% from 10.5%.
- If Micron alone is excluded, the estimated earnings growth rate for the Information Technology sector would fall to 6.9% from 10.5%.
- The estimated revenue growth rate for Q2 2017 is 4.9%. If the Energy sector is excluded, the estimated revenue growth rate for the index would fall to 3.8% from 4.9%.
- At this point in time, 114 companies in the index have issued EPS guidance for Q2 2017. Of these 114 companies, 76
have issued negative EPS guidance and 38 have issued positive EPS guidance. The percentage of companies issuing
negative EPS guidance is 67%, which is below the 5-year average of 75%. - While the number of companies issuing negative EPS is slightly below the 5-year average (79), the number of
companies issuing positive EPS guidance is well above the 5-year average (27). If 38 is the final number for the
quarter, it will mark the highest number of S&P 500 companies issuing positive EPS guidance for a quarter since Q4
2010 (43). - Ex It and HC, guidance is 47 negative (unchanged) and 10 positive (unchanged); the 82% negative ratio compares with 85% at the same time in Q1’17 and 80% at the same time in Q2’16, so essentially in line with recent experience.

IT and Financials are expected to grow EPS 8.4% in Q2 [+8.4% last week], down from 9.5% expected on March 31. The 6 consumer-centric sectors are expected to show EPS growth of only 0.6% (+0.6%), down from +2.4% on March 31.
America’s Pension Bomb: Illinois Is Just the Start
DIS-HARMONY
-
EU and Japan set to agree trade deal Accord would be emphatic rejection of US protectionism on eve of G20 summit
-
China lashes out at US as Trump-Xi honeymoon ends US-Beijing relations sink over trade, weapons sales and North Korea-linked sanctions
-
Trump phones Xi as US-China friction grows Conversation follows tensions over Taiwan, North Korea, steel and the South China Sea
-
Merkel throws down gauntlet to Trump on trade German chancellor attacks ‘protectionism and isolation’ in combative speech