Car Buyers, Online Shoppers Lifted U.S. Retail Sales in December Americans splurged on cars and online shopping during the holidays, but not much else. Sales at U.S. retailers and restaurants rose 0.6% in December from a month earlier.
Retail sales rose 3.3% in all of 2016, faster than the prior year’s gain of 2.3% and similar to the underlying trend during the expansion. (…) A separate report Friday from the National Retail Federation, an industry trade group, showed holiday sales rose 4% in November and December, compared with the same period a year earlier. The government data showed a roughly 4% gain in sales in the final three months of last year over the fourth quarter of 2015. (…)
Car sales helped drive holiday spending, as Americans took advantage of big discounts offered by the auto industry. Sales had moderated earlier in the fall, and car makers offered incentives over the holidays to encourage sales of passenger cars. The strategy largely worked, with the late-year surge lifting auto sales to another annual record. (…)
Haver Analytics provide more granularity:
During Q4’16, retail sales grew at a 6.8% annual rate, the quickest rise since Q2’14.
Total retail sales & spending at restaurants increased 0.6% (4.4% y/y) during December following a 0.2% November rise, revised from 0.1%. October’s increase also was revised higher to 0.7% from 0.6%.
A 2.4% rise (7.4% y/y) in purchases of motor vehicles & parts followed a 0.2% decline in November. The gain compared to a 3.1% increase in unit sales of light vehicles. Excluding autos, retail sales increased 0.2% (3.8% y/y) following a 0.3% rise. A 0.5% increase had been expected. Sales at gasoline service stations also lifted retail spending last month. The 2.0% increase raised sales 7.4% y/y, but that followed little-change in November. Retail sales excluding both autos & gasoline remained steady (3.5% y/y) following a 0.3% rise.

And Doug short has the best charts:


Control sales exclude Motor Vehicles & Parts, Gasoline, Building Materials as well as Food Services & Drinking Places. It is what gets into GDP calculations:

U.S. Producer Prices Increase An Expected 0.3%
The headline Final Demand Producer Price Index increased 0.3% (1.6% y/y) during December after an unrevised 0.4% November rise. (…) The PPI excluding food and energy prices rose 0.2% m/m (1.6% y/y) in December, also as expected.
An updated measure of “core” PPI inflation has evolved, known as final demand prices excluding food, energy, and trade services prices. It is available only back to 2014. This measure rose a minimal 0.1% (1.7% y/y) in December following a 0.2% November rise. During all of last year, however, the 1.2% rate of increase was double the 2015 increase. Prices of trade services improved 0.2% (1.0% y/y) following a 1.3% jump. (…)

Inflation on goods has been tame but it has accelerated lately even against a strong dollar.

SYNCHRONIZED ACCELERATION
- According to Citi, we’ve had the most synchronized economic upturn in advanced economies in years.

Source: Citi, @NickatFP, @joshdigga
- And from Bespoke Investment:

- Euro area consumers are feeling significantly better about their financial situation. (The Daily Shot)

Source: Morgan Stanley, @NickatFP, @joshdigga
So, lots of upside surprises and yet:
- From Evergreen Gavekal:


-
From the Atlanta and NY Fed after Friday’s retail sales:


-
Central Banks Drop Their Bazookas A range of forces—including political blowback, whiffs of inflation, stirrings of fiscal stimulus and worries that the policies themselves may backfire—are pressing central-bank chiefs to push short-term interest rates no lower.
Did you miss The Lady and the Trump?
BORDERING ON…
(…) A border tax will apply “when a company that’s in the U.S. moves to a place, whether it’s Canada or Mexico or any other country seeking to put U.S. workers at a disadvantage,” Sean Spicer, a spokesman for president-elect Donald Trump, said during a conference call with reporters Friday, Bloomberg News reported.
Until Friday, the name Canada had not arisen specifically in comments by the administration on auto exports or in the tweets Mr. Trump has sent out threatening to impose a “big border tax” on General Motors Co. and Toyota Motor Corp. for importing vehicles to the United States from Mexico. (…)
The five auto makers that assemble vehicles in Canada exported about $60-billion worth of cars, crossovers and minivans to the United States last year.
In the past four months, four of them have announced investments totalling more than $2-billion at their Canadian plants, including a $400-million investment announced Monday by Honda Motor Co. Ltd., at its assembly plant in Alliston, Ont. (…)
While Canada has a trade surplus with the U.S. on finished vehicles, it runs a deficit of about $11-billion on parts because of the high value of parts that auto makers in Canada import from U.S. suppliers. (…)
Mexico also imports billions of dollars’ worth of U.S. parts for cars assembled there, Mr. Wildeboer said. (…)
-
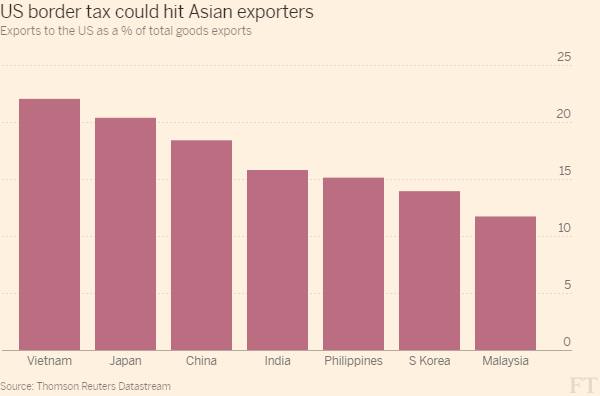
US border tax threatens Asian growth Republican plan to penalise imports could upend region’s export-led economic model
-
Trump Tweets “Car Companies Have To Start Making Things Here Again”“Car companies and others, if they want to do business in our country, have to start making things here again.”
-
Trump threatens German carmakers with 35 percent U.S. import tariff
United States President-elect Donald Trump warned German car companies he would impose a border tax of 35 percent on vehicles imported to the U.S. market, a plan that drew sharp rebukes from Berlin and hit automakers’ shares .
In an interview with German newspaper Bild, published on Monday, Trump criticized the German carmakers for failing to produce more cars on U.S. soil.
“If you want to build cars in the world, then I wish you all the best. You can build cars for the United States, but for every car that comes to the USA, you will pay 35 percent tax,” Trump said in remarks translated into German.
“I would tell BMW that if you are building a factory in Mexico and plan to sell cars to the USA, without a 35 percent tax, then you can forget that,” Trump said. (…)
All three German carmakers have invested heavily in factories in Mexico, with an eye to exporting smaller vehicles to the U.S. market.
At the same time, German carmakers have quadrupled light vehicle production in the United States over the past seven years to 850,000 units, more than half of which are exported from there, the German VDA automotive industry association said. (…)
Around 65 percent of BMW’s production from its factory in Spartanburg, South Carolina is exported overseas. BMW builds the X3, X4, X5 and X6 models in the United States. (…)
Trump called Germany a great car producer, noting that Mercedes-Benz cars were a frequent sight in New York, but claimed there was not enough reciprocity.
Germans were not buying Chevrolets at the same rate, he said, calling the business relationship an unfair one-way street. (…)
Donald Trump has taken his strongest swipe yet at the EU, labelling it “a vehicle for Germany” and predicting that other countries will follow Britain in leaving the bloc. The president-elect also warned that his trust for Angela Merkel “may not last long at all”, ranking the German chancellor alongside Vladimir Putin as a potentially problematic ally. (…)
Charles Grant, director of the Centre for European Reform think-tank, said: “These comments reinforce the view that transatlantic relations are heading for their rockiest period since world war two. “His views on Israel, Iran, climate etc are bound to create a chasm across the Atlantic and the UK will be left trying to straddle the divide — and perhaps falling in.”
-
US concerns grow over Chinese chip expansion Trump has threatened new tariffs as semiconductor sector receives large subsidies
(…) President-elect Donald Trump heightened concerns in December, when he raised the prospect of levying duties of up to 45 per cent on Chinese goods to level the playing field for US manufacturers. Such tariffs could hurt not just Chinese companies, but also the multinational players such as Qualcomm, Intel and Samsung that have set up shop in China, through joint ventures or partnerships. (…)
-
Gavyn Davies: The worrying macro-economics of US border taxes
(…) Although most other countries already operate “territorial” systems, the Republican plan includes other features that would make the new tax regime operate like a tariff on imports into the US, combined with a subsidy on many exports from the US, a combination that would have profound international economic consequences.
This is not just an obscure change to the details of America’s corporate tax code. It would be seen by trading partners as a protectionist measure that could disrupt world trade. (…)
TRUMP TO THE WSJ:
- “Everything is under negotiation, including One-China.”
CHINA TO TRUMP:
U.S. Shale’s Great Reawakening
(…) Separate weekly EIA data published on Wednesday showed a 176,000 barrel-a-day jump in U.S. production from the previous week, the biggest increase since May 2015. A large part of that increase came from a revision of fourth-quarter output figures, with U.S. production raised by 100,000 barrels a day from the previous estimate — this isn’t an example of shale responding quickly to higher prices. (…)
The EIA now sees U.S. production reaching 9.22 million barrels a day by December, an increase of 320,000 barrels over the year. But this could quickly start to look like a conservative forecast. (…)
EARNINGS WATCH
Very early in the season but so far, so good:
Over the past five years on average, actual earnings reported by S&P 500 companies have exceeded estimated earnings by 4.5%. During this same time frame, 67% of companies in the S&P 500 have reported actual EPS above the mean EPS estimates on average. As a result, from the end of the quarter through the end of the earnings season, the earnings growth rate has typically increased by 3.1 percentage points on average (over the past 5 years) due to the number and magnitude of upside earnings surprises.
If this average increase is applied to the estimated earnings growth rate at the end of Q4 (December 31) of 3.0%, the actual earnings growth rate for the quarter would be 6.1%.
Overall, 6% of the companies in the S&P 500 have reported earnings to date for the fourth quarter. Of these companies, 70% have reported actual EPS above the mean EPS estimate, 7% have reported actual EPS equal to the mean EPS estimate, and 23% have reported actual EPS below the mean EPS estimate.
In aggregate, companies are reporting earnings that are 5.9% above expectations. This surprise percentage is above the 1-year (+5.0%) average and above the 5-year (+4.5%) average.
The blended earnings growth rate for the fourth quarter is 3.2% this week, which is slightly higher than the earnings growth rate of 2.8% last week. Upside earnings surprises reported by companies in the Financials sector were mainly responsible for the small increase in the overall earnings growth rate for the index during the past week.
At this point in time, 7 companies in the index have issued EPS guidance for Q1 2017. Of these 7 companies, 3 have issued negative EPS guidance and 4 have issued positive EPS guidance. The percentage of companies issuing negative EPS guidance is 43% (3 out of 7), which is below the 5-year average of 74%.

Big Banks’ Results Show Strength
The fourth-quarter performance of J.P. Morgan Chase & Co., Bank of America Corp. and Wells Fargo & Co. was largely in line with what Wall Street had expected: Trading revenue was upbeat thanks to increased market activity and volatility following the election; expenses remain in intense focus; credit quality continues to improve; and a recent upward move in interest rates should eventually produce gains in banks’ income. (…)
- J.P. Morgan, the country’s biggest bank by assets and the world’s largest by market value, was the standout performer in Friday’s earnings parade. Its quarterly profit of $1.71 a share handily outpaced analyst expectations, largely due to strong trading results.
- Bank of America’s earnings per share of 40 cents beat analyst expectations as the bank cut enough expenses to offset lower-than-expected revenue.
- Wells Fargo reported lower fourth-quarter earnings and revenue, at 96 cents a share and $21.58 billion, that both missed analysts’ expectations. The bank’s shares rose after it repeatedly referenced a charge related to interest-rate moves as the reason for coming in below estimates.
Big-bank earnings continue this coming week with Morgan Stanley reporting on Tuesday and Citigroup Inc. and Goldman Sachs Group Inc. following on Wednesday. (…)
In the fourth quarter, J.P. Morgan’s trading revenue climbed 24%, and Bank of America’s rose 11%. Wells Fargo’s relatively small presence in trading has sometimes been an advantage in recent years but has been a handicap of late. (…)
Consumer banking was less buoyant. Revenue was down at J.P. Morgan and Wells Fargo versus the prior year, and flat at Bank of America. Mortgage-banking revenue was also challenged due to the rise in interest rates and looks set to continue falling this year.
Reflecting a persistent emphasis on cost controls, executives held the line on pay for traders and investment bankers. Compensation expenses in J.P. Morgan’s corporate and investment bank was 20% of revenue in the fourth quarter, down from 27% in the third period.
The cost-cutting drive continued in other parts of banks. Bank of America CEO Brian Moynihan has made expense savings a key part of his business strategy, and the company cut annual expenses nearly 5%, to $54.95 billion. Mr. Moynihan promised this past summer to reduce annual expenses to about $53 billion by 2018.
On the plus side, all three banks released reserves they had set aside for loan losses, in part due to improvement in credit quality. Such reserve releases bolster profit. (…)
RBC Capital on banks results:
- JPM: core EPS came in at $1.53 [from $1.24 last year], above our $1.47 estimate and consensus estimate of $1.42. 4Q16 performance came in stronger than expected driven by stronger FICC and investment banking revenues, improving energy related credits, stronger investment management revenues, and a lower loss in the Corporate segment, partially offset by lower noninterest income and higher noninterest expense in the CCB unit. Overall the outlook is strong for the company. Our 2017 and 2018 EPS estimates remain unchanged at $6.81 and $7.78. Our estimates incorporate 2-3 Fed Fund rate increases in each 2017 and 2018. A change in corporate tax rates over the next 12 months would lead us to increase our estimates to reflect the lower corporate tax rates.
- BAC: core EPS came in at $0.36 [from $0.28 last year], below our $0.37 estimate and consensus of $0.38. The downside to our estimates primarily came from
lower revenues, particularly in the Global Markets business segment where net income was 13.3% below our estimate. We maintain our 2017 and 2018 EPS estimates of
$1.74 and $2.24, respectively. - WFC: core EPS were $1.00 [from $1.01 last year], above our estimate of $0.99 and in-line with consensus. 4Q16 performance came in generally in-line, with better net
interest income, improving energy related credits, and modestly lower than expected expenses offsetting softer core fee income trends. We decreased our 2017 EPS estimate to $4.31 from $4.36 while maintaining our 2018 EPS estimate at $4.85.
SENTIMENT WATCH
Goldman Is Concerned: “The S&P Has Surged 6% Since The Election But 2017 EPS Forecasts Haven’t Budged”
(…) Since 1984, there have been just six years with materially positive EPS revisions: 1988, 1995, 2004-06, and 2011.” (…)

Pimco hoards cash to fend off dangers after Trump surge Big US fund manager prepares for turbulence as it predicts market euphoria will fade
(…) “Given the uncertainty, it’s better to be careful,” said Dan Ivascyn, group chief investment officer at Pimco. (…)


 Forecasters See Upside Risks to Their Economic Outlooks
 How about that risk to the upside?
