U.S. Housing Starts Pull Back, but Permits Point to Pickup
Groundbreakings surged to a seven-year high in April before falling 11% last month, the Commerce Department said Tuesday. The level of activity remained stable in May at an annual rate of 1.04 million units, and signs pointed to further gains in coming months.
Permits to build new homes surged 12% last month to an annual rate of 1.275 million, the highest since August 2007. Permits for apartment construction surged, while permits for single-family homes, a much broader segment, rose modestly. (…)
Last month’s pullback in overall home construction may have been driven in part by weather. Unusually wet weather stymied builders in several states in May, especially those in the central and southern U.S. In Texas, which often vies with California as the busiest state for builders, May rainfall amounted to 8.93 inches, far exceeding the previous monthly record of 6.66 inches set in June 2004, according to the National Center for Environmental Information.
May rainfall totals in neighboring states were similarly high, including 8.12 inches in Louisiana, 14.06 inches in Oklahoma, 10.35 inches in Arkansas, 8.15 inches in Kansas and 5.27 inches in Colorado.
Tuesday’s report on housing starts showed that construction fell in all four regions, with the biggest declines occurring in the Northeast and Midwest. (…) (Charts from Bespoke Investment and Haver Analytics)


U.S. Birthrate Hits Turning Point Six years after the recession ended, the nation’s birthrate has begun to climb again.
For every 1,000 women of childbearing age last year, there were 62.9 births, up from 62.5 births in 2013, according to data released Wednesday by the Centers for Disease Control and Prevention. That is the first increase since 2007, when the recession began.
The nation’s total fertility rate—a statistical measure of how many children each woman is likely to have over her lifetime—also rose slightly, to 1.862 children, from 1.858. That remains below the 2.1 children needed to keep the U.S. population stable, not counting immigration.

Last year, the number of U.S. births rose 1.4% to 3.99 million from 3.93 million in 2013. The number of births to Asian or Pacific Islander women increased a hefty 6%, compared with 1% for non-Hispanic white, black and Hispanic women.
Birth rates for women in their 30s rose 3% last year. Rates for women ages 25 to 29 were largely unchanged, but that actually masks a slight improvement: In 2013, this rate had declined 1%.
Americans with children may be having more, as well. The rate for second births among women ages 15 to 44 increased 1% last year, and a similar rate for third children rose 2%.
Continuing a long-standing trend, teen births are plunging. The rate for women aged 15 to 19 years old dropped 9% last year to a record low. This rate has fallen more than 60% since its most recent peak in 1991.
 OIL
OIL 
Low oil price hits $200-billion in megaprojects
Deepwater oil projects and complex gas facilities worth around $200-billion (U.S.) have been cancelled or put on hold worldwide in recent months due to the sharp drop in oil prices over the past year, consultancy Ernst and Young said on Tuesday.
Further project cuts and delays are likely as the industry braces for an extended period of lower oil prices as a result of a supply glut.
“The mind set in the industry at the moment is that prices are unlikely to be bouncing up materially in the near term,” the consultancy’s Andy Brogan said in a presentation. (…)
US crude production boost could be near: EIA economist
Stabilizing crude oil prices and falling drilling costs could soon boost US production by hundreds of thousands of barrels per day, an upstream oil and gas economist with the US Energy Information Administration, said Monday.
“We’re starting to see a turn in production,” Grant Nulle said during a panel discussion at EIA’s annual conference. “Conditions are conducive for this to happen.”
While recent EIA data has shown production declines at existing wells have outpaced production from new wells, a rebound is likely as operators focus on the most efficient wells and look to increase well completions amid falling costs and continued availability of capital, Nulle said.
In a recent survey of 85,000 wells drilled between 2012 and 2014, initial production rates have roughly doubled, he said.
In addition, with prices settling at $55/b-$60/b and costs falling, many of the estimated 2,000-4,000 drilled but uncompleted wells in the Bakken, Permian and Eagle Ford could come on line shortly, he said.
The economics of completing these wells has recently gone from “marginal to something that could be very attractive,” Nulle said.
Meanwhile in North Dakota:
Output is still only slightly off its all-time high of 1.2 million barrels per day, which it hit in December 2014. But more declines are expected with drillers pulling their rigs and crews from the field. Rig counts in North Dakota have fallen to just 76, as of June 12, far below the 130 or so that state officials believe is needed to keep production flat. (Oilprice.com)

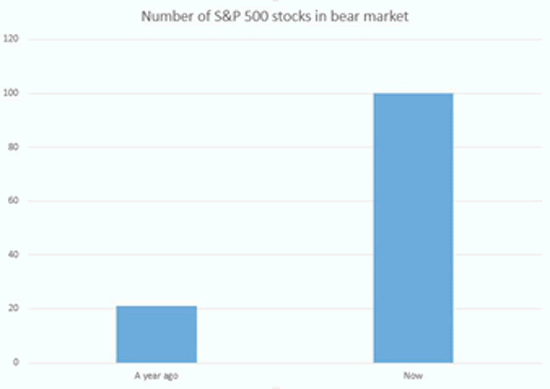
 20% OF S&P500 IN BEAR MARKET
One hundred of the stocks in the Standard & Poor’s 500, including WalMart, are down 20% or more from their 52-week highs. A drop of 20% or more is the unofficial definition of a bear market. (Tony Sagami, Mauldin Economics)
CHINESE ROULETTE (2)
Yesterday’s segment on Chinese equity valuations reaching stratospheric levels triggered a question from James who astutely related this to a JPM chart included in the June 9 CHARTS FOR THOUGHT post showing Chinese equity valuation near the bottom of their 10-year range.
Two reasons for this apparent dichotomy:
- The problem with the Shanghai Composite Index is that 94% of Chinese stocks trade at higher valuations than the index, a consequence of its heavy weighting toward low-priced banks. Use average or median multiples instead and a different picture emerges: Chinese shares are almost twice as expensive as they were when the Shanghai Composite peaked in October 2007 and more than three times pricier than any of the world’s top 10 markets. (Bloomberg)
- The JPM chart used data as of March 31. The Chinese market is up nearly 40% since then.
 Europe Stock Strategists 100% Bullish in Face of Greece Impasse
Clashes between officials in the Mediterranean nation and its creditors are wreaking havoc on markets, yet none of the 15 forecasters tracked by Bloomberg lowered their year-end estimate for European indexes. All of them see gains. UBS Group AG even raised its projection this month, citing better-than-expected earnings growth and a turn in the economy.
With analysts projecting three straight years of earnings growth surpassing 10 percent and European Central Bank stimulus in force, equity forecasters view Greece jitters as temporary. A Bank of America Corp. survey showed the region is still favored among stock investors. Citigroup Inc., the most bullish firm, sees the Stoxx Europe 600 Index jumping 17 percent through the end of the year. (…)
 VERTICAL INTEGRATION:


 Declining capacity utilization is a clear threat to profit margins. Here’s a Scotiabank (dated) chart FYI:


