Mortgage Applications Increase, Purchase Apps up 16% YoY
Mortgage applications increased 2.3 percent from one week earlier, according to data from the Mortgage Bankers Association’s (MBA) Weekly Mortgage Applications Survey for the week ending April 17, 2015. …The Refinance Index increased 1 percent from the previous week.
The seasonally adjusted Purchase Index increased 5 percent from one week earlier to its highest level since June 2013. The unadjusted Purchase Index was 16 percent higher than the same week one year ago.
“Purchase applications increased for the fourth time in five weeks as we proceed further into the spring home buying season.

Fed Rate Riot Pending If History to Investor Tantrums Is a Guide
No amount of reassuring rhetoric by Janet Yellen and her colleagues at the Federal Reserve can prevent markets’ over-reaction when benchmark interest rates start heading higher.
That’s the conclusion of Deutsche Bank AG economists Joseph LaVorgna and Brett Ryan after studying turns in Fed policy in the past two decades. (…)
So take the five tantrum years together and the average yield spike is 137 basis points. That’s a third higher than the 100 basis points the International Monetary Fund said last week was possible and warned even “shifts of this magnitude can generate negative shocks globally.”
“If history is a guide, a backup in Treasury yields could be both swift and violent, with most of the move occurring over a short period of time, generally within two months,” said LaVorgna and Ryan. “If anything, the IMF’s warnings might be too conservative.”
Now there’s always 2004. That’s when the Fed began its last cycle of rate increases, yet the 10-year yield was flat over the course of the year. Still, that may be down to the Fed’s pledge to act “at a pace that is likely to be measured.” Officials now say they won’t mimic that approach.
All the more reason to worry is that markets are low on liquidity and that investors don’t seem to be on the same hymn sheet as the Fed. According to the so-called dot plot, the median projection among Fed officials is that the federal funds rate will be 1.875 percent by the end of 2016. (…)
Asian Debt Piles Up, and Up Asian countries borrowed heavily during the financial crisis, and coutinued borrowing as the economy healed. Now they are feeling the hangover.
Growth is slowing fast across the continent as consumers and businesses focus on repaying debt. Central banks have cut rates, pushing currencies lower, but economies haven’t picked up. Demand has stayed weak, keeping wages stagnant and price growth anemic, making borrowings even harder to repay.
This dynamic could significantly harm the region’s economic prospects, potentially dragging down global growth rates. (…)
Debt levels in several Asian countries, such as China, Malaysia, Thailand and South Korea, are higher than they were before the Asian financial crisis of the late 1990s. Some countries, such as South Korea, Malaysia and Australia, have household-debt-to-income levels greater than the U.S. had before its financial crisis. (…)
In China, giant state-owned businesses, real-estate developers and local governments loaded up on debt. In Malaysia and Thailand, it was consumers who borrowed to fund the trappings of a middle-class lifestyle, such as cars and home appliances.
Commodities producers across the region took on debt in the belief that surging demand and high prices would create huge payoffs for speculative investments. In Japan, the government continued to live beyond its means, pushing the economy’s already high total debt to 400% of annual economic output, by far the highest level in the world.
Even excluding Japan, debt in Asia rose to 205% of gross domestic product in 2014, compared to 144% in 2007 and 139% in 1996, just before the Asian financial crisis, according to calculations by Morgan Stanley. In China, total debt rose to $28.2 trillion in mid-2014, or 282% of GDP, up from $7.4 trillion in 2007, according to McKinsey. The ratio is 269% in the U.S. (…)
Despite the rise in debt, few expect a financial crisis in Asia. Most borrowing was done in domestic rather than foreign currencies, so a currency depreciation isn’t likely to boost the chances of default. Too much debt denominated in foreign currencies helped set off the Asian crisis in the 1990s.
Most governments in Asia have modest debt levels, allowing them to bail out borrowers and stimulate their economies. And borrowing is largely of the plain-vanilla variety, mostly bank loans and bonds, rather than the highly leveraged structured products that contributed to the U.S. housing bust.
But there are worrisome trends. In China, half of the debt is tied to real estate and a third of the outstanding borrowing came through the country’s shadow-banking system. That debt could ricochet onto bank balance sheets, as happened during the U.S. financial crisis. China’s stock-market rally has been juiced by margin lending, which is up 70% this year.
The biggest near-term risk is a rise in U.S. interest rates, which could send capital flowing out of the region, hurting stock and bond prices, driving up borrowing costs and causing destabilizing fluctuations in foreign-exchange markets. In Southeast Asia, much of the local-currency lending was done by foreign investors, who are quick to move their cash in times of stress. (…)
Oil has hit its lows, says Vitol chief Ian Taylor sees pick-up in demand and delays in Iran output
Vitol chief executive Ian Taylor — who has shaped Vitol into the world’s largest independent oil trader during his 20 years leading the company — said the slower-than-expected return of Iran’s oil exports and growing demand meant the price crash was probably over.
“Yes we have seen a bottom,” said Mr Taylor, speaking ahead of his appearance at the FT Commodities Global Summit in Lausanne, Switzerland, on Tuesday. “Especially if the barrels from Iran have been delayed until later this year.”
This sentiment was echoed by rival Gunvor Group’s chief executive Torbjörn Törnqvist. (…)
Mr Taylor said he expected oil consumption to grow 1m barrels a day this year as a result of lower prices and a growing global economy.
If a nuclear deal between Iran and the world powers was reached in June, Mr Taylor said, it would mean increased volumes going into the market in the last quarter of this year at the earliest, with the “beginning of next year” more likely. (…)
From a Feb. 11, 2015 interview:
The oil market is slightly oversupplied, making another downward move possible in the first half before supply and demand balance in the last six months of the year, Ian Taylor, chief executive officer of Vitol Group, said Tuesday.
More highlights from the FT Commodities Summit, which is taking place in Lausanne, Switzerland this Tuesday and Wednesday. (Via FT Alphaville)
Oil production is becoming more of a manufacturing activity
On the oil price slump, Noble CEO Yusuf Alireza said “the traditional [Exploration & Production] player has a very high capex and low opex so the marginal cost of the barrel is very low, and when you have that kind of dynamic you have a very steep supply curve, whereas shale is much more of a manufacturing activity.”
He added: “You have to force the oil out of the ground. Which means, you have more opex, the higher cost of opex, which means you have a player in the market that really is a swing producer, which can react to effectively higher prices, to lower prices.
The marginal cost of that barrel is higher. There is a reason why Saudi Arabia made that decision, they realised that changes in their supply would not impact prices just market share.”
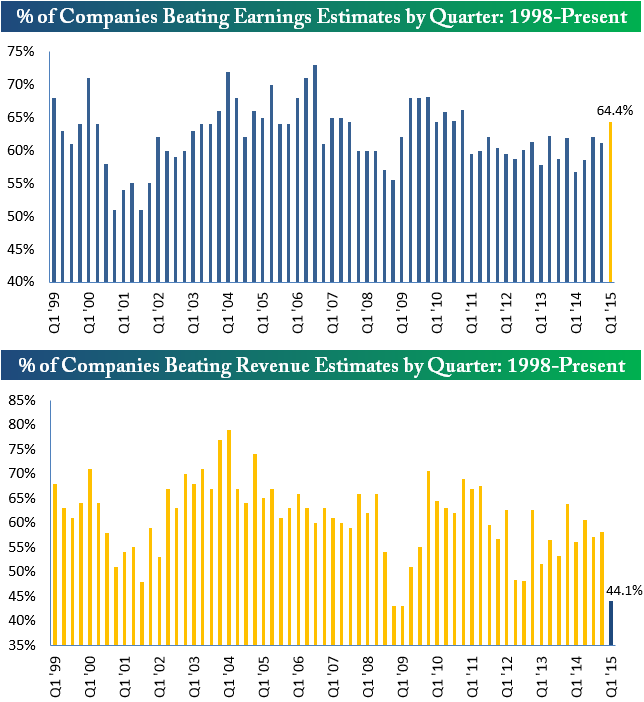
Earnings and Revenue Beat Rates
This is from Bespoke Investment and covers all NYSE companies:
Roughly 200 companies have reported earnings since the season began earlier this month. Of those companies, 64.4% have beaten consensus analyst EPS estimates. As shown in the first chart below, an earnings beat rate of 64.4% is strong relative to past quarters over the last few years. We haven’t gotten a beat rate higher than 64.4% since Q4 2010.
As shown in the second chart below, just 44% of companies have beaten revenue estimates so far this earnings season. This is extremely low compared to past quarters during this five year bull market, and it’s actually down at levels last seen during the final quarters of the Financial Crisis.
RBC Capital tallies S&P 500 companies:
- 104 companies (26.8% of the S&P 500’s market cap) have reported. Earnings are beating by 5.6% (5.9% yesterday) while revenues have missed by -0.5% (-0.2%).
- Expectations are for a decline in revenue, earnings, and EPS of -3.2%, -3.0%, and -1.5%.
- Excluding Energy, growth would be 2.5%, 5.0%, and 6.8% (6.3% yesterday), respectively. This excludes the likelihood of beats, which have come in above 4% historically.


