Recession Watch: sunny mood in markets
(…) Whether this is a bear market rally or a new bull market, it is too early to tell. The outlook for inflation and all its associated implications for Federal Reserve policy will continue to prove critical, as they have done for several quarters now. May’s US labour market report surprised to the upside, marking the 13th time out of 14 that the initial print has been higher than the median expectation among economists polled by Reuters. It adds to a range of coincident data suggesting that the US economy continues to shrug off rate hikes and banking turmoil to avoid recession. Of course, investors must consider the risks that goods news ends up being bad news if strong output data continue to keep price pressures elevated. (…)
Alternative metrics of labour market tightness have also eased. The quit rate, which tends to correspond well to wage growth, has softened to 2.4% in April, off cyclical highs of 3%. A key question is how far this softening will continue, and whether that will be enough to bring inflation back to its 2% target. It cannot be ignored that other signs of labour market tightness, such as the vacancy-to-unemployment ratio, continue to point to an historically tight labour market. Meanwhile, initial jobless claims are hovering near cyclical lows.
The recent, weak ISM non-manufacturing report for May has probably solidified the likelihood of a Fed ‘pause’ that was already in prospect. After a rapid hiking cycle, the real fed funds rate is now in positive territory, whether you annualise the outturns in actual inflation or use expectations as judged by investors. Many policymakers have pointed to uncertain lags in monetary policy as a reason to take a breather on further rate hikes. Those in favour of such a move appear to be in the ascendancy and will benefit from the optics of favourable base effects over the summer. Indeed, if prices continue to increase at their average rate so far this year, headline inflation will fall below 4% in June for the first time in more than two years. With that figure due for release on 12 July before an FOMC meeting in the same month, it should give the FOMC until their September meeting to calibrate its next move.
As investors have increasingly priced out recession fears, so too have they pushed out the date when they expect rate cuts. Over the past month, Fed funds futures have priced out around 100 basis points in cuts by March 2024. However, history is on the side of those that expect a pivot sooner rather than later.
The Fed does not tend to stay at cyclical highs for very long. Last time round, the FOMC was cutting rates within seven months of ending its hiking cycle. Whether that sort of move repeats itself will reflect in large part whether the US goes into recession, or if a downturn has been delayed or avoided altogether, as well as the path for inflation and whether it proves to be stickier than investors currently anticipate. With all that in mind, the outlook for US policy rates over the next year remains highly uncertain, with big risks in both directions.


Fathom Consulting, like just about everybody, takes no account of S&P Global’s own Services PMI survey which was totally at odds, in all aspects, with the ISM (see here).
VettaFi plots both indices on the same scale. S&P Global’s has generally been below the ISM’s since 2016. It got very weak early in H2’22 when Services real gross output growth sank from 5.9% in H2’21 to 3.7% in H1’22, 3.0% in Q3’22 and 0.1% in Q4’22. Such a drop is akin to recession for Services.

The two surveys seemed in sync early in 2023 but with different momentum. In April and May, however, S&P Global signalled strong growth with rising orders and employment while the ISM suggests continued stagnation.
Growth in services employment per the BLS troughed in December at 1.8% a.r. and has been accelerating since reaching 2.8% in May.
S&P Global’s Chris Williamson explained the different surveys in September 2022:
The first, and most striking, difference between the two surveys is that of sector coverage. While the S&P Global PMI for the service sector only includes data provided by companies operating in the US services economy, encompassing a variety of consumer, business and financial services which are provided by the private sector (or otherwise charged for), the ISM services PMI in fact covers any activity other than manufacturing.
The ISM definition therefore includes construction, utilities, agriculture, retail and various aspects of government administration (see table), many of which can blur, dampen or distort the picture of the health of the services economy. Public sector activity, in particular, will tend to dampen any business cycle trend, especially any downturn in private sector activity, hence its exclusion from the S&P Global survey.
Survey respondent bases are different in terms of company size, with S&P Global stratifying its panels not only by sector contribution to GDP but also ensuring an appropriate mix of small, medium and large firms within each sector. In contrast, ISM data are based on ISM members and as such are likely to be biased towards larger companies, with small- and medium-sized firms under-represented.
As smaller firms often behave differently to larger firms during different stages of the economic cycle, or in response to policy changes or international economic conditions, it is important for any survey to ensure robust representation of all different enterprise sizes. (…)
Whereas ISM use questions relating to supply chain management (including stocks of inventories), S&P Global found this type of question to often be irrelevant for many service industries. S&P Global instead focusses on core questions of greater relevance to commercial activities in sectors such as banking, legal and accounting services.
S&P Global surveys use a weighting system to ensure the results accurately reflect the true official structure of the economy. Weights reflect both company size and the relative importance of the sub-sector in which the company operates. A large company in a large sector will therefore account for a proportionally higher weight in the survey results than a small company in a smaller sector. We understand that ISM surveys do not include such a weighting process in the calculation of the results but are instead dependent on the panels being ‘self-weighting’.
The surveys use different methods of seasonal adjustment, with S&P Global PMIs using X13 to estimate seasonal adjustment factors for the latest numbers every month. ISM, in contrast, uses a system whereby the coming year’s seasonal adjustment factors are forecast in advance. The ISM methodology means that the latest data are not in fact used in the seasonal factor estimation process, which becomes an increasingly significant disadvantage as the calendar year proceeds. ISM also revises its seasonal adjustment factors, whereas S&P Global makes no such revisions.
ISM produces a composite headline PMI for services, based on individual indices including new orders, business activity, employment, supplier lead time and inventories. S&P Global does not see any value in compiling such an aggregate index and prefers instead to just use the Business Activity Index as the survey headline, as this measures the overall output of the sector. This services activity gauge can be easily aggregated with the equivalent output index for manufacturing to produce a reliable and timely guide to overall economic growth, or GDP.
I am not aware of any comment on this from the ISM.
“MAMA MIA”
Ed Yardeni’s MAMA theme (Making America Manufacture Again) helps support his “no recession” forecast.
If the US manages to skirt a recession, it will be due in good part to the massive capital spending and building related to these plants. As we’ve noted before, capital spending in real GDP rose to a record high of $3 trillion (saar) during Q1-2023, and manufacturing construction put in place jumped 62.3% y/y through March to its latest record high of $147.4 billion. Many of the proposed factories have yet to break ground and are not reflected in these numbers. Assuming that the projects go forward, building and then operating these facilities should provide an economic tailwind. (…)
Leading the way has been nonresidential construction, particularly of manufacturing facilities. The latter rose to yet another record high of $189.0 billion (saar) during April, up a whopping 152.2% over the past 24 months (chart).
By the way, keep in mind that manufacturing capacity in the US has been flat since China joined the World Trade Organization on December 11, 2011 (chart). Now it should start expanding again.
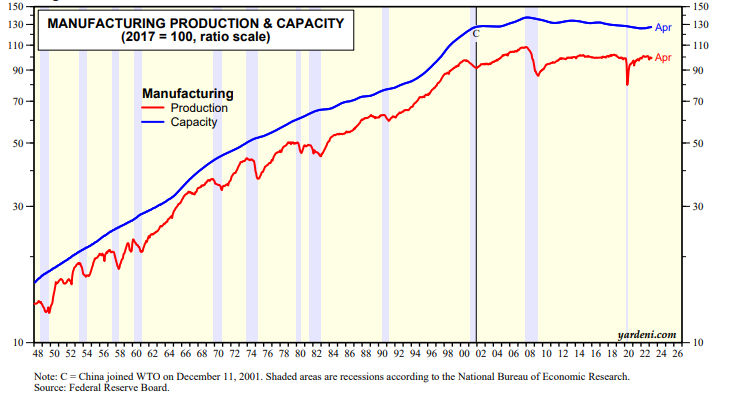
Let’s expand on this:
Manufacturing capacity utilization (black) is above 100% since October 2021, something it achieved only briefly post GFC. This is on capacity down 6% since 2009, which should shortly explode given the recent construction boom.

Over time, this means more employees, more businesses servicing this new capacity, more trade, transportation.
It also means more industrial production and fewer imports of goods (doubled since 2009) which have grown faster than goods consumption (+167% since 2009).

Ed concludes:
Don’t underestimate “MAMA,” Manufacturers, large and small, domestic and foreign, are tapping into the trillions of dollars of incentives available in the CHIPS and Science Act, the Inflation Reduction Act (IRA), and the Infrastructure Investment and Jobs Act to build factories in the US. They plan to make semiconductors, batteries, solar equipment, electric vehicles (EVs), and green hydrogen, among other things. So many manufacturers have locked down locations for new plants that it’s now hard to find shovel-ready ‘megasites,’ an April 13 Reuters article reported.
China’s Share of U.S. Goods Imports Falls to Lowest Since 2006 Americans imported more goods from abroad in April while becoming less reliant on products from China.
U.S. imports rose 1.5% to a seasonally adjusted $323.6 billion in April. U.S. trade figures are measured in dollars and aren’t adjusted for inflation, so they reflect changes in demand and price. (…)
Imports of crude oil and natural gas decreased, as did services, including transportation and travel.
Exports fell 3.6% to $249 billion in April. Industrial-supply shipments, including crude oil, drove the decline. Consumer-goods exports also decreased, including fewer shipments of pharmaceutical drugs, diamonds and jewelry.
The U.S. exported more soybeans, rice and frozen fruit juices. Exports of services increased slightly.
China’s share of trade with the U.S. dipped again, continuing a downward trend. China accounted for 15.4% of U.S. goods imports for the 12 months ended April, the smallest share since October 2006.
China’s loss of share has meant gains for European nations, Mexico and other Asian sources. A group of 25 Asian and South Asian countries, including India, Japan and Vietnam, accounted for 24.7% of goods imports for the 12 months ended in April.
Chinese exports slipped in May, fueling concerns about the country’s recovery after lifting Covid restrictions. Overseas shipments in May were down 7.5% from a year earlier, China’s General Administration of Customs said Wednesday, following an 8.5% rise in April. (…)
Inflation Drags Eurozone Economy Into Recession The eurozone’s economy slipped into recession at the start of the year as high energy and food prices following Russia’s invasion of Ukraine hit household spending.
The European Union’s statistics agency Thursday said the combined gross domestic product of the countries that share the euro fell at an annualized rate of 0.4% during the three months through March, having also declined in the final three months of last year.
Eurostat had previously estimated that the currency area’s economy grew slightly in the first quarter, but sizable changes to data from Germany and Ireland pushed it into contraction. This left the region with two consecutive quarters of shrinking output, matching the official definition of an economic recession.
Economists expect growth to resume in the three months through June as falling energy bills ease the pressure on household budgets, but any rebound is likely to be anemic. The Organization for Economic Cooperation and Development on Wednesday said it expected the eurozone’s economy to grow 0.9% this year, roughly half as much as the U.S. economy.
While energy prices have normalized from their 2022 peaks, food prices have continued to rise at a rapid pace, weakening household spending on other goods and services. (…)
The OECD said it expects eurozone inflation to fall to 5.8% this year from 8.4% in 2022, but remain well above the ECB’s target at 3.2% in 2024. (…)
A more serious worry for policy makers is the fact that Germany, the currency area’s largest member, also entered recession in the first quarter. France, Italy and Spain, the eurozone’s other large economies, all grew. (…)
 Bank of Canada Lifts Rates to 22-Year High, Ending Four-Month Pause The decision to raise the policy rate to 4.75% from 4.50% was fueled by stronger-than-expected consumer spending and concerns over elevated inflation.
In January, the Bank of Canada was the first major developed-world central bank to declare a timeout on rate increases—after an aggressive campaign that raised borrowing costs by 4.25 percentage points over a 10-month period—to assess the impact of sharply higher rates on the economy. The belief among central bank officials was that economic activity and inflation would decelerate through 2023.
The economic data have said otherwise, forcing Canada’s central bank and its global peers to rethink how high interest rates need to go to cool inflation. Some economists believe the Bank of Canada isn’t finished with rate increases and anticipate another quarter-point lift when senior officials deliberate in July.
While inflation in Canada has eased from a peak of over 8% from a year ago, it accelerated in April to 4.4% from 4.3%. The central bank sets interest-rate policy to achieve and maintain 2% inflation. Canada’s gross domestic product expanded at a strong 3.1% annual rate in the first quarter, or well above Bank of Canada expectations for 2.3% growth, on robust consumer spending, including on interest-sensitive items like housing.
“Overall, excess demand in the economy looks to be more persistent than anticipated,” the central bank said, explaining its decision to lift rates. It said short-term measures of core inflation—which strips out volatile-priced items like food and energy—have remained between 3.5% and 4% for several months. Given a tight labor market and resilient demand, “concerns have increased that CPI inflation could get stuck materially above the 2% target.”
Based on an accumulation of evidence, senior bank officials concluded “monetary policy wasn’t sufficiently restrictive to bring supply and demand back into balance and return inflation sustainably to the 2% target.” (…)
TD Bank economist James Orlando said Canada’s real-estate market has rebounded strongly after the central bank unveiled in January a time out on rate increases. The Bank of Canada made reference to the housing market’s strength in its statement. (…)
Since 2010, the correlation between the YoY change in headline CPI for the U.S. vs Canada is 94.5%.

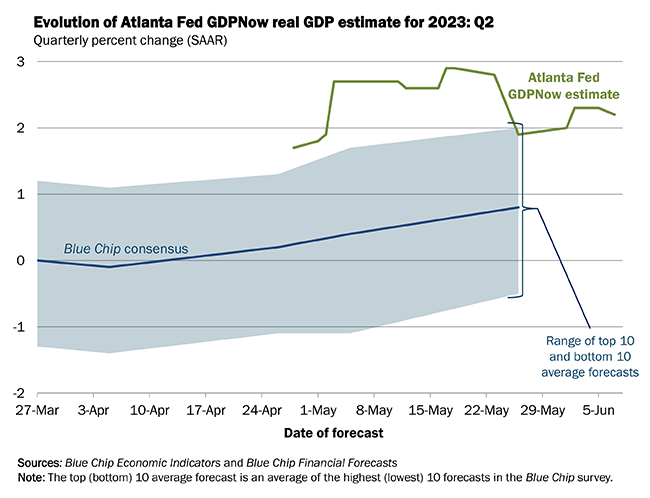
- On June 7, the GDPNow model estimate for real GDP growth in the second quarter of 2023 is 2.2 percent, up from 2.0 percent on June 1.
- Clearly, the accumulation of data over the past eight weeks told them that their policy setting was not sufficiently restrictive to relieve price pressures. The question becomes: is policy sufficiently restrictive now? Well, the BoC’s assessment that excess demand is more persistent than expected and inflation is more likely to “get stuck” above 2% doesn’t suggest that a single 25 bp hike is all that is needed to achieve a return to balance. That tends to be the assessment of financial markets as OIS pricing strongly points to another increase this year. (NBF)
- Today’s surprise hike and hawkish commentary on activity and inflation, combined with our finding that central banks have delivered more than one hike in 83% of prior episodes when they have restarted hikes after an initial pause, suggest that the BoC is likely to hike further. However, the relatively more dovish forward guidance in the concluding paragraph of the statement could signal that the Governing Council is willing to move more slowly. We therefore continue to expect a hike at the July meeting and a terminal rate of 5%. While we see some risk the that the BoC additionally hikes in September, the change in guidance could signal an intention to skip July and shift to a quarterly pace of hiking. (Goldman Sachs)
Tightening cycles in Canada, US and eurozone
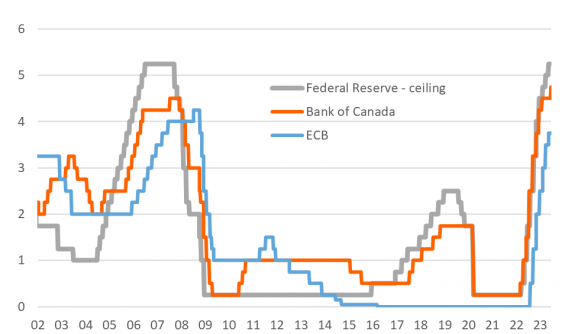
Source: ING, Bank of Canada, Fed, ECB
Why the U.S. Remains Far From Recession The pandemic’s aftereffects fuel economic resilience despite rising interest rates
Employers are hiring aggressively, consumers are spending freely, the stock market is rebounding and the housing market appears to be stabilizing—the most recent evidence that the Fed’s efforts have yet to significantly weaken the economy.
Instead, the lingering effects of the pandemic have left consumers and employers still playing catch-up. That momentum could prove self-sustaining.
Americans are splurging on the activities they skipped during pandemic lockdowns, such as travel, concerts and dining out. Businesses are staffing up to satisfy the pent-up demand. Government policies in response to the pandemic—low interest rates and trillions of dollars in financial assistance—left consumers and businesses with lots of money and cheap debt. The same inflation that so worries the Fed translates into higher wages and profits, fueling spending. (…)
Job gains, in particular, remain robust, pumping more money into Americans’ wallets. (…)
Americans have about $500 billion in so-called excess savings—the amount above what would be expected had prepandemic trends persisted, according to a May report from the Federal Reserve Bank of San Francisco.
That allows them to shell out for summer travel, concert tickets and cruises despite rising prices—and enabling companies to keep raising them. (…)
Economic activity and inflation haven’t slowed as much as Fed officials anticipated. Since March 2022, they have lifted the benchmark federal-funds rate from near zero to a range between 5% and 5.25%, a 16-year high. (…)
There are some signs higher rates are having an effect. Businesses slowed investment in the first quarter, cutting back on equipment spending particularly sharply.
The average workweek fell to 34.3 hours last month, the lowest since April 2020 and possibly reflecting that businesses are cutting hours instead of workers. (…)
The decline in the workweek has really only impacted management jobs. Production and nonsupervisory workers (80% of the total) are still working above average hours.

Wages for production and nonsupervisory workers continue to rise faster than the total, 4.0% YoY vs 3.4%. Aggregate weekly payrolls (employment x wages x hours) were up 6.8% in May for production and nonsupervisory workers vs 6.2% for all employees. Headline CPI was up 5.0% in May while headline PCE inflation was 4.4%. Not much of a squeeze so far.

Real consumer expenditures rose 2.3% YoY in Q1’23 and in April. They rose 2.4% on average between 2016 and 2019. Higher rates have yet to bite…
-
If you missed it: THE DAILY EDGE: 5 JUNE 2023: Ineffective Playbook
Bonds Everywhere Suffer as Rate-Hike Fears Swamp Traders
Global bonds are slumping after two shock interest-rate hikes this week served traders a reality check that central banks are far from done fighting inflation.
Shorter-maturity Treasury yields are close to their highest since March, while their Australian equivalents have jumped to levels last seen more than a decade ago. Investors are back ditching sovereign debt after the Bank of Canada joined the Reserve Bank of Australia in surprising markets with more rate hikes to combat stubbornly fast consumer-price gains.
The tightening is convincing traders to rethink their bets of Federal Reserve rate cuts later this year, underscoring the threat that the battle against inflation may be far from over.
“Bond markets face stiff headwinds from multiple directions,” said Markus Allenspach, head of fixed income research at Julius Baer. “We have to admit that the disinflation process is slower than we had hoped for.” (…)
The latest developments “run against the prevailing narrative that central banks are on the verge of pausing their rate hikes, particularly given Canada was one of the first to formally signal a pause back in January,” Deutsche Bank AG strategists including Jim Reid wrote in a note. “The big question now is whether the Fed might follow up with a hike of their own next Wednesday, or whether they’ll finally keep rates on hold after 10 consecutive increases.” (…)

Bloomberg’s Joe Weisenthal:
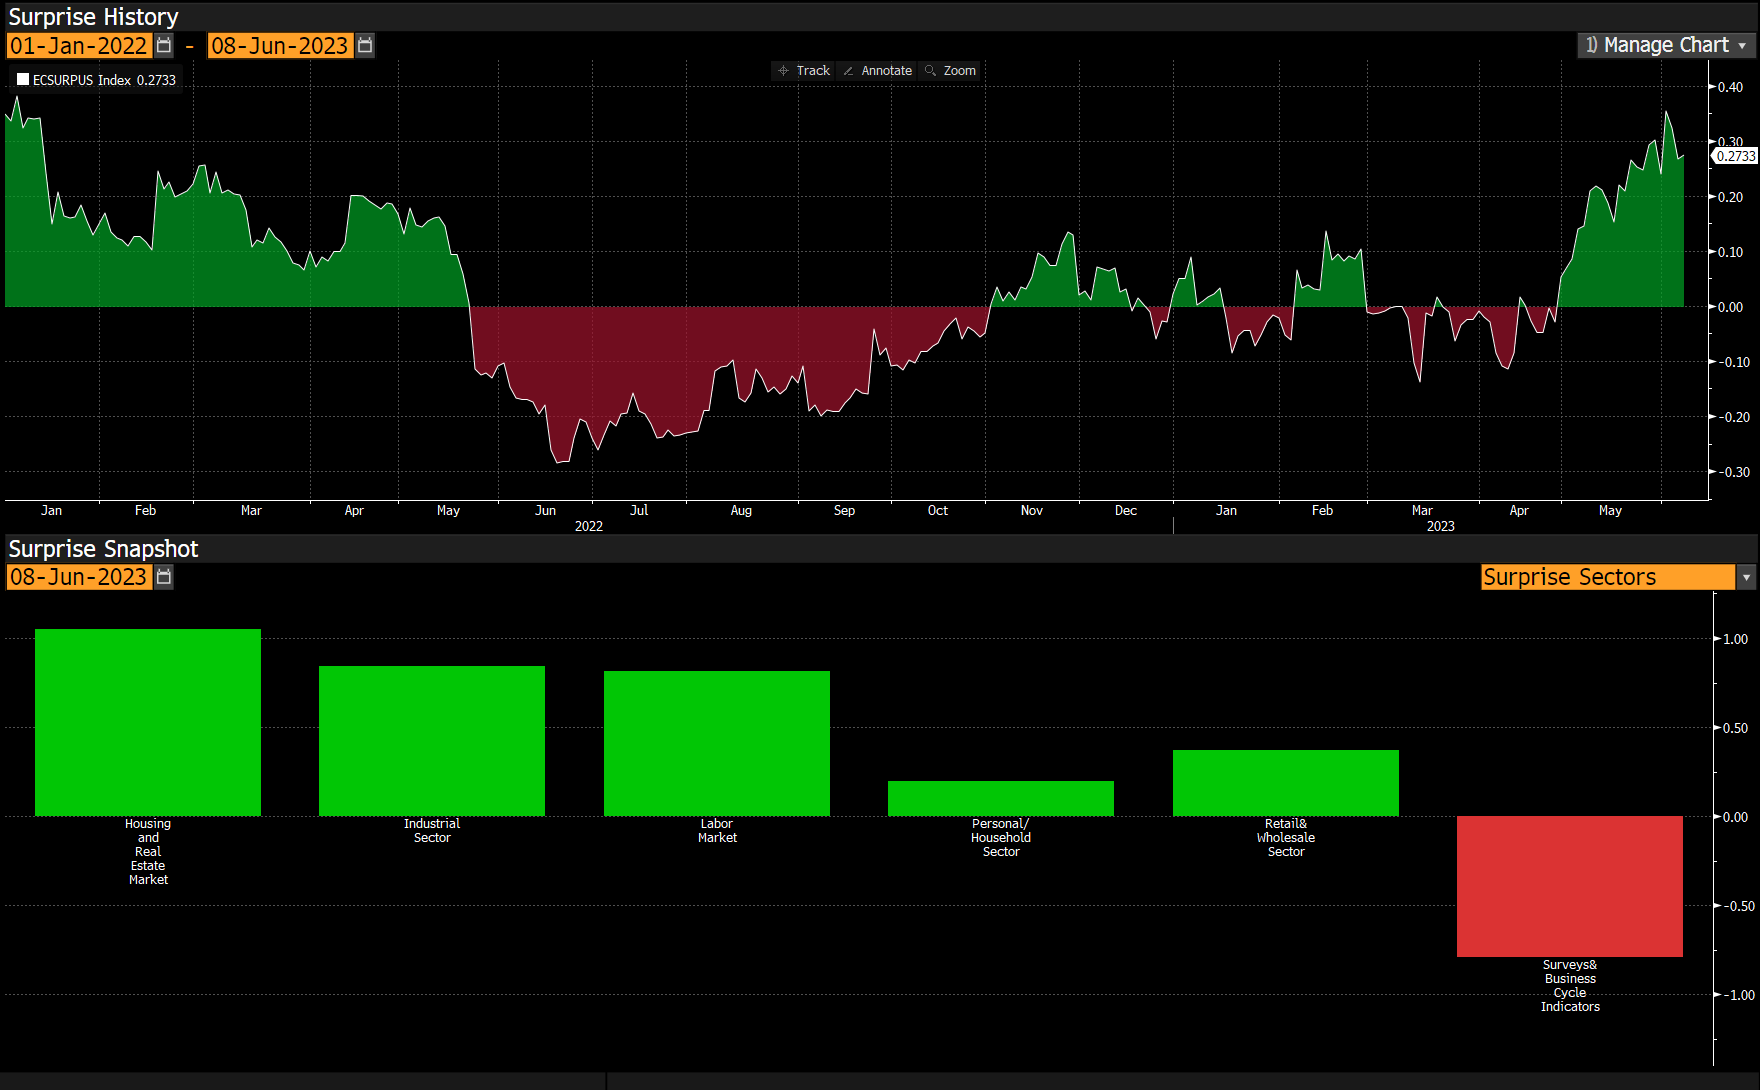
(…) The page breaks down not just how economic data is coming in relative to expectations (the top chart) but also which categories are beating or missing expectations the most.
As you can see, the data is coming in strong these days, and basically every category is performing well, with the exception of the last one, survey data. That includes things like ISM, Philly Fed, Dallas Fed, and the Conference Board Consumer Confidence Index. That’s all been pretty dismal for awhile. And yet despite the negative sentiment, actual activity has continued to surprise on the upside. (…)
And finally speaking of normalization, yesterday the jobs site Indeed published its latest measure of wage growth, which is also in the hot-but-cooling category.
They put YOY wage growth at 5.3%, well down from the peak last year and by their estimate, at the current trajectory, we’ll be at the pre-pandemic pace somewhere in late 2023 or early 2024.
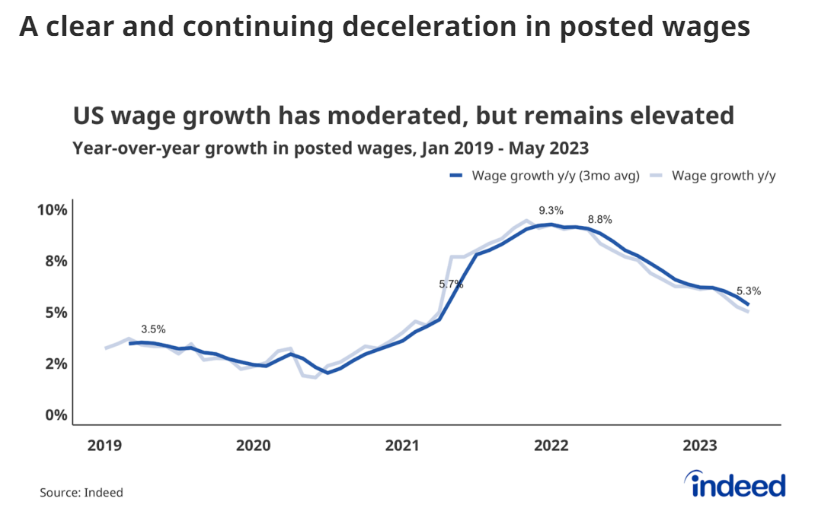
The Atlanta Fed Wage Growth Tracker (a 3-m m.a.) is at 6.1% with job switchers at 6.9% and stayers at 5.7%.

Manhattan Apartments Are Leasing in a Flash Ahead of Summer Frenzy Rents reach a third straight monthly record with more pain to come as market enters its most-competitive season.
(…) The median rent on newly signed leases reached a record for a third straight month, rising almost 10% from a year earlier to $4,395.
Manhattan rents typically peak in the summer months and dip slightly through the winter. This year, though, demand has been so intense that prices kept pushing upward. And they’re expected to continue rising as new graduates flood in and families race to move before school starts again.
“There’s no shock and awe here, it’s just a continuation of a trend that we’ve been seeing for the last 18 months,” said Jonathan Miller, president of Miller Samuel. “It’s hard to imagine there won’t be records for the next several months.” (…)
Also using an ineffective playbook:
Russian Elite Is Souring on Putin’s Chances of Winning His War “The best they hope for is that Russia will lose without humiliation.”


