The enemy of knowledge is not ignorance, it’s the illusion of knowledge (Stephen Hawking)

It ain’t what you don’t know that gets you into trouble. It’s what you know for sure that just ain’t so (Mark Twain)

Invest with smart knowledge and objective odds

THE DAILY EDGE: 2 MAY 2023

MANUFACTURING PMIs

USA: PMI signals expansion for first time in six months, but improvement sparks higher price pressures

The seasonally adjusted S&P Global US Manufacturing Purchasing Managers’ Index™ (PMI™) posted 50.2 in April, up from 49.2 in March, and broadly in line with the earlier released ‘flash’ estimate of 50.4. The latest index reading was the first to post above the 50.0 neutral mark for six months and was the highest since October 2022.

image

Supporting the renewed overall upturn was a return of new order growth following six successive months of contraction. The rise in new sales was only fractional, however, as manufacturers continued to note hesitancy among customers to place orders amid higher prices and global economic uncertainty. The improvement in demand was also limited to the domestic market, as new export orders contracted for an eleventh consecutive month and at a solid pace.

Meanwhile, input costs and output charges increased at steeper rates during April. Higher supplier prices reportedly drove inflation as firms passed through greater operating expenses to customers. The rate of cost inflation quickened to the sharpest in three months, while the pace of increase in selling prices also accelerated above the series average. (…)

The filling of long-held vacancies and anticipations of greater new order inflows to come led to a stronger increase in employment in April. Manufacturers expanded workforce numbers at the fastest pace in seven months in an effort to broaden capacity.

Manufacturers were upbeat in their year-ahead output expectations in April. The degree of optimism rose to the strongest for three months and was broadly in line with the series long-run average. Planned investment, greater supply chain reliability and hopes of an uptick in client demand reportedly drove confidence.

The ISM: Economic activity in the manufacturing sector contracted in April for the sixth consecutive month

image

           New Orders                          Customers’ Inventories

 image image
WHAT RESPONDENTS ARE SAYING
  • “Having invested heavily to de-risk the supply chain over the last three years due to COVID-19, we are looking to reset with a number of our suppliers to reduce inventory, which has grown steadily over that period. Lead times are generally coming down, although electronic components are still a concern.” [Computer & Electronic Products]

  • “Business continues to contract, albeit slowly year over year. We are burning existing inventory when possible and catching up on orders. Suppliers are shipping materials at a faster pace, especially to get the payable process started at the end of the first quarter. Employment is steady, with manpower decisions based on expected order flow in the second quarter, which is subject to change. Staffing levels in our sector are not decreasing, but employment openings are slowing across the economy, which reduces the pool of replacement candidates. We are currently projecting that the third quarter will see some improvement in business, especially in our metals coating for the aerospace industry. But unforeseen circumstances — international or domestic — could change things quickly.” [Chemical Products]

  • “Pricing pressures continue to plague daily operations. After consecutive years of inflation and aggressive pricing to our retailers, we are starting to see resistance in the willingness to pass along pricing to end consumers. Discounting has entered into conversations.” [Food, Beverage & Tobacco Products]

  • “Business is steady. Closely monitoring demand going forward to detect a negative trend.” [Transportation Equipment]

  • “Customers seem to be quite heavy on inventory (as is my employer). This has made for a significant slowdown in sales orders for the last number of months.” [Machinery]

  • “Faster deliveries and shorter lead times from suppliers. … Customers starting to talk build rate reductions for the second half of 2023.” [Fabricated Metal Products]

  • “Business conditions remain strong, with sales and bookings exceeding plan. The backlog continues to grow due to increased bookings and supply chain constraints on electronic components.” [Miscellaneous Manufacturing]

  • “Sales continue to be soft, similar to 2019 pre-COVID. Expect softness to last for as long as another two years.” [Electrical Equipment, Appliances & Components]

  • “Business is picking up a bit in the automotive and construction industries — not on par with 2022 but beginning to look better.” [Plastics & Rubber Products]

  • “We seem to be in a season of contradictions. Business is slowing, but in some ways, it isn’t. Prices for some commodities are stabilizing, but not for others. Some product shortages are over, others aren’t. Trucking is more plentiful, except when it isn’t. There’s uncertainty one day, but not the next. The next couple of months should provide answers — or not. It’s hard to make projections at the moment.” [Primary Metals]

Canada: Slight improvement in operating conditions during April

Operating conditions in Canada’s manufacturing sector were little-changed during April. Although output and employment both increased, order books fell modestly, and firms were cautious with regards their purchasing and stock management policies. Confidence in the future was a little lower, whilst input prices increased at a sharper rate. Output prices, however, rose to the weakest degree in nearly three years.

The seasonally adjusted S&P Global Canada Manufacturing Purchasing Managers’ Index® (PMI®) posted 50.2 during April, up from March’s 48.6. Posting just above the crucial 50.0 no-change mark that separates growth from contraction, the index signalled a marginal improvement in operating conditions since the previous month.

image

Growth was linked to a marginal rise in output. Firms attributed this in part to a rise in capacity capabilities, with some panellists signalling better stability in labour provision. Employment growth was sustained, and the rate of increase accelerated since March to reach its highest level since June 2022. Companies reported that jobs were added in anticipation of higher sales, but also to help to keep on top of workloads. Levels of work outstanding declined for a ninth successive month, and the rate of contraction was again solid.

Firms were able to make cuts to backlogs due to extra capacity and increased output, but also because incoming new orders fell modestly for a second successive month. Export sales were also down again, extending the current sequence of contraction to just under a year. Firms reported hesitancy amongst clients in decision-making, reflective in part ongoing concerns over elevated inflation and the future direction of the economy. These factors also weighed on confidence amongst Canadian manufacturers themselves, with optimism down on March’s 11-month high and to a level just below trend.

Prices paid for inputs rose sharply in April, with the rate of inflation accelerating to its highest level of the year so far. Companies signalled costs were rising generally across a wide range of goods. Higher transportation costs were also cited as a factor driving inflation. There were also reports of higher supplier surcharges being applied. This was despite some signs of improved stability in the supply of inputs. Latest data showed that average lead times worsened again in April, but only slightly and to the smallest degree in over three-and-a-half years of worsening supplier performance.

With manufacturers facing the opposing forces of sharply rising input costs but soft sales, output charges continued to be increased during April. However, the rate of inflation was the lowest recorded by the survey in just under three years.

Euro area manufacturing production falls for first time since January

The eurozone manufacturing sector saw operating conditions worsen to a greater extent at the start of the second quarter, latest HCOB survey data compiled by S&P Global showed, as production volumes fell for the first time since the beginning of the year. Additionally, new factory orders across the euro area fell at the sharpest pace in four months as the downturn in demand intensified.

Meanwhile, eurozone manufacturers recorded a second successive month-on-month decrease in their input costs. The decrease in operating expenses was the fastest in almost three years, with rapidly improving supply conditions helping to cool inflationary pressures. Indeed, another survey-record shortening in average input delivery times was registered in April.

The HCOB Eurozone Manufacturing PMI®, compiled by S&P Global, posted 45.8 during April, down from 47.3 in March and below the 50.0 no-change mark that separates growth from contraction for a tenth straight month. The headline figure also signalled the fastest deterioration in manufacturing sector conditions since May 2020, during the first wave of COVID-19 lockdowns.

image

Of the eight eurozone countries monitored by the survey (which account for an estimated 89% of total manufacturing activity), seven posted a sub-50.0 Manufacturing PMI reading in April. The lowest was in imageAustria (42.0), although this primarily reflected a considerable downward influence from the Suppliers’ Delivery Times Index reaching a fresh survey high. This was also the case in Germany (44.5), the second-weakest performer in April. Greece (52.4) was the only monitored euro area constituent to see an expansion during the latest survey period.

Eurozone manufacturers recorded a renewed decrease in output during April, contrasting with back-to-back expansions in the two previous survey periods. The decrease was modest overall, but the quickest since December last year. Driving production levels lower was a faster deterioration in demand conditions at the start of the second quarter. New orders fell for the twelfth month running, with the rate of decline accelerating since March to its quickest in four months. According to panel members, customer hesitancy and high client inventory levels restricted new business intakes. Demand from international markets also dipped again in April, with the decrease in new export orders also quickening.

There was clear evidence of spare capacity across the euro area manufacturing sector during April, with backlogs of work falling for an eleventh consecutive month and at the steepest rate since last November. With factory new orders decreasing, purchasing activity continued to fall in April as firms responded to reduced production requirements. The decline quickened markedly since March and was the strongest for five months.

With manufacturers cutting back their buying more aggressively in April, capacity at vendors feeding into the euro area was freed up, facilitating speedier deliveries. Supplier delivery times shortened to the greatest extent since the survey began in 1997, surpassing the previous record set only in March. Amid improved supply conditions and persistent purchasing cutbacks, pre-production inventories across the euro area fell for a third month in succession during the latest survey period. The rate of depletion was the strongest since January 2021.

According to surveyed companies, quicker delivery times reflected greater availability of raw materials, with reduced competition across the market also boosting supply. Indeed, greater balance between supply and demand drove manufacturers’ costs lower during April for the second month running, with firms often commenting on successful price negotiations with vendors. The decrease in average input costs was marked and the quickest for nearly three years. Meanwhile, factory gate charges rose, albeit to the weakest extent since November 2020.

Looking ahead, eurozone manufacturers were optimistic of growth over the next 12 months, with confidence in the outlook strengthening slightly since March. Surveyed companies also expanded their workforce numbers for the twenty-seventh successive month, although the rate of job creation eased to the slowest since February 2021.

Japan: Softer deterioration in Japanese manufacturing conditions

The downturn in the Japanese manufacturing sector softened at the start of the second quarter of 2023. Weak domestic and global economic trends reportedly led to sustained contractions in production and order books. That said, the latter fell at the slowest rate for nine months. Businesses also signalled that supply chains continued on their path to recovery, as average lead times lengthened by the smallest degree in the current 39-month sequence of deterioration. Concurrently, input costs rose at the slowest pace since August 2021. That said, input price inflation was still historically elevated, and contributed to a steeper rate of charge inflation that was the strongest since last October.

The headline au Jibun Bank Japan Manufacturing Purchasing Managers’ Index™ (PMI) rose from 49.2 in March to 49.5 in April to indicate a sixth successive deterioration in the health of the Japanese manufacturing sector. The latest reading was only mild and the softest reduction in the sequence.

image

The improvement in the reading came from a slower reduction in total new order inflows. Firms registered a tenth consecutive reduction, but the rate of contraction was the softest since last November. Weak economic conditions domestically and globally reportedly weighed on demand and client confidence, though some firms mentioned that inbound demand had stabilised somewhat. As such, the rate of reduction in foreign demand for Japanese manufactured goods eased to the slowest for six months. (…)

As new orders remained in contraction territory, Japanese manufacturers allocated resources to complete outstanding business, as indicated by a seventh successive reduction in backlogs of work. Moreover, firms also took the opportunity to continue building up their workforces in preparation for an eventual demand recovery. Employment levels rose for the twenty-fifth month in a row and at the strongest pace since last October. (…)

April data was indicative of a sustained trimming of input buying at Japanese manufacturing firms. The decline was solid overall and quickened from the previous survey month, reflecting the sharper downturn in output. Nevertheless, holdings of both pre- and post­production inventories accumulated in April, albeit only modestly.

The year-ahead outlook for output remained positive during April. Firms were hopeful of a strong market recovery which would encourage new product launches and demand improvements. Business confidence was robust overall, and little-changed from March’s 14-month high.

China’s Consumers Lead Recovery in April Retail spending has come back strong, but surveys also showed a surprise contraction in factory activity in April

China’s official purchasing managers index for the nonmanufacturing sectors of the economy—that is, services and construction—came in at 56.4 in April, a weaker reading than March’s 58.2 level but still comfortably above the 50 mark that separates expansion from contraction, according to data released Sunday by China’s National Bureau of Statistics.

A similar gauge of activity in manufacturing fell unexpectedly below the 50 line in April, falling to 49.2 from the previous month’s 51.9 reading, suggesting activity in the sector shrank over the past month. (…)

Weakening external market has started to put pressure on the domestic market

Source: CEIC, ING

Source: CEIC, ING

The Caixin China General Manufacturing PMI will be out Thursday.

Tight Supply Fuels Demand for Newly Built Homes A recent fall in mortgage rates relieves a source of industry pressure.

ImageNow, new single-family home sales are bouncing back with supply tight in the existing-home market. Active listings in March stood at roughly half of where they were four years earlier, according to Realtor.com, in part because higher mortgage rates made many homeowners reluctant to sell and give up their current low rates. (News Corp, parent of the Journal, operates Realtor.com.)

That low inventory has put home builders in a good spot. Newly built homes made up about one-third of single-family homes for sale in March, up from a historical norm of 10% to 20%. (…)

“The consumer has really adjusted to this new rate environment,” said Sheryl Palmer, chief executive of Scottsdale, Ariz.-based builder Taylor Morrison Home, on an earnings call last week. “They no longer believe that rates are going to return to 3% or 4%.” (…)

Construction spending and employment have risen to new records this year, boosted by government outlays for infrastructure, a domestic manufacturing renaissance and a wave of apartment building that got off to a slow start during the pandemic when prices for building materials, such as lumber, were sky high.

Construction companies with jobs ranging from airport overhauls to bathroom renovations say they have enough work booked to maintain payrolls—for years in some cases. Even home builders, who slowed down last year when rates began to rise, are ramping up into spring.

The persistent strength in a sector that is usually among the first to suffer job loss when borrowing costs rise is undermining investor hopes that the Fed’s aggressive interest-rate increases would quickly slow inflation and rejuvenate the stock market.

It also threatens to upend bets in the market that recession and lower rates are on the horizon. Investors are trading government bonds as if rate cuts will come within the next year and buying technology stocks, bitcoin and other speculative assets that surged when borrowing costs were near zero.

The issue for investors is that the longer it takes for construction activity and employment to decline, the longer it will be before the central bank can cut rates. (…)

“Maybe we’re starting to see the effects of higher cost of capital on interest-rate-sensitive sectors,” said Anirban Basu, chief economist at trade group Associated Builders and Contractors, which said its measure of construction backlog declined in March to the lowest level since August. “The Federal Reserve raises rates until something breaks and something is starting to break.” (…)

So far, the roughly $50 billion decline in residential construction spending over the past year has been more than made up for by gains in commercial projects, including highways, hotels and hospitals. A record $108 billion was spent building factories last year, and the amount has risen this year, to a seasonally adjusted annualized rate of about $141 billion in February, according to Census Bureau data. (…)

This chart plots housing construction stages. “Under construction” (black) has just begun to roll over as “completed units” have edged up in Q1. But permits (-22.5% YoY) and starts (-18.9%) have yet to recover.

fredgraph - 2023-05-02T061408.563

Non-residential spending is much less cyclical than residential and generally weakens after the recession. In 2008-09, flat non-resid did not prevent a 20% drop in construction employment. But that was perhaps a unique one.

fredgraph - 2023-05-02T062553.032

New home demand continued to improve through March on the heels of:

  • significant price discounts in the last half of 2022 and 
  • robust sales in January and February.

Given the economic uncertainty, quickly changing consumer sentiment, and historically poor new home affordability, we are watching for signs that this momentum may be a head fake.

So much coverage on housing shows year-over-year (YOY) numbers but doesn’t consider long-term fundamentals and trends. Let’s look at both.

Home builders sold 3.5 homes per community in March 2023, which was 20% above the typical 2.9 net sales per community seasonal average from March 2013 to March 2019. 

new-home-head-fake-graph-01

The lack of resale supply has clearly helped home builders, as many would-be sellers decided to either:

  • stay in place as they are locked into below-market mortgage rates (sometimes sub-3%) or 
  • rent their home and enjoy the positive cash flow while they lease or buy another home.

Here are a few home builder quotes from our monthly survey:

  • Austin, TX: “Sales were solid across all products in March, but definitely a slight downtick from the strong sales paces seen in January.”
  • Orange County, CA: “Price adjustments have found a market that is still undersupplied. Failing to re-price means you aren’t in the game.”
  • Philadelphia, PA: “Sales have remained strong in the first three months of this year.”

Housing costs in relation to incomes have historically boomed and busted, as shown in the chart below. We expect a correction close to the 30.6% norm sometime in the future through a combination of rising incomes, falling home prices, and falling mortgage rates. New home affordability is closer to its historical norm since home builders have already lowered housing costs for new home buyers by dropping prices and buying down the mortgage rates.

new-home-head-fake-graph-02

Builders are bridging the affordability gap. Builders are more inclined to adjust prices versus resale home sellers to meet the market, drive demand back to their sales offices, and move homes off their balance sheet. Most are offering incentives that reduce the monthly payment, including closing costs, mortgage rate buydowns, and base price reductions. These incentives, particularly mortgage rate buydowns, remain a key sales advantage over the resale market and should continue with rates still elevated as long as forward commitments purchased by the builders remain available and not overly cost prohibitive.

Our consultants and survey leaders also inform us that consumers are becoming more comfortable with higher mortgage rates.

How sustainable is the positive momentum?

  • The economy, particularly the job market, has always played a significant role in housing demand. The labor market remains strong as job and wage growth continue supporting homebuying activity. However, recent interest rate hikes have yet to work their way through the economy, resulting in less housing demand. 
  • The increased banking sector distress will likely only exacerbate the economic slowdown. We might get lucky and have inflation return to normal without significant job losses, but that would be unprecedented — at least in our careers.

Enjoy the short term while it lasts. Affordability has always returned to normal levels in the past, and we expect it to return to normal levels in the future.

Rent inflation responds more to labor market conditions compared with other components of inflation. We attribute this link between labor market tightness and rent inflation to greater demand for rental units afforded by job gains and wage growth. Although online measures of asking rents currently suggest official measures of rent inflation will decline, we caution that rent inflation is likely to remain above pre-pandemic levels so long as the labor market remains tight. (…

Growth in employment and wages, which vary with broader economic conditions, are key determinants of demand for shelter and hence rent inflation. The blue line in Chart 3 shows that rent inflation slows in economic recessions (gray shaded regions) and rises in economic expansions, albeit with a lag. This lagged response is largely due to the way that rents are measured.

The Bureau of Labor Statistics (BLS) measures rents across the universe of occupied housing each month, including both housing units that have a new lease and units whose rents are fixed under an existing lease. To remedy this measurement issue, the green series in Chart 3 infers from the BLS rent measure the rate of inflation for leases that have expired and had their rents reset.

Compared with the official BLS measure, this inferred reset rent measure exhibits larger and more timely changes in response to swings in the economy. Other measures of rent inflation on new leases, including Zillow’s measure of what landlords are asking on new leases (orange line), also appear more sensitive to changes in economic conditions than the BLS measure. (…)

Chart 3 shows that the BLS measure of rent inflation slows in economic recessions and rises in economic expansions, albeit with a lag. Compared with the official BLS measure, the inferred reset rent measure exhibits larger and more timely changes in response to swings in the economy. Zillow’s measure of rent inflation also appears more sensitive to changes in economic conditions than the BLS measure.

After running well above the official BLS measure of rent inflation, the Zillow rent inflation metric has since turned down sharply. Some policymakers have interpreted the decline in the Zillow measure as an indication that BLS rent inflation measures will soon peak as well. However, a return to pre-pandemic rates of rent inflation could remain elusive. With labor markets still tight, historical patterns predict that rent inflation is likely to remain elevated even after the dust settles on pandemic-driven swings in rents.

Well, the Kansas City Fed concludes what a casual observation of rents and wages indicates: people pay, trade up or trade down, what their income affords them to pay.

fredgraph - 2023-05-02T071827.198

Yes the pandemic contributed to a 16% jump in rents in 3 years. It also contributed to a 18.6% jump in average wages.

fredgraph - 2023-05-02T072419.567

So, be careful with charts like this one:

Image

Fed Set to Raise Interest Rates to 16-Year High and Debate a Pause Officials could keep their options open in crafting signals around the endgame for increases
Yellen Sees Default as Soon as June 1 Without Increase in U.S. Debt Ceiling President Biden invited the top Republicans and Democrats on Capitol Hill to meet next week to discuss raising the country’s roughly $31.4 trillion borrowing limit, the White House said.
Euro-Zone Core Inflation Slows, Supporting Smaller ECB Hike

Consumer prices stripping out volatile items like fuel and food costs rose 5.6% from a year ago in April — down from March’s record 5.7% advance and in line with the median estimate in a Bloomberg poll of economists.

Headline inflation, meanwhile, ticked up to 7% — a touch more than the 6.9% analysts anticipated and still far above the 2% target. Services prices and a less favorable annual comparison for energy costs than in March drove the acceleration. (…)

Core Inflation Slows for First Time Since June

Money-market wagers see only a 20% chance of the bigger increase materializing — down from more than 30% last week. A Bloomberg poll showed the deposit rate, currently at 3%, may peak at 3.75% in July. (…)

Credit standards “tightened further substantially” in the first quarter, according to the ECB’s Bank Lending Survey, published Tuesday. “The tightening for loans to firms and for house purchase was stronger than banks had expected in the previous quarter and points to a persistent weakening of loan dynamics.” (…

The backdrop for this week’s ECB’s meeting will become more complete at 11 a.m., when Eurostat releases April inflation figures for the 20-nation euro area. Core inflation — currently the preferred measure for policymakers — is expected to ease slightly while the headline number holds steady. (…)

At Milken, investors praise bank rescue but brace for more drama Policymakers, executives and investors at the conference said constrained lending as a result of banking sector regulation could choke off credit to the economy.

(…) Shares of several regional lenders fell on Monday, a sign that investor nerves were still on edge after First Republic’s collapse, the third major casualty of the biggest crisis to hit the U.S. banking sector since 2008.

Senior banking executives said they were gauging how aggressive short-sellers might be in coming weeks and which of the regional banks might be burdened with significant loans for office real estate at a time many buildings are standing empty as employees continue to work from home.

“The real estate we’re more worried about is more of the bottom end of the stack of CMBS (commercial mortgage-backed securities),” Citigroup Chief Executive Jane Fraser told a panel. “It will be a stress point for sure.” (…)

Morgan Stanley plans to cut another 3,000 jobs
AI ‘godfather’ Geoffrey Hinton warns of dangers as he quits Google

(…) In the New York Times article, Dr Hinton referred to “bad actors” who would try to use AI for “bad things”.

When asked by the BBC to elaborate on this, he replied: “This is just a kind of worst-case scenario, kind of a nightmare scenario.

“You can imagine, for example, some bad actor like [Russian President Vladimir] Putin decided to give robots the ability to create their own sub-goals.”

The scientist warned that this eventually might “create sub-goals like ‘I need to get more power'”.

He added: “I’ve come to the conclusion that the kind of intelligence we’re developing is very different from the intelligence we have.

“We’re biological systems and these are digital systems. And the big difference is that with digital systems, you have many copies of the same set of weights, the same model of the world.

“And all these copies can learn separately but share their knowledge instantly. So it’s as if you had 10,000 people and whenever one person learnt something, everybody automatically knew it. And that’s how these chatbots can know so much more than any one person.” (…)

THE DAILY EDGE: 1 MAY 2023

US consumer spending flattens; core inflation still hot

(…) The unchanged reading in consumer spending last month, reported by the Commerce Department, followed a downwardly revised 0.1% gain in February. Consumer spending, which accounts for more than two-thirds of U.S. economic activity, was previously reported to have increased 0.2% in February.

Spending on services rose 0.4%, driven by housing and utilities as well as healthcare. Goods outlays fell 0.6% as purchases of motor vehicles, mostly new light trucks, decreased. Lower gasoline prices also contributed to the decline in goods spending. Economists polled by Reuters had forecast consumer spending dipping 0.1%. (…)

Last month’s flat reading in consumer spending set consumption and the overall economy on a lower growth path in the second quarter. (…)

A temporary boost to the Supplemental Nutrition Assistance Program (SNAP) benefits authorized by the U.S. Congress to cushion low-income people and families against the hardships of the COVID-19 pandemic expired in March.

SNAP is commonly known as food stamps. Researchers from the Commerce Department’s Census Bureau on Thursday estimated the end of the extra benefits had resulted in roughly 32 million people getting smaller monthly SNAP payments. They estimated that a household of four with a net monthly income of $2,000 was now getting $600 less in food stamps each month. (…)

The personal consumption expenditures (PCE) price index gained 0.1% in March, the smallest increase since last July, after rising 0.3% in February. In the 12 months through March, the PCE price index increased 4.2%. That was the smallest advance since May 2021 and followed a 5.1% rise in February.

Excluding the volatile food and energy components, the PCE price index rose 0.3%, matching February’s gain. The so-called core PCE price index gained 4.6% on a year-on-year basis in March after rising 4.7% in February. The Fed tracks the PCE price indexes for its 2% inflation target.

Economists estimated that core services excluding housing, being closely watched by policymakers, increased 0.2%. The smallest gain since last July followed a 0.3% rise in February, and reflected a drop in portfolio management fees. (…)

Solid wage gains are helping to support personal income, offseting the drag from declining government benefits like food stamps. Income rose 0.3%, matching February’s increase.

The saving rate jumped to 5.1%, the highest since December 2021, from 4.8% in February, boosted by a plunge in tax payments in January as well as fears of a recession. (…)

The historically tight relationship between labor income (aggregate payrolls) and total spending has returned post pandemic effects. In March, the 6.2% YoY growth in spending perfectly matched labor income growth. But satiated demand for goods is showing in retail sales up only 2.3% YoY in March from +7.4% in January.

image

Labor income got a 0.9% MoM boost in January due to start of the year increases in minimum wages, inflation adjustments and warm weather (e.g. construction) but February and March were both +0.3% or 3.6% annualized.

image

Wages and salaries, up 6.1% YoY largely thanks to the January bump, are thus set to decelerate rapidly in coming months/quarters unless employment growth picks up from its slow +0.15% monthly March pace.

Personal income taxes have declined every month since October 2022, and very sharply in January (one-time tax relief and credits from state and local governments), boosting disposable income, quickly spent in the same month. During the last 6 months, personal income grew 2.8% or 5.7% annualized but after tax disposable income exploded 5.1% or 10.5% annualized!

No wonder rising inflation and interest rates have had so little impact on consumption.

As these “anomalies” normalize, growth in labor income will prevail again, like it did in March, as the main determinant of consumption growth. Fortunately, inflation has also been slowing down:

fredgraph - 2023-04-29T082141.191

From Visa conf. call:

In March, payments volume growth ticked down and has remained at similar growth levels through the first 3 weeks of April. The primary driver of the tick down in the growth rate has been U.S. ticket size, while transaction growth remains in line with Q1 levels at around 8%. Ticket size was up over 1% year-over-year in the first quarter and is down about 2% in March through April 21. Ticket sizes are declining as inflation moderates.

The latest PCE inflation data are encouraging. Core PCE rose 0.31% in both February and March, lower than the +0.41% average of the previous 6 months.

image

image

Importantly, services inflation slowed from +0.6% in each of December and January to +0.4% in February and +0.2% in March.

A “data-dependent Fed” will thus be debating slowly improving inflation data amid strong consumer demand in Q1 overall, but weakening fundamentals as the quarter progressed.

With a potential banking crisis seemingly averted, another 25bps ratchet is likely this week with wording suggesting a possible pause in June. The chart below shows changes in bi-weekly loans and leases up to last Friday.

fredgraph - 2023-04-30T060352.871

The National Association of Credit Managers produces its own index of credit conditions as assessed by corporate credit managers. Members of NACM are credit and financial executives, primarily representing manufacturers, wholesalers, financial institutions and varied service organizations. A sort of PMI but from the credit managers’ perspectives. The latest survey was conducted during the last two weeks of March. Encouraging…

image

…until you notice that rejections of new credit applications recently abruptly slid to 47.9, “its lowest level since July 2009 during the great recession and financial crisis.”

(…) the steep deterioration in approvals of new credit applications is disheartening. Several respondents indicated that they are having to work with customers having cash flow problems due to capital being tied up in inventories, which requires them to be flexible on terms. But that can only go on so long, as these firms also have obligations that must be met.”

image

The credit crunch is affecting manufacturers a bit, but the amount of credit extended is still robust. For now, manufacturers seem to have avoided problems with credit availability. (…)

However, the sharp pull back in approvals of new credit applications [from service providers] is worrying. Customers are still seeking new credit, and the amount of credit extended is still very sound. But if you need credit, getting a new line approved is proving quite tough.

  image image

Ed Yardeni: “The members of the FOMC could still make a mess of the situation by continuing to vote to tighten monetary policy.”

This next piece is about monetary lags, from Bridgewater:

The Tightening Cycle Is Beginning to Bite

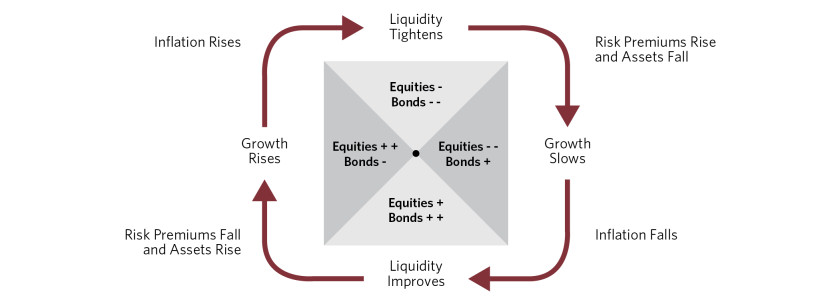
The tightening cycle began roughly one year ago. It takes about that long for a tightening to have significant economic impacts, and signs are emerging that the effects are now spreading and deepening. Damage to the banking system is a manifestation of the tightening and is now likely to be a contributor. Economies rely on the steady flow of liquidity from cash and credit to assets and spending. This liquidity pipeline runs from the central bank as the originator, through the financial system as an intermediary, to the markets, and finally to spending and income.

The combination of central banks raising interest rates and draining reserves with banks experiencing more constrained deposit and capital conditions and now tightening credit standards is very likely to constrain the flow of money and credit to markets and the economy, with impacts on spending and income. Manifestations of this are now showing up in the data. (…)

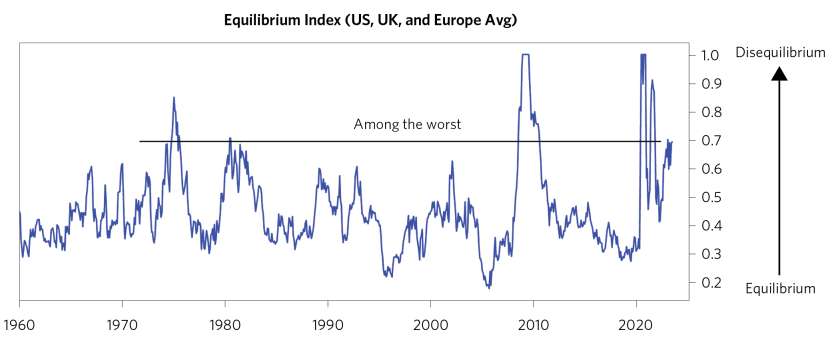
The closer an economy is to equilibrium, the easier it is to fix problems and the lower the volatility of markets. The further an economy is from equilibrium, the bigger the policy moves required to fix problems and the higher the market volatility. Within our systems, we measure the degree to which an economy is near or far away from equilibrium and connect that to the policy responses and the market movements that normally result. (…) the greatest disruption of equilibrium today remains the high level of nominal spending, which, when compared to the ability of the economy to produce more, leads to inflation rates that are significantly above target.

Aggregating a number of indicators of equilibrium conditions, the following chart shows the degree to which the US, Europe, and the UK have veered away from equilibrium. These economies remain quite far from equilibrium for similar reasons, and this is leading to big policy shifts and high market volatility. Furthermore, despite aggressive policy action, they have not moved much closer to equilibrium. On the margin, the nature of the disequilibrium has shifted from too much inflation to not enough growth, with the risk premiums on assets falling relative to cash.

Update from Our CIOs Tightening Cycle_02.png

In Japan and China, because spending is more aligned with labor output, inflation is under control, giving policy makers room to support economies and markets.

The path from disequilibrium to equilibrium allows for big swings in markets, which can be in either direction, so this is not a good short-term timing measure. But it is a frame of reference for longer-term positioning that has a good track record.

For example, the following table shows the average returns of assets across various stages, divided into bullish disequilibriums, which typically lead to stimulative policies that are supportive to assets; bearish disequilibriums, which generally require tighter policies and are bad for assets; and near-equilibrium conditions, where volatility is lower and you are likely to earn a normal risk premium on assets held.

image*All asset returns scaled to 10% volatility
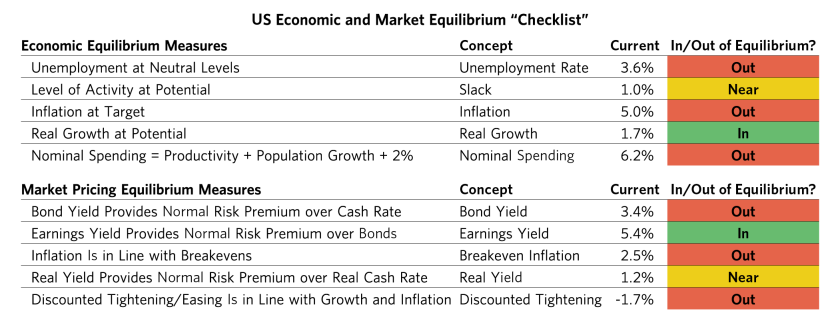
Taking a look at why we are now in the bearish disequilibrium, the following table summarizes a few key measures for the US economy.

With respect to the economy,

  • the inflation rate is too high, the rate of nominal spending is too high to bring that down,
  • the rate of unemployment is too low to bring wages down,
  • and despite nominal growth being too high, the real growth rate is lower than desired.

Of course, a weaker real growth rate is required to resolve the other imbalances, but that is a form of disequilibrium on its own, illustrating the challenge of having to create one disequilibrium in order to resolve another, and then iterating back and forth as policy makers try to bring all of them in line.

With respect to the markets,

  • bond yields are too low in relation to cash and discounted inflation rates are well below current and projected inflation rates, so there is no risk premium in bonds.
  • There is a roughly normal risk premium in equities relative to bonds based on current earnings and the current bond yield. But if you get a recession as needed to get the desired inflation rate, earnings would be about 20% lower, making the earnings yield too low in relation to bonds at the same time as the bond yield is too low in relation to cash.

In other words, in order to deal with today’s economic disequilibriums, central banks are having to make cash very attractive, which is making bonds and stocks unattractive in relation to cash. At the same time, nominal spending is too high and the labor markets are too tight to allow for the easing of policy that is priced into the front of the yield curve, which is the easing that would be necessary to provide for a normal risk premium in bonds.

Update from Our CIOs Tightening Cycle_06.png

When you add up this picture, you can see why the degree of disequilibrium is so high and why we favor cash in relation to assets in most developed economies until these imbalances are closer to being resolved. On the other hand, we favor assets in relation to cash in Japan, China, and much of Asia because they are either closer to equilibrium or are in disequilibriums that favor an expansion of liquidity that makes cash unattractive in relation to assets.

As described in previous research, we outlined what we see as the path to equilibrium:

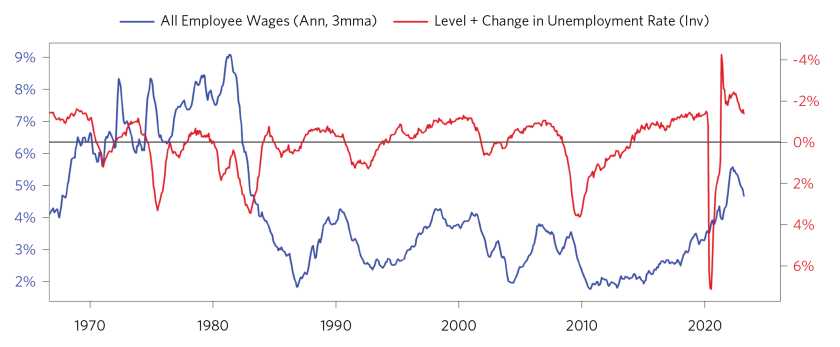
  • In order to have a sustainable 2% inflation rate at a 2% real growth rate, you need wage growth to fall to around 2.5%.
  • To reduce wage inflation, you need to cut nominal spending and income growth in half to 3-5% and raise the unemployment rate by 2% or more (P=$/Q).
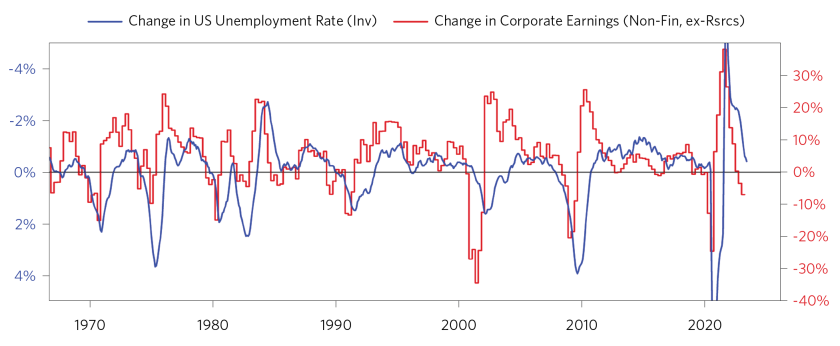
  • To raise the unemployment rate, you need to drive nominal GDP growth materially below wage growth, compressing profit margins enough to produce about a 20% decline in earnings.
  • Then central banks need to remain restrictive for about 18 months, until 2% wage growth is achieved.
  • Then they can restore a normal yield curve and risk premium in bonds by cutting short-term interest rates to about 1% below bond yields.

Updating that picture, what has happened is that we have moved incrementally in the direction of an economic contraction with a slight moderation in inflation. The cracks in the banking system are a move in that direction and are a direct result of the aggressive easing and then aggressive tightening of monetary policy. (…)

We are also seeing the first signs of a rise in savings rates that would be more consistent with the past year’s rise in interest rates and weakening of asset markets. This month’s ISM survey was the first that showed both a weakening of orders and a weakening in employment. The JOLTS figures also showed a drop in job openings. And business loan demand has collapsed. These are all signs that the tightening is passing through to the economy. This raises the odds of a pause in the tightening cycle, but at the cost of a decline in earnings and a rise in risk premiums.

It takes big moves over a sustained period of time to restore equilibriums once they have deviated substantially from desired levels. (…) Broad inflation and the wage inflation around which it is anchored have moderated a bit, but both remain significantly elevated relative to equilibrium levels. (…)

Wages are simply a price set by the supply and demand of labor. The supply/demand balance today does not resemble the conditions that led to past wage declines. (…)

Update from Our CIOs Tightening Cycle_09.png

Looking directly at corporate profits shows a bit more progress toward equilibrium, but we estimate corporate profits need to fall roughly 20% and are currently down a bit less than 10%. More pain is needed to raise unemployment, reduce wages, and moderate inflation.Update from Our CIOs Tightening Cycle_11.png

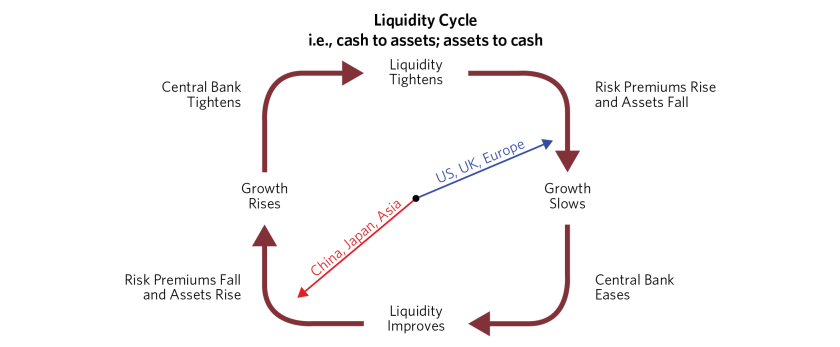
(…) across most of the developed economies of the West, tightenings of monetary policy have reversed the flow of liquidity and driven money from assets to cash. That tightening has driven up discount rates (i.e., the discounted real yield of cash) but so far hasn’t had much impact on risk premiums or growth. That is likely what comes next. In contrast, Japan, China, and much of the East are in the opposite stage of the cycle where policy makers are supporting the flow of money and credit, which lowers discount rates and risk premiums and supports growth.

Update from Our CIOs Tightening Cycle_12.png

Relating the liquidity cycle to asset returns, in the West, the coming stage is bad for stocks and less bad for bonds than where we’ve been.

Update from Our CIOs Tightening Cycle_13.png

(…) Given the next stage of the cycle, a weakening of the US economy will make US assets less attractive, particularly if the Fed pauses or eases while Asian economies recover and the ECB continues to tighten monetary policy to catch up. So, the dollar is vulnerable as relative conditions and policies

Richard Bernstein Advisors may not agree with Bridgewater’s statement that Japan, China “and much of the East policy makers are supporting the flow of money and credit”. Yield curve inversions are more widespread than in 2009 and 2000.

Table 1 shows the performance of Regional Bank stocks during the 3, 6, and 12 months after the yield curve has historically inverted. The stocks perform relatively well over the subsequent 3 and 6 months because business remains strong. However, by 12 months after inversion, the excessive risk taking begins to affect the bank stocks and they generally underperform.

In fact, Regional Bank stocks tend to underperform 75% of the time during the 12-month periods after the yield curve inverts. Because the yield curve inverted in July 2022, the recent underperformance of the Regional Banks seems to fit the historical norm.

Profits and liquidity fundamentals are still deteriorating, but investors seem aware. (…) According to [the Bank of America Global Fund Managers Survey], fund managers’ portfolios are underweighted bank stocks more than any other group, and they now view a bank credit crunch as the biggest tail risk.

This suggests that the risks are well known. If fundamentals do improve, then it could imply a stronger weight in the sector might be appropriate. For the time being, however, we feel comfortable with our sizable underweight.

image

North American non-financial corporate rating downgrades continue to exceed upgrades, a trend that began late last year, says Fitch Ratings. Most of the downgrades over the past three months were in non-investment grade rating categories, with the downgrade-to-upgrade ratio for these companies at 1.7x during 1Q23, compared to 1.0x for our portfolio of publicly-rated investment issuers and 1.5x for all publicly-rated issuers included in our universe.

Technology, Media and Telecommunications, Utilities, Retail and Consumer sectors led our downgrade activity while Industrials, Utilities and Natural Resources sectors experienced the most upgrades.

Downgrades were primarily driven by changes in financial profiles due to factors such as increased or expectations of higher leverage, changes in capital structure or reduced financial flexibility. Bankruptcy filings and M&A also drove downgrades in the quarter.

The distribution of Rating Outlooks for North American corporates is 11% Negative, 8% Positive and 79% Stable. Additionally, as highlighted in Fitch’s Global Corporates Macro and Sector Forecast – March 2023 data file, 77% of issuers have headroom in 2023 leverage metrics. This should help mitigate the risk of widespread downgrades if slower yoy economic growth pressures operating performance and results in higher leverage. Fitch’s March 2023 U.S. real GDP forecast is 1.0%, down from 2.1% in 2022 and 5.9% in 2021, with expectations of a recession in late 3Q23.

fredgraph - 2023-05-01T070930.350
Americans Go Hungry, Economic Growth Under Pressure as SNAP Benefits Expire

About 8 million Americans that received enhanced food-assistance benefits have been going hungry ever since the program ended earlier this year. It’s also hitting economic growth. (…)

A family of four with an income of $2,000 per month now gets $340 on average in Supplemental Nutrition Assistance Program benefits each month — $600 less than before the expiration. According to economists at Morgan Stanley, the impact is already visible in the latest figures on gross domestic product for the first quarter.

“Consumption was weak late in the quarter due to a drop in SNAP benefits in March, as well as warmer weather pulling consumption activity forward,” Morgan Stanley economists led by Ellen Zentner wrote in a note Thursday, following the release of a Commerce Department report showing GDP growth slowed to 1.1% annualized over the last three months.

“The loss of benefits will carry on” into the second quarter, “and is expected to weigh on consumption,” they said.

The Morgan Stanley team estimates that the expiration of benefits resulted in a hit to disposable income as large as $4 billion from February to March, or $50 billion annualized. They also see the end of Covid-era stimulus translating into a significant drag on disposable income in the second quarter, resulting in a decline in overall consumer spending. (…)

A rising number of Americans are now turning to credit cards and less regulated types of financing to make ends meet as pandemic-era benefits get lifted one after another.

Apartment Market Continues to Loosen, Transactions Pull Back Further Amidst Economic Uncertainty

Apartment market conditions continued to weaken in the National Multifamily Housing Council’s (NMHC) Quarterly Survey of Apartment Market Conditions for April 2023, as the Market Tightness (31), Sales Volume (26), Equity Financing (23), and Debt Financing (29) indexes all came in well below the breakeven level (50).

“Apartment operators reported an uptick in vacancies and concessions this quarter,” noted NMHC’s Vice President of Research Caitlin Sugrue Walter. “And while some of this softness can be attributed to seasonality, investors remain concerned about the coming wave of supply in some markets and the prospect of slower economic growth in 2023. Only 11% of Quarterly Survey respondents believe that the Fed will be able to achieve a soft landing this year in its effort to rein in inflation.

“The transaction market, meanwhile, remains at a virtual standstill, with current apartment owners unwilling to offer buyers the lower prices necessary to compensate for both this diminished economic outlook and the elevated cost of debt.”

  • The Market Tightness Index came in at 31 this quarter—below the breakeven level (50)—indicating looser market conditions for the third consecutive quarter. More than half of respondents (51%) reported markets to be looser than three months ago, while only 14% thought markets have become tighter. Meanwhile, around a third of respondents (34%) thought that market conditions were unchanged over the past three months.
  • The Sales Volume Index reading of 26 marked the fourth consecutive quarter of decreasing deal flow. Yet, while a majority of respondents (56%) reported lower sales volume, this is down from 82% of respondents who reported lower sales volume in January, 89% of respondents in October and 83% of respondents in July. Just 9% of respondents thought that volume was higher than three months ago, while 30% reported no change in volume.

Our national rent index increased by 0.5 percent over the course of April. This is the third straight monthly increase in rent prices, but represents a slight slowdown from last month at a time of year when growth is typically picking up steam. This month’s increase was also less than the typical April price change that we saw in pre-pandemic years. Even though prices are trending up again, a combination of sluggish demand and increasing supply is keeping rent growth in check.

Year-over-year rent growth is continuing to decelerate, and now stands at 1.7 percent, its lowest level since March 2021. Year-over-year growth is now below the average rate from 2018 to 2019 (2.8 percent), and it is likely to decline even further in the months ahead.

On the supply side, our vacancy index currently stands at 6.8 percent, surpassing the average pre-pandemic rate and continuing to trend upward. With a record number of multi-family apartment units currently under construction, some property owners may start struggling to fill vacancies for the first time since the early stages of the pandemic.

 MoM rent growth apr23 vacancy index apr23

Keep in mind that this index tracks new leases, always much more volatile than renewed leases. Goldman Sachs says that “Outsized rent increases for continuing leases as they catch up to current market rates are likely to keep CPI and PCE shelter inflation elevated this year. We expect year-on-year PCE shelter inflation to fall from 8.3% currently to 5.8% in December 2023 and 4.4% in June 2024.

As to Apartment List’s vacancy index chart, it lacks from a longer term perspective. The red line is where Apartment List’s current reading stands:

fredgraph - 2023-04-28T094554.329

EARNINGS WATCH

From Refinitiv/IBES

Through Apr. 28, 267 companies in the S&P 500 Index have reported earnings for Q1 2023. Of these companies, 77.9% reported earnings above analyst expectations and 17.2% reported earnings below analyst expectations. In a typical quarter (since 1994), 66% of companies beat estimates and 20% miss estimates. Over the past four quarters, 74% of companies beat the estimates and 22% missed estimates.

In aggregate, companies are reporting earnings that are 7.7% above estimates, which compares to a long-term (since 1994) average surprise factor of 4.1% and the average surprise factor over the prior four quarters of 4.2%.

Of these companies, 72.6% reported revenue above analyst expectations and 27.4% reported revenue below analyst expectations. In a typical quarter (since 2002), 62% of companies beat estimates and 38% miss estimates. Over the past four quarters, 71% of companies beat the estimates and 29% missed estimates.

In aggregate, companies are reporting revenues that are 1.5% above estimates, which compares to a long-term (since 2002) average surprise factor of 1.3% and the average surprise factor over the prior four quarters of 2.3%.

The estimated earnings growth rate for the S&P 500 for 23Q1 is -1.9% [was -4.7% last week]. If the energy sector is excluded, the growth rate declines to -3.5% [-6.1%].

The estimated revenue growth rate for the S&P 500 for 23Q1 is 2.3% [+1.9%]. If the energy sector is excluded, the growth rate improves to 3.0% [2.7%].

The estimated earnings growth rate for the S&P 500 for 23Q2 is -4.3% [-4.4%]. If the energy sector is excluded, the growth rate improves to 0.6% [0.5%].

The beats are impressive, particularly among consumer discretionary, energy and tech companies.

And particularly among larger companies where 61% were revised up last week against only 47% for non-S&P 500 companies.

image

image

Goldman Sachs: “So far 1Q is shaping up to actually be a bit better than usual. In addition to strong results from mega-cap Tech, we have also seen a better-than-feared if not outright strong earnings from the banks, airplane manufacturers, industrials more broadly, the airlines (for the most part), and even toy makers.”

Trailing EPS are now $218.68. Full year 2023: $220.03e ($219.58 last week). Forward 12-m: $225.91 ($225.86).

From Ed Yardeni:

Why has the stock market been holding up so well so far this year despite lots of pessimism about an impending recession? One possible explanation is that industry analysts are turning more optimistic on the earnings prospects of the companies they follow. We have been tracking the percent of S&P 500 companies with positive three-month percent changes in analysts’ consensus forward earnings (chart). (FYI: “Forward” earnings is the time-weighted average of analysts’ consensus estimates for the current and following years.) (…)

But: “It is all about the few mega caps leading the rally. Rest of the pack stays poor.” (The Market Ear)

GS

Speculation seems to have largely disappeared, ex crypto…

(Topdown charts)

Equity Bulls Count on Fed-Cycle Math That Worked For Decades Over eight previous monetary-tightening cycles, the S&P 500 ended up higher by an average 13% a year after the last interest-rate increase, per Strategas Securities.

High five Beware of averages. While it is true that equities eventually tend to do well after Fed easing episodes, “eventually” is the key word here: most times, the Fed eases for “good” reasons. Equity markets are not always in sync with the FOMC and some lags have been very costly.

I found 15 “Fed changes of posture” since 1957.

  • From the first pause to the market low, the S&P 500 troughed 9 months after, on average. But the range is -3 months to +31 months.
  • From the first cut to the market low, the S&P 500 troughed 6 months after, on average. But the range is -3 months to +21 months.

Actually, since 1957, the S&P 500 declined after every Fed cut but five (1966, 1980, 1984, 1989, and 1995). Equities dropped between -4.0% to -47.7% (month end data) with an average of -16.1%. If we exclude 1974 (inflation) and 2001 and 2007 (bubbles), the average is -5.9% (range: 0.0% to -19.9%).

And I found no stable correlation with valuations, inflation and profit trends that could help decide when it might be safe to jump in.

A dovish turning Fed then only tells us to reduce our underweight and get ready to buy more aggressively.

FYI:

  • Stockmarket Seasonality: Another cautionary against getting too hopeful is the seasonally sloppy patch we are heading into. And the chart below maps out the seasonal trends across global markets… (and yes: market seasonality is a global phenomenon).

Source:  Ben Laidler at eToro via Callum Thomas

  • Could it be that the break in energy costs the world got in the past year is near its end?

0cdd0973-8e98-4b06-a1d1-bae9965918a9

China’s party-state, long steeped in secrecy, is creating a black box around information on the world’s second-largest economy, alarming global businesses and investors.

Prodded by President Xi Jinping’s emphasis on national security, authorities in recent months have restricted or outright cut off overseas access to various databases involving corporate-registration information, patents, procurement documents, academic journals and official statistical yearbooks.

Of extra concern in recent days: Access to one of the most crucial databases on China, Shanghai-based Wind Information Co., whose economic and financial data are widely used by analysts and investors both inside and outside the country, appears to be drying up.

Following recent expansion of China’s anti-espionage law, aimed at fighting perceived foreign threats, many foreign think tanks, research firms and other nonfinancial entities are finding they can’t renew subscriptions to Wind over what Wind described as “compliance” issues, according to interviews with Western researchers and macroeconomic analysts. (…)