U.S. Prices, Wages Increase at Fastest Pace in Decades Consumer prices rose at the fastest pace in 30 years in September while workers saw their biggest compensation boosts in at least 20 years. Consumer spending also rose in September.
(…) The Fed’s preferred inflation gauge, the personal-consumption-expenditures price index, rose 4.4% in September from the previous year, the fastest pace since 1991, the Commerce Department said Friday. The index was up 0.3% in September from the previous month.
Excluding food and energy categories, which tend to be more volatile, the index rose 0.2% over the month and 3.6% over the year.
The employment-cost index, a measure of worker compensation that includes both wages and benefits, rose 1.3% in the third quarter from the second, the fastest pace since at least 2001, the Labor Department reported. (…)
An index of consumer sentiment also released Friday by the University of Michigan showed Americans remain in a glum mood. The index fell to 71.7 in October from 72.8 in September. It remains well below the level of 101 registered in February 2020, before the pandemic hit.
Consumers in October also anticipated the highest year-ahead inflation rate since 2008 at 4.8%, according to the sentiment survey. Higher consumer inflation expectations are a concern for policy makers because they could prompt firms and workers to raise prices and salary demands in the future, making the expectations self-fulfilling. (…)
Consumer spending rose at a seasonally adjusted annual rate of 0.6% in September, down from 0.8% in August, the Commerce Department said, as higher prices, product shortages and a surge of new Covid-19 cases caused by the Delta variant tempered buying.
Personal incomes fell 1% last month, driven by a 72% decline in unemployment insurance benefits that offset a 0.7% increase in wages and benefits, the report said. (…)
The savings rate—the share of disposable income unspent every month—fell to 7.5% in September from 9.2% in August, bringing it to a level last seen at the end of 2019, before the state of the pandemic. (…)
On a YoY basis, consumption expenditures (+10.9% in September) are getting back in line with the growth in labor income (payrolls +9.4%). Retail sales (spending on goods) are still very strong (+13.9%), Americans dipping into their savings to keep splurging on goods.

Compared with pre-pandemic levels, retail sales are 18.9% higher but flatlining since March. The gradual increase in Services is pushing total expenditures 8.6% above February 2020, growing about in sync with labor income since March.

The wide gap between labor income and spending growth comes from pandemic rescue money and reduced savings. But that cushion is largely gone with the September savings rate down to 7.5%, in line with its 2018 and 2019 average and only slightly above its 2011-2019 average of 7.3%. The monthly savings rate could decline further if Americans use their accumulated savings and/or increase their borrowings like they did in 2013 (savings rate at 6.1%), but we are nearly back to “normal”.

The savings rate’s big drop from 9.2% in August boosted September expenditures by 1.9% ($304B). A 1.7% monthly decline in the savings rate is highly unusual and why it just happened is debatable.
My take is that inflation on essentials and services has eroded spending power but Americans dipped into their savings to quickly resume their normal lives.
Much has been written on used car prices and other so-called transitorily inflated goods. Meanwhile, Services prices (69% of expenditures) have increased at a 4.1% annualized rate in the last 6 months, even with the new variant limiting activities (i.e. demand), and prices of nondurable goods (21%), mainly food and energy, are up 5.0% annualized during the same period, +6.3% during the last 4 months.

The two main components of labor income, employment and wages, have been quietly overwhelmed by rising prices since April:

Real weekly payrolls were rising 3.8% YoY last April. In September, growth was 1.7%. Without any more dissaving, consumer spending will become much more volatile and highly sensitive to inflation. The focus will shift from prices of used and new cars, hotels and airfares to the rising costs of more mundane essentials of life that simultaneously impact everybody: food, energy and rent.
Goldman Sachs notes that “September core inflation was boosted by rapid shelter inflation— which ran at the highest level since the housing bubble” and warns that its “GS shelter inflation tracker jumped to +4.7%, pointing to a pickup in the official shelter series from its current +2.8% rate.” BTW, Zillow’s rental-cost index has risen 12.8% in the past year. Inflation has now reached everybody’s weekly and monthly spending categories, seriously biting into discretionary spending power.
It is noteworthy that Amazon’s Online Stores sales grew a very soft 3.3% YoY in Q3 (+16% in Q2 and +15% during the “normal” 2019 year). Total North American net sales rose 10.4%, down from +21.9% in Q2, +39.5% in Q1 and +20.8% in all of “normal” 2019. While some of the slowdown is because Amazon’s Prime Day event was held in June this year (October in 2020), the fact that sales at the biggest online retailer grew less than inflation in Q3’21 is symptomatic of a significant slowdown in real demand.
Even Amazon’s management is worried, guiding for Q4 sales growth between 4% and 12%, the higher end assuming big market share gains from its strategic decision to boost inventory 30% YoY. Note that Core Goods inflation (CPI) was 7.3% in September so even the mid-point of the range is not great in real terms, especially for a company seeking to hire 125,000 employees on top of the 450,000 new hires since 2020. Amazon also notes that its partners plan to “hire more than 50,000 delivery associates by the end of the year”.
Inflation is threatening both demand and productivity.
Consumers are in full charge of the “stag” part of the stagflation risk. The rising “flation” end is the biggest threat now that savings are much less of a cushion.
From a stock market standpoint, the rising risk is slowing top line growth from squeezed labor income and widespread shortages (read below), cascading into lower profit margins.
Real retail sales were up a strong 8.1% YoY in September and 9.1% in Q3 but, without the base effect, they are pretty weak, having dropped 3.2% sequentially since April (-7.8% annualized).
The chart below illustrates how the sharp acceleration in goods inflation is masking the severe drop in the real trend. There is no reason for retail sales not to mean revert (dash black line) as spending on services resumes fully. The unknown is whether inflation also mean reverts simultaneously. The probability for that is high for durable goods (but when?). However, supply issues could well continue to drive nondurables (food + energy) and services (wages, rents) inflation higher, maintaining the squeeze on real income.

Goldman Sachs notes that people on the inflation front line don’t seem to be as optimistic as remote observers like economists and strategists continue to be, even after being surprised by the stronger and less transitory then expected inflation numbers:
Our composite of seven business inflation expectations series rose to the highest level in its two-decade history.
Our index of company price announcements is at the highest level since our series began in 2010, and mentions of the word “inflation” so far in this season’s Russell 3000 earnings calls have similarly been the most frequent since at least 2010.


Pushing the inflation goal posts does not eliminate the economic and profit risks.
In today’s WSJ:
Andreea Pfeifer, owner of girlFriday, a high-end cleaning service in Chicago, started raising wages in May to retain and recruit employees as demand boomed. Squeezed margins prompted her to increase her prices in June and July.
“I have never gone back to any [long-term] client and changed their pricing. But I had to do it this year,” said Ms. Pfeifer. The overall price increase of 7% to 10% was the highest possible without sacrificing customers, she said, though not enough to offset the rise in labor costs. And despite offering wages of over $20 an hour and a $500 signing bonus, “it’s been crickets,” said Ms. Pfeifer. (…)
However, neither wage nor price data currently signals a spread beyond low-wage services that might threaten the Fed’s 2% inflation target, said David Mericle, Goldman’s chief U.S. economist. (…)
Hmmm…Mr. Mericle will likely rethink this after reading that:
-
Striking Deere Workers Are Set to Vote Tuesday on New Contract Offer Proposed agreement offers bigger raises, bonuses than a deal the United Auto Workers union rejected Oct. 10
The new proposal would provide 10% raises for this year, vs. the 5% to 6% increase for the first year included in the previous offer, according to a summary of the offer distributed by the union.
The briefing from the union said workers would receive 5% raises in 2023 and 2025, up from 3% increases in the previous offer. Workers would receive lump-sum bonuses amounting to 3% of their pay for 2022, 2024 and 2026, compared with 2% bonuses in the offer voted down. Employees also would receive an $8,500 bonus if the deal is ratified Tuesday. (…)
Mr. Mericle last Friday with Jan Hatzius:
-
We are pulling forward our forecast for the Fed’s first rate hike by one full year to July 2022, shortly after tapering is scheduled to conclude. We expect a second hike in November 2022 and two hikes per year after that. However, the range of possible outcomes is wide, especially in the longer term.
-
The main reason for the change in our liftoff call is that we now expect core PCE inflation to remain above 3%—and core CPI inflation above 4%—when the taper concludes.
-
The biggest complication is the guidance in the FOMC statement that even the first rate hike requires maximum employment. However, with inflation far above target, unemployment likely below the median participant’s 4% NAIRU estimate, and job availability high, we think the committee will conclude that most if not all of the remaining weakness in labor force participation is structural or voluntary.
-
We maintain our view that growth will slow to a trend-like pace and inflation will drop to the low 2s by late 2022 or early 2023, without an aggressive monetary policy response. The key reasons are that the level of fiscal support will continue to decline sharply and supply chain problems should be resolved, turning the inflationary surge in the goods sector into a temporary deflationary drag.
Also last Friday:
U.S. Employment Costs Jumped Up in Q3
As the U.S. economy continues to reopen and labor markets recover from the pandemic, employment costs took a large step up in Q3. The employment cost index (ECI) for civilian workers increased 1.3% q/q (3.7% y/y), its largest quarterly gain since Q1 2001. That followed a 0.7% quarterly advance (2.8% y/y) in the second quarter. The Q3 increase was significantly above the 0.9% q/q gain expected by the Action Economics Forecast Survey consensus. (…)
The overall increase was driven by meaningful gains in both wages and salaries and benefits. Wage and salaries jumped up 1.5% q/q (4.2% y/y), the largest quarterly increase since Q1 1984, following a 0.9% q/q rise in Q2. Benefits were up 0.9% q/q (2.5% y/y), following a 0.4% q.q increase in Q2.
Private sector compensation rose even more in Q3 than did overall compensation. It was up 1.4% q/q (4.1% y/y), also the largest quarterly gain since Q1 2001, following a 0.8% q/q rise in Q2. Private sector wages and salaries advanced 1.6% in the quarter, the largest gain since Q3 1982, and were up 4.6% from a year ago. In Q2, they had been up 1.0% q/q. Private sector benefits jumped up 1.1% q/q (2.6% y/y) following a modest 0.3% quarterly gain in Q2.
Compensation in goods-producing industries increased 0.9% q/q (3.3% y/y) in Q3, a slowdown from the 1.1% q/q rise in Q2. By contrast, compensation in service-providing industries jumped up 1.3% q/q (3.7% y/y), the largest quarterly gain in this series’ short history (dating back to 2003), versus a 0.7% q/q gain in Q2.
The employment cost index measures the change in the cost of labor, free from the influence of employment shifts across occupations and industries.

- Even Paint Makers Are Feeling the Chip Shortage 3M, Corning and PPG said sales are suffering, as major customers produced fewer chip-dependent vehicles and appliances, and cut purchases of glass, paint and industrial components.
Companies that provide services to manufacturers, like water-management company Ecolab Inc. ECL 0.55% and train operator Union Pacific Corp. UNP -0.37% , are also being affected. Union Pacific said shipments by car and car-part makers fell 18% in its third quarter. (…)
U.S. manufacturers assembled 7.8 million vehicles in September, down from around 10.8 million a year earlier, according to the Federal Reserve. Household appliance production also fell from June to August and from August to September, according to federal data. (…)
The number of televisions sold has declined by about 10% year over year, the company said, which also cut into revenue.
“This pullback in production began to impact us in the middle of the third quarter, and we expect it to continue for the fourth quarter,” Tony Tripeny, Corning’s chief financial officer, told analysts, referring to car production. (…)
[PPG] The Pittsburgh-based company said it doesn’t expect things to get back to normal until the second half of next year. (…)
United States Steel Corp. X 12.87% said Friday that some of its car customers are planning to increase production rates over the next six months, starting as soon as November.
“We are delighted to hear from multiple auto customers who are foreshadowing that the trough of the chip shortage could be behind us,” CEO David Burritt said.
But last week, “We continue to be surprised by the duration of the supply shortage. And I was told by the top executives of our suppliers that they don’t see it getting better till at least third quarter of next year.” – Group 1 Automotive (GPI) CEO Earl Hesterberg
…and 2 weeks ago:
- Toyota Motor Corp. cut its global car production target for November by around 15% from an earlier plan as a shortage of parts continues to weigh on the world’s No. 1 automaker. The Japanese company had initially planned to make 1 million cars next month but now expects to do only around 850,000 to 900,000 units, it said in a statement Friday. (…)
“The worst period is over,” Kazunari Kumakura, the chief officer at Toyota’s purchasing group, said at a media briefing. “We’re seeing lower risks,” he said, although added as chip supply normalizes, supply and demand will remain tight.
(…) since we expect the shortage of semiconductors to continue in the long term, we will consider the use of substitutes where possible.” (…)
- Companies that have cut their earnings guidance in recent weeks include France’s Faurecia SA, Germany’s Hella GmbH & Co. and U.S.-listed Aptiv Plc. After months of battling component shortages alongside high commodity prices and shipping constraints, manufacturers face more disruptions, according to Fitch Ratings.
- From TSMC’s conference call: “TSMC’s production will likely remain stretched through 2022, as demand for semiconductors that power everything from cars to the latest smartphones drove lead times to record highs and helped fill order books. In order to secure supplies, more customers are now paying upfront, compared with just “one or two” before. (…) We expect TSMC’s capacity to remain very tight in 2021 and throughout 2022,” Chief Executive Officer C.C. Wei said on a conference call.”
- From Ford’s conference call: “Ford said its supply of semiconductors had improved markedly from the second quarter, and it forecast further improvement in the fourth, although the tight supply of chips is likely to dog the auto industry for some time. I expect the constraints on chips to remain fluid through 2022 and could extend into 2023, but we do expect the severity to reduce,” Ford’s chief financial officer, John Lawler, said in a conference call with reporters.” (NYT)
“We only expect semiconductor supplies to start showing signs of improvement from” the second half of next year onwards, the credit rater said in a report. “However, there will still be a shortage to some extent until mid-2023.
U.S. Agrees to Roll Back European Steel and Aluminum Tariffs The deal, which comes as U.S. and E.U. allies meet in Rome, will keep some trade protections in place in a nod to metalworking unions that supported President Biden.
The Biden administration announced on Saturday that it had reached a deal to roll back tariffs on European steel and aluminum, an agreement that officials said would lower costs on goods like cars and washing machines, reduce carbon emissions, and help get supply chains moving again. (…)
It leaves some protections in place for the American steel and aluminum industry, by transforming the current 25 percent tariff on European steel and 10 percent tariff on aluminum into a so-called tariff rate quota, an arrangement in which higher levels of imports are met with higher duties.
The agreement will put an end to retaliatory tariffs that the European Union had imposed on American products including orange juice, bourbon and motorcycles. It will also avert additional tariffs on American products that were set to go into effect on Dec. 1.
“We fully expect this agreement will provide relief in the supply chain and drive down cost increases as we lift the 25 percent tariffs and increase volume,” Commerce Secretary Gina Raimondo said. (…)
Under the new terms, the European Union will be allowed to ship 3.3 million metric tons of steel annually into the United States duty-free, while any volume above that would be subject to a 25 percent tariff, according to people familiar with the arrangement. Products that were granted exclusions from the tariffs this year would also temporarily be exempt.
The agreement will also place restrictions on products that are finished in Europe but use steel from China, Russia, South Korea and other countries. To qualify for duty-free treatment, steel products must be entirely made in the European Union. (…)
Metal unions in the United States praised the deal, which they said would limit European exports to historically low levels. The United States imported 4.8 million metric tons of European steel in 2018, a level that fell to 3.9 million in 2019 and 2.5 million in 2020. (…)
Other countries remain subject to U.S. tariffs or quotas, including Britain, Japan and South Korea. (…)
Canada’s Economy Wavers Unexpectedly Amid Supply Bottlenecks
Gross domestic product was little changed in September, according to a preliminary estimate from Statistics Canada released Friday, while the expansion was a less-than-expected 0.4% in August. Overall for the third quarter, the economy grew by 0.5%, or an annualized pace of around 2%.
Economists were anticipating 4% annualized growth for the three-month period, according to the median estimate in a Bloomberg survey this month.
The data could cast doubt on the Bank of Canada’s ability to start a cycle of interest rate increases early next year, as investors are anticipating, to combat rising inflation. It’s a disappointing result, even from recently downgraded estimates for the three-month period, after an even weaker first half of the year. (…)
Friday’s report suggests the supply chain disruptions that have been intensifying in recent months are significantly weighing on the trajectory of Canada’s economic recovery. September’s stall was led by drops in retail and manufacturing, according to the statistics agency. For August, global supply chain issues also held back sales of furniture and motor vehicles. (…)
Bond traders ramp up bets on ‘big shift’ in global monetary policy Investors test central bankers’ insistence that elevated inflation will be fleeting
- Central Banks Fuel New Bets on Tighter Money as Inflation Rises Globally Stubbornly high inflation across more wealthy economies last week prompted a shakeout in bond markets as investors began expecting policy makers to quickly tighten monetary policy.
(…) “The challenges facing central banks are just insane,” said Jim Vogel, an interest-rate strategist at FHN Financial. “I’ve got to believe Powell and the team are working on intense messaging balance to maintain credibility, to maintain flexibility, but then give honest answers.” (…) “Central banks and markets are starting to diverge in their response to the inflationary pressures, and it’s highly unlikely that they are all correct,” said Jim Reid a strategist at Deutsche Bank.
- Fed Complacency Feeds Inflation The central bank’s strategy is meant to help lower-income earners, but rising prices hit them hardest.
Inflation is a bigger challenge than the Federal Reserve acknowledges. It has already risen dramatically, and it is suppressing real wages. Expectations of further inflation have begun to influence wage demands, costs of production, supply-chain estimates, and business pricing strategies. Lower-income earners are being squeezed the most.
It isn’t enough that the Fed says it will begin tapering its asset purchases, while it continues to hope that inflation will recede to 2% when supply shortages dissipate. The Fed must acknowledge that its monetary policy has been a source of inflation, and that it will need to raise interest rates more quickly than it presumed. (…)
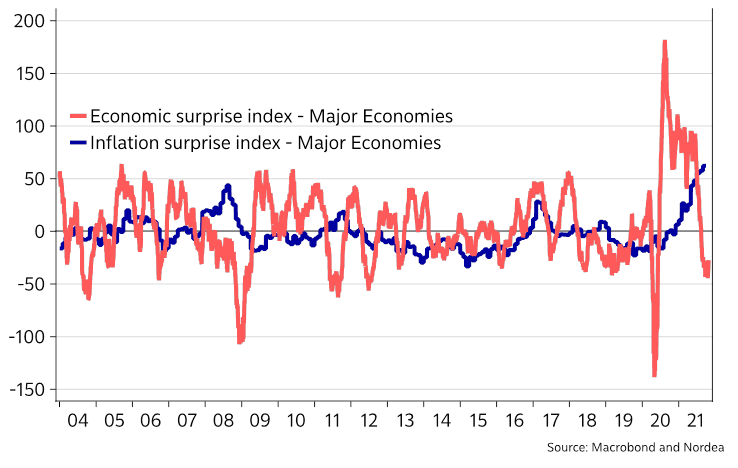
Nordea: “Economists have by the way NEVER been this surprised by inflation before, which is in itself a friendly reminder that a lot of money managers and economists in charge of the current decision making, have never even experienced inflation before.”
AAAAAAAAAAAAAAH! Inflation surprises are record high, while growth surprises are negative
EARNINGS WATCH
From Refinitiv/IBES:
Through Oct. 29, 279 companies in the S&P 500 Index have reported earnings for Q3 2021. Of these companies, 82.1% reported earnings above analyst expectations and 14.3% reported earnings below analyst expectations. In a typical quarter (since 1994), 66% of companies beat estimates and 20% miss estimates. Over the past four quarters, 85% of companies beat the estimates and 12% missed estimates.
In aggregate, companies are reporting earnings that are 10.9% above estimates, which compares to a long-term (since 1994) average surprise factor of 4.0% and the average surprise factor over the prior four quarters of 18.3%.
Of these companies, 76.0% reported revenue above analyst expectations and 24.0% reported revenue below analyst expectations. In a typical quarter (since 2002), 61% of companies beat estimates and 39% miss estimates. Over the past four quarters, 79% of companies beat the estimates and 21% missed estimates.
In aggregate, companies are reporting revenues that are 2.0% above estimates, which compares to a long-term (since 2002) average surprise factor of 1.2% and the average surprise factor over the prior four quarters of 4.1%.
The estimated earnings growth rate for the S&P 500 for 21Q3 is 39.2%. If the energy sector is excluded, the growth rate declines to 31.1%.
The estimated revenue growth rate for the S&P 500 for 21Q3 is 15.1%. If the energy sector is excluded, the growth rate declines to 12.1%.
The estimated earnings growth rate for the S&P 500 for 21Q4 is 22.2%. If the energy sector is excluded, the growth rate declines to 15.3%.
Revisions still rising:


Trailing EPS are now $196.66. 2021e: $201.34. 2022e: $220.75
TECHNICALS WATCH
My favorite technical analysis firm remains concerned of the lack of interest in small caps. Demand is strengthening in larger caps but there is no broad demand intensity.
Even among large caps, demand is concentrated on fewer names as the equal-weighted S&P 500 Index is not keeping pace.
Maybe the market is telling us something about smaller companies going forward…
But analysts are not seeing any specific earnings problems so far:

And relative valuations are fairly uniform


 Lohman via The Market Ear
 Evergrande Averts Default Again by Making Second Late Payment