The enemy of knowledge is not ignorance, it’s the illusion of knowledge (Stephen Hawking)

It ain’t what you don’t know that gets you into trouble. It’s what you know for sure that just ain’t so (Mark Twain)

Invest with smart knowledge and objective odds

THE DAILY EDGE: 26 OCTOBER 2021

NABE Survey Panel Foresees Further Economic Growth Over Next 12 Months, While Shortages, Higher Resource Prices Start to Affect Firms’ Decision Making

• The net rising index (NRI) for profit margins—the percentage of panelists reporting rising profits minus the percentage reporting falling profits in Q3 2021—is 25, a strong reading, but also a marked decline from the Q2 2021 record high of 35. This is the fifth consecutive survey in which the NRI is positive. The services sector has the largest profit margin NRI for the quarter at 35.

• The NRI for prices charged during Q3 2021 rose 12 points to 40, up from the Q2 2021 reading of 28. No respondents indicate their firms charged lower prices during Q3, and none expect their firms to cut prices over the next three months. Goods-producing firms lead the increase in price hikes, with 85% of respondents from that sector reporting that their firms charged higher prices in Q3, and 92% expecting price increases during Q4.

• The NRI for materials costs in Q3 2021 rose to 70—up from 59 in the previous quarter, and the highest reading since Q2 2008. Seventy percent of respondents report cost increases in Q3, up from 61% in Q2. NRIs for all sectors are positive, led by the transportation, utilities, information, and communications (TUIC) sector at 100, and followed by the goods-producing sector at 92. The NRI for expected costs in the next three months rose to 69 in the October survey, up from 50 in the July survey.

• The percentage of respondents indicating that wages rose in Q3 increased to 58% from 51% in the July survey. This is the fifth consecutive increase in the NRI for wages.

• Hiring decelerated during Q3 2021, resulting in the NRI for employment declining from 28 in the July survey to 23 in the October survey. Thirty percent of respondents cite increased employment at their firms during Q3, with 7% reporting declines.(…) The forward-looking NRI for employment fell to 24 in the October survey, down from 36 in the July survey. (…)

• According to panelists, the biggest downside risk to their company’s outlook is increased cost pressures, cited by 33% of respondents. (…)

• Almost two-thirds (65%) of respondents indicate that their firms will implement a flexible/hybrid work environment even after the pandemic subsides— up from 61% in the July survey.

• None of the panelists indicates that their firms’ labor shortages (if applicable) will abate by the end of 2021. Thirty-six percent of panelists expect this will happen sometime in 2022, and 14% specify it will happen in 2023 or later. Compared to results in the July survey, these shares are up from 18% and 10%, respectively. Nearly a quarter (24%) of panelists cites “Don’t know/NA,” indicating the uncertainty in the labor market.

• Half of the panelists indicates that their companies are experiencing delays or shortages in receiving materials or other inputs, up from 40% in the July survey, with those from the goods-producing sector accounting for the largest share holding this view. (…)

• Despite the increase in shortages and delays compared to those reported for Q2 in the July survey, panelists indicate that their firms are slightly less willing to push the higher costs on to customers. Indeed, 19% of panelists indicate that their firms are passing along these higher costs to their customers, down moderately from 22% in the July survey, with the largest share coming from the goods-producing sector. Twenty-one percent of panelists indicate that their firms are experiencing shortages, but not passing along the higher costs, up from 17% in the July survey.

• Thirty percent of panelists—led by those from the more labor-intensive services and FIRE sectors—anticipate that if their firms are experiencing higher input costs, they expect them to be permanent. This is up from the 22% who cited this in the July survey. Twenty-one percent of respondents anticipate that the increase in costs will be only temporary, down from 34% in the previous survey, and led by respondents from the more materials-intensive goods-producing sector. Nearly one-third (32%) of respondents indicates that their firms are not experiencing any significant cost increases, up from 27% in the July survey. (…)

Markit:

Average input costs consequently rose at record rates in the US, UK, Eurozone and Australia, with input costs in Japan rising at a pace not seen since 2008. Faster rates of increase were registered for both manufacturing and service sector costs across the major economies.

Prices charged also rose at accelerated rates as these higher cost burdens were passed down to customers, with rates of inflation reaching new survey highs in the US, Eurozone and UK and rising to the highest since 2018 in Japan.

unnamed (88)

Inflation Pinches Restaurants, but Customers Seem Willing to Split the Check Casual-dining stocks such as Brinker International are logging a major hit to profits from food and labor costs but should be able to pass more of it through in the future

Brinker International, EAT -0.18% owner of Chili’s, said last Tuesday that it earned 34 cents a share on an adjusted basis in its fiscal first quarter, which ended in September—far below Wall Street analysts’ estimate of 68 cents a share.(…) For Brinker, labor expense as a share of total revenue was up 1.5 percentage points from a year earlier while the share of food costs rose 0.6 percentage point.

That damaged the bottom line despite continued strong   demand: Total revenue grew by 11% from the same quarter two years earlier, before the pandemic began. That growth could have been even stronger if it weren’t for the spread of the Delta variant during the summer. (…)

Brinker shares are down by about one-third over the past six months while Cheesecake Factory stock has shed about 28% over that period and BJ’s shares have lost about 36%. (…)

Brinker is raising prices by 3% to 3.5% this year to address higher costs. Pricing power is limited in the restaurant industry, but there is reason to believe that strong customer demand will absorb higher costs in the months ahead. (…)

From recent conference calls (courtesy of The Transcript):

  • “In this Q3, also as we expected, we probably saw the highest inflation increase ever year-over-year. I mean 6.5% which is sitting in the Q3 P&L. Frankly, in 22 years, I never had a single quarter with that kind of inflation…going forward, we don’t expect that the inflation will quickly fall off and will be short term. But by definition that it will carry over into next year.” – Whirlpool (WHR) CEO Marc Bitzer
  • “…as oil and gas prices increased, we are seeing improved energy sector demand. These positive market dynamics are driving strong steel demand across the platform. The steady demand, coupled with continued historically low absolute inventory levels throughout the supply chain, continue to support strong steel selling values, especially within the flat rolled steel market.” – Steel Dynamics (STLD) CEO Mark Millett
  • “…it does feel like there is a lot of legs to this inflation story. I always hesitate to predict the macro, but in terms of innings it still feels like relative early innings, and I say that, because of product scarcity, with what’s happening with freight and with — what’s happening with labor the extreme shortages. It just seems like there is still ways to go and that’s consistent with most folks that I talked to. So I would say still relatively early innings of the story” – MSC Industrial Direct (MSM) CEO Erik Gershwind
  • “…we anticipate significant supply chain inflation in fiscal 2022 due to higher cost related to raw materials, packaging and logistics.” – Simply Good Foods (SMPL) CFO Todd Cunfer
  • “Despite higher prices, we are still sustaining a higher double-digit percentage retail pace currently than 2 years ago.” – Winnebago Industries (WGO) CEO Michael Happe
  • “I think the transparency around wages is very high. So workers know exactly what they’re being paid today and what opportunities they have nearby that would pay more. And that’s why you see this increase in quit rates because workers are looking at the opportunities.” – ManpowerGroup (MAN) CEO Jonas Prising
  • “PC demand remains very strong. And we believe that 2021 TAM will grow double-digits even as ecosystems shortages constrain our customers’ ability to shift finished systems. Dell, HP, Lenovo, along with other OEMs and ecosystem partners agree that PCs are now a structurally larger and sustainably growing market.” – Intel (INTC) CEO Pat Gelsinger
  • “…in the near term, the light vehicle outlook will mainly be determined by the evolution of the situation around semiconductors. In North America, the industry continues to struggle to meet consumer demand for new vehicles due to the shortage of semiconductors. Inventory of new vehicles in the U.S. ended September below 1 million units, the lowest level seen for at least 35 years.” – Autoliv (ALV) CFO Fredrik Westin
  • “In terms of some of the pressures year-over-year. I mean, it really is a lot driven by fuel. The cost per gallon and if I’m looking at it year-over-year is going to be up anywhere from call it 75 to 80%. And that’s just very tough to overcome, especially with flat volumes, because that’s essentially how we’re looking at things and you think about our volume guidance in the 5% for full year.” – Union Pacific (UNP) CFO Jennifer Hamann

CFOs Plump Salaries, Perks to Land Elusive New Employees Amid the ‘Great Resignation,’ companies have to offer compensation that stands out in order to draw new workers—and hold on to the ones they have

(…) Workers handed in a seasonally adjusted 4.3 million resignations in August, a record since tracking began in 2000 that came after months of elevated departures, according to the Bureau of Labor Statistics. Jobless claims last week dropped to the lowest level since March 2020.

The “Great Resignation” is exacerbating skills shortages across industries and forcing companies to pay more, driving up costs at a time of already high inflation. In a survey released last week, chief financial officers at U.S. businesses said quality and availability of labor was their No. 1 concern, with three-quarters of them stating they have difficulty hiring, according to Duke University’s Fuqua School of Business, which conducted the poll with the Federal Reserve Banks of Atlanta and Richmond.

Companies plan to keep hiring new workers and increasing non-wage compensation—for example, for healthcare and other benefits, the survey of 301 CFOs found. Wage bills are forecast to rise by 6.9% this year and next, while wages for new hires are set to rise by about 10%, according to the survey. (…)

“We expect these salary increases to be permanent,” Mr. Graham [professor of finance at the Fuqua School of Business] said. “And they absolutely increase costs for the firms, putting pressure on the firm to increase prices of their own products and thus increasing inflation.” (…)

“It feels like the balance of power has changed from the recruiter to the recruit,” CFO Debbie Clifford said. “I have never seen a market like this in my career.” (…)

Salary growth at companies in the S&P 500 has been flat in recent years, with median compensation per employee totaling $70,496 in 2020, up from $68,410 in 2017, according to MyLogIQ, a data provider. (…)

Team Biden is making the situation worse (Nordea)

(…) Vaccine mandates are intensifying the distortions on the US labour market.

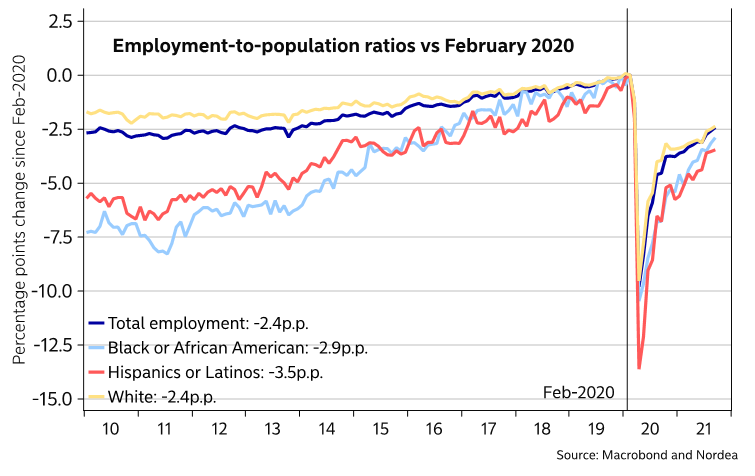
While employment-to-population ratios suggests there should be lots and lots of wage-depressing slack in the labour market, an updated Beveridge curve suggests otherwise – that the equilibrium rate of unemployment/NAIRU (or whatever the economist priest-class calls it nowadays) has surged.

There should be massive slack according to EPOP ratios

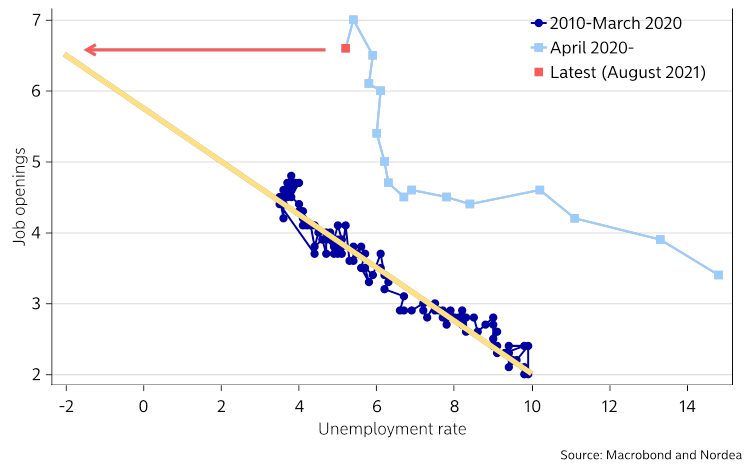
Pre-pandemic Beveridge curve suggests an unemployment rate at -2%

The pre-pandemic relationship between job openings and the unemployment rate (the so-called Beveridge curve) suggests that we ought to have been seeing a -2% unemployment rate. However, with workers afraid of the virus, or having trouble to find child care, trying to move from the service sector to the goods sector, NAIRU will be higher at least for a while. Thousands upon thousands of workers have also been fired due to vaccine mandates, which is intensifying worker shortages in some regions (and reducing the flexibility of the US labour market). This is inflationary. Jobless New York nurses are of course welcome to Florida but relocating takes time and it boosts frictional unemployment and thus NAIRU – again at least temporarily.
  • Kentucky has the highest rate of job quitters in the nation. Kentucky has a large concentration of jobs in warehousing and transportation — two sectors that have seen employees flee for better working conditions and pay. The rate of job openings in Kentucky (8%) is among the country’s highest (second only to Alaska, 9%). At a national level, it’s 6.6%. There are two open jobs for every unemployed Kentuckian. That doesn’t beat out Nebraska, however, which has three available gigs for every jobless person. The place with the lowest quits rate? D.C. (Axios)

unnamed - 2021-10-26T074830.831

(Bureau of Labor Statistics; Chart: Will Chase/Axios)

Europe’s Power Prices Rise on Growing Cold Weather Predictions

German and French month-ahead power rise on cold weather predictions

EARNINGS WATCH

imageWe now have 119 reports in, an 83% beat rate and a +13.9% surprise factor. Deutsche Bank says that a large part of the beat so far is due to loan-loss reserve releases by banks. Excluding those, the surprise factor for the S&P 500 in aggregate is running at a more modest 8.0%, and for the median company at 5.2%, indicating that the headline beats have not been broad based.

Interestingly, with nearly 25% of companies having reported, overall margins are up significantly as blended earnings growth is seen at +34.8% against revenues up 14.4%.

So far, only 3 sectors are not showing improving margins: Consumer Discretionary, Staples and Utes, sectors at the very end of the price pipeline.

unnamed - 2021-10-26T084031.109

(FactSet; Chart: Thomas Oide/Axios)

TECHNICALS WATCH

Stocks’ Internal Momentum Has Turned Up

Large caps:

But not small caps:

Hence, NYSE not breaking out just yet:

Many times over the past couple of decades, we’ve discussed the idea that stocks are less likely to suffer a large drawdown in the following months when the advance/decline line breaks out to a new high. We typically use the NYSE Advance/Decline Line, but our version of that indicator hasn’t quite made it over the hump. It very well might on Monday if stocks have a good day.

Below, we can see that since 1928, the S&P 500 was three times more likely to suffer a 10% decline at some point within the next three months if the S&P’s Advance/Decline Line was not at a multi-year high. When it did break out to a new high, as it did on Friday, there was only a 4.6% probability of a 10% or greater decline within the next few months and less than a 2% chance of a 20% decline. Since 1928, the only two instances were the Black Monday crash in October 1987 and the pandemic crash in March 2020.

But The Market Ear notes a changing leadership:

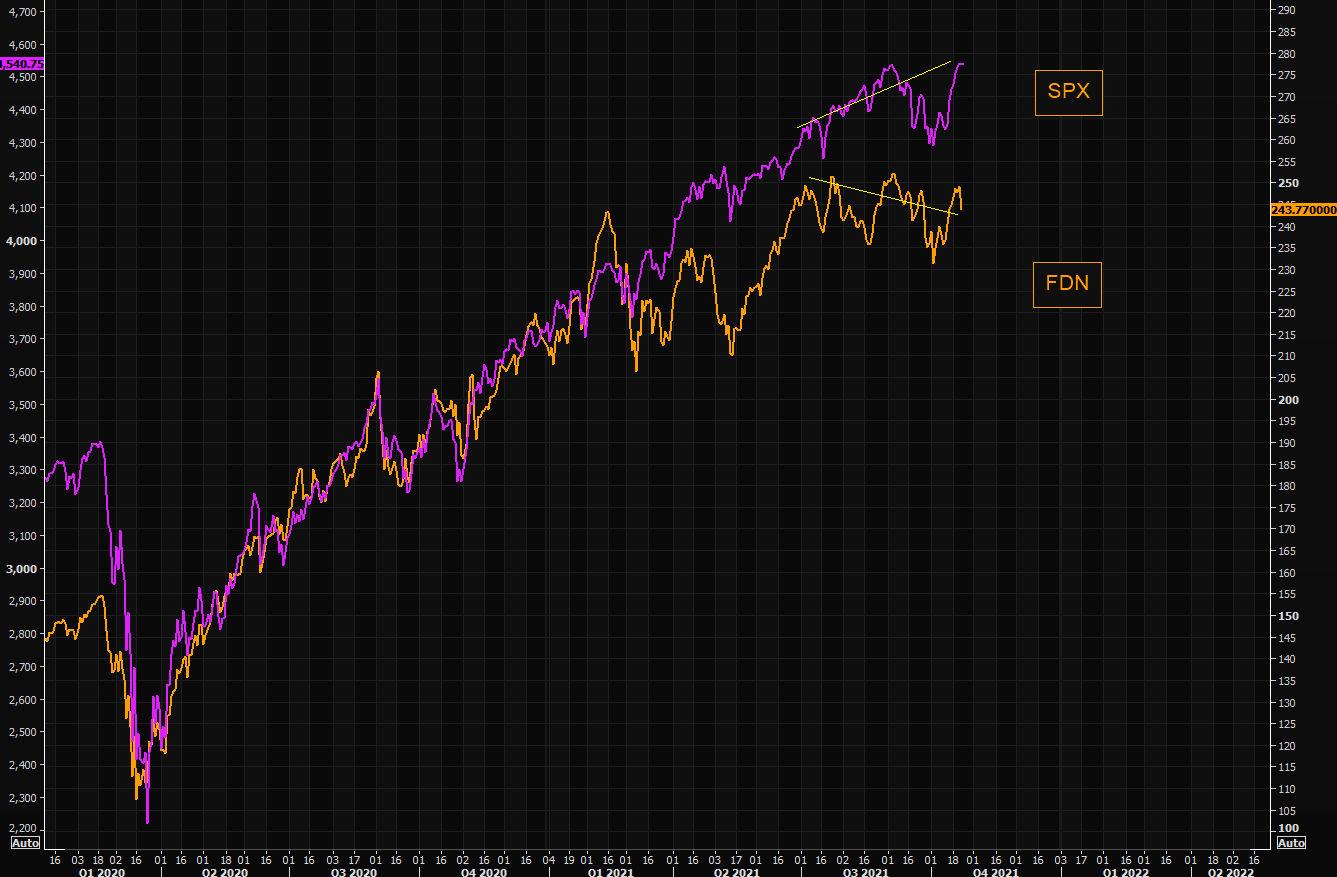
Big tech remains unimpressed with the latest SPX all time high. Big tech (here represented by the FDN index) hasn’t even been able to try all time highs and continues fading the SPX since mid July.

Note that the FDN hasn’t moved since the euphoria highs in mid Feb, while SPX is up some 600 handles since then.

Can this market continue moving higher without the pillar of this market joining?

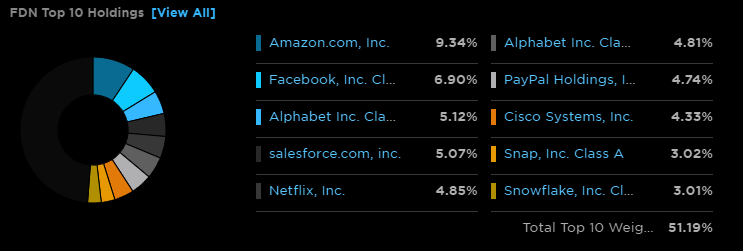
Chart 2 showing the top 10 components of the FDN index.
etf.com

Seasonality is positive for the next 2 months as Horan illustrates:

S&P 500 Seasonality Chart

LIQUIDITY WATCH

Maybe an early 2022 story:

Yellen ready to zap dollars while Powell is going taper (Nordea)

Treasury Secretary Yellen has stated that the debt ceiling needs to be fixed by early December, providing us with a new so-called X-date. Fixing the debt ceiling would enable the Treasury to rebuild its crisis account (TGA) at the Fed, which will zap more than 750bn of dollar liquidity over a couple of months – if the latest refunding estimate of a 800bn target for the TGA is to be believed. This boils down to quantitative tightening (QT).

At roughly the same time, the Fed is expected to start tapering its bond purchases. Assuming both processes unfold in December through March, Fed may add 340bn of USD via its QE program while the UST will sterilize >750bn of USD – a net negative of >400bn!

Less liquidity and more issuance could be factors which will underpin the USD in unexpected ways as Christmas starts to approach – perhaps even a Bad Santa Powell will pay you a visit?

  • The U.S. regulator is poised to rein in the $131 billion stablecoin market. A report this week will say the SEC has significant authority over tokens like Tether, people familiar said. It will also urge Congress to specify coins should be regulated like bank deposits. (Bloomberg)
Chinese Developer Modern Land Fails to Repay $250 Million U.S. Dollar Bond The Hong Kong-listed real-estate company that focuses on green projects, failed to repay the bond that matured Monday, adding to a string of missed payments by Chinese real-estate companies.

In a statement Tuesday, the Beijing-based company attributed the missed payment to an unexpected cash crunch caused by “factors including the macroeconomic environment, the real-estate industry environment and the Covid-19 pandemic.”

Modern Land didn’t say if the failure to repay the bond would immediately constitute an event of default, or whether it would trigger cross-default provisions on other debts. Credit analysts at Lucror Analytics called the incident a default in a note to clients. (…)

THE DAILY EDGE: 25 OCTOBER 2021: Boxed Fed!

FLASH PMIs

U.S. private sector businesses recorded a sharp and accelerated upturn in output led by the service sector during October, with growth the strongest for three months, albeit still much weaker than seen earlier in the year.

However, October also saw a survey-record rise in backlogs of work as firms struggled to meet demand due to supply chain bottlenecks and labour shortages, in turn driving the steepest rise in prices yet recorded by the survey.

Adjusted for seasonal factors, the IHS Markit Flash U.S. Composite PMI Output Index posted 57.3 in October, rising from 55.0 in September to signal the fastest uplift in activity for three months and one that was sharp overall. Stronger growth was driven by the services sector, which registered the quickest rate of expansion since July. Meanwhile, the latest rise in factory production was the softest since July 2020 and only mild, as goods producers continued to be severely hampered by material shortages and supply chain delays.

image

At the same time, inflows of new work to private sector firms rose further, extending the current sequence of improving demand to 15 months. The rate of new order growth slowed slightly since September to the weakest since December 2020, but was nonetheless solid.

Stronger sales placed further pressure on business capacity during October. The level of outstanding business rose at a series record pace, with respondents linking the latest rise with supply issues and a lack of staff. Subsequently, companies stepped up their hiring efforts in October. Employment increased at the quickest pace since June in spite of further reports of difficulties sourcing candidates and retaining staff.

October data also highlighted stronger inflationary pressures across the US economy. Average input prices rose at a survey record pace, with firms attributing higher costs to supply issues, material shortages, greater transport fees and increased wage bills. Subsequently, the rate of selling price inflation for goods and services also hit a new series peak.

Finally, the level of sentiment regarding output in the year ahead dipped to the joint-lowest in eight months (on a par with July), with many companies noting concerns surrounding ongoing supply issues, labour shortages and price pressures.

The seasonally adjusted IHS Markit Flash U.S. Services PMI™ Business Activity Index rose from 54.9 in September to 58.2 in October, to signal the most marked expansion in services activity for three months.

Driving growth in October was the quickest rise in inflows of new work since July, that was commonly attributed to stronger demand conditions as COVID-19 worries eased during the month.

Concurrently, service providers recorded more intense capacity pressures amid reports that firms were struggling to cope with growing sales due to labour issues and supplier delays. Notably, the rate of backlog accumulation was the most marked in 12 years of data collection.

Companies did, however, raise their workforce numbers at the quickest rate since June during October, although some panellists reported issues finding candidates and filling open positions.

October data also pointed to a continued spill-over of inflationary pressures. The rate of input price inflation accelerated to the second-fastest on record, and was only slightly weaker than May’s peak. Higher transportation costs, wages, supplier fees and material prices were cited by panellists as the primary drivers of inflation in October.

Subsequently, service providers upped their average charges for the seventeenth month running. The rate of increase quickened rapidly since September and was the steepest on record.

Operating conditions faced by manufacturers continued to improve in October, albeit at a weaker pace, as highlighted by the IHS Markit Flash U.S. Manufacturing Purchasing Managers’ Index™ (PMI™) falling from 60.7 in September to 59.2 in October. The latest figure pointed to the slowest improvement in the health of the sector since March, albeit one that was among the strongest on record and sharp overall.

The slower improvement in conditions reflected a weaker expansion in output and a moderation in order book growth during October. Factory production rose only modestly, with the pace of increase the slowest since July 2020 as output continued to be hampered by supply chain issues and shortages. October saw a record lengthening of suppliers’ delivery times. Supply issues and sustained sales growth prompted firms to further increase their buying activity and inventories.

The rate of increase in new orders eased to the slowest for eight months, but remained sharp overall. Survey respondents mentioned that order books were again buoyed by strong client demand. At the same time, material shortages, combined with logistical issues and greater commodity prices, were all linked to a further rise in average input costs in October. The rate of inflation surpassed August’s record to reach a fresh series high. Factory gate charges also rose at the fastest pace in the series history as firms continued to pass greater cost burdens through to clients.

Eurozone business activity growth slowed sharply to a six-month low in October amid increasing supply bottlenecks and ongoing COVID-19 concerns, dropping most markedly in manufacturing though also cooling in services. Survey-record price increases were meanwhile reported as firms sought to pass an unprecedented rise in costs on to customers.

While job creation accelerated to the joint-highest in 21 years as firms boosted capacity to meet demand, optimism about the outlook was hit by supply concerns linked to the pandemic in manufacturing in particular.

The headline IHS Markit Eurozone Composite PMI® fell for a third successive month in October, according to the ‘flash’ reading*, dropping from 56.2 in September to 54.3. The decline indicates a further cooling of the rate of expansion from July’s 15-year high. However, although the October expansion was the weakest since April, the latest reading remains above the survey’s pre-pandemic long run average of 53.0 to signal above-trend growth.

image

Growth slowed especially sharply in Germany, down to the lowest since February, and slipped to the weakest since April in France. The rest of the region as a whole also recorded the slowest expansion since April.

By sector, services outperformed manufacturing for a second month running, the factory sector having now reported a slowdown in growth for a fourth straight month to register the weakest increase in production seen over the past 16 months.

Similarly, while growth of new orders edged higher in services, a slower rate of demand growth was seen in manufacturing. Measured overall, the resulting rise in new orders recorded during October was the slowest since April.

image

Weakened factory output growth – led by a renewed decline in France and near-stalling of production in Germany – was commonly attributed to supply constraints. Suppliers’ delivery times lengthened to an extent exceeded over more than two decades of survey history only by that seen back in May, as supply shortages and transportation problems continued to worsen.

The autos and parts sector reported the worst performance, with output falling sharply again in October and at an increased rate.

While the service sector saw more robust growth than manufacturing, its rate of expansion cooled for a third month running to reach the lowest since April. Markedly weaker services growth in Germany contrasted with a slight uptick in France, though the rest of the region also saw a moderating expansion.

While some of the slowdown in services reflected a waning of the summer rebound from the fall in activity seen at the start of the year, especially weak service sector performances were recorded for travel, tourism and recreation, reflecting concerns regarding COVID-19. Conversely, strong growth was seen for healthcare, as well as media, banking and non-banking financial services.

Backlogs of work meanwhile continued to rise at an elevated pace. Although the rate of increase moderated to the lowest since April, the survey once again signalled that capacity was stretched both in manufacturing and services, with the former once again reporting an especially marked increase in uncompleted work.

Hiring was stepped up as firms sought to clear backlogs, resulting in a jobs gain that matched July’s two-decade high. Jobs growth accelerated in both Germany and France, and notably was one of the fastest in 21 years in the rest of the region.

By sector, job growth edged up in both manufacturing and services, the former running below recent peaks as material shortages obviated the need for extra workers in some cases, though the latter saw the largest gain since 2007.

Shortages were meanwhile once again seen as the key driver of higher prices for many goods and services in October, leading to a survey record increase in firms’ input costs. An unprecedented input cost increase was recorded in manufacturing while service sector costs rose at the sharpest rate since September 2000.

Selling price inflation likewise accelerated as firms passed higher costs on to customers, reaching the fastest in almost two decades of comparable survey history both in manufacturing and services.

Looking ahead, future sentiment moderated for a fourth consecutive month to the lowest since February. Although the outlook brightened slightly in services, optimism in manufacturing hit the lowest for a year, largely due to concerns over the lingering impact of the pandemic on supply chains and prices.

image

Activity at Japanese private sector businesses returned to expansion territory at the start of the fourth quarter of 2021, according to the latest flash PMI data. The rise was the first in six months and came as the dominant service sector registered an increase in activity for the first time since January 2020. Moreover, manufacturers reversed the slight decline seen in September to indicate growth for the eighth time in nine months. Panel members commonly associated the slight recovery to a reduction in COVID-19 cases and looser pandemic restrictions.

 image image

Private sector businesses also noted an increase in aggregate new business for the first time since April, assisted by a quicker rise in export orders. That said, firms continued to highlight sustained supply chain pressures and material shortages. As a result, input prices rose at the fastest rate in over 13 years. This contributed to the sharpest rise in output charges since July 2018.

Looking forward, companies were optimistic that business activity would improve in the year ahead. Optimism stemmed from hopes that the pandemic would end and provide a broad-based boost to demand.

Powell Says Supply-Side Constraints Have Worsened, Creating More Inflation Risk Central bank is on track to conclude asset-purchase stimulus program by mid-2022

Federal Reserve Chairman Jerome Powell indicated he is now somewhat more concerned about higher inflation and said that the central bank would watch carefully for signs that households and businesses were expecting sustained price pressures to continue.

“Supply-side constraints have gotten worse,” Mr. Powell said Friday at a virtual conference. “The risks are clearly now to longer and more-persistent bottlenecks, and thus to higher inflation.” (…)

“I do think it is time to taper,” Mr. Powell said Friday. “I don’t think it is time to raise rates.” (…)

The virus essentially removed a piece of potential economic output—concentrated in high-contact service sectors, such as leisure, hospitality and entertainment industries. Officials “want to give full time for that to come back” before deliberately cooling demand for goods and services more broadly by raising rates, he said.

On the other hand, inflation is running well above the Fed’s 2% goal. “We see that. We know how painful that is” for consumers, Mr. Powell said.

“We think we can be patient and allow the labor market to heal,” he said. But at the same time, “no one should doubt that we will use our tools to guide inflation back down to 2%” if it looked like more persistent inflationary pressures were taking root, Mr. Powell added.

About the “no one should doubt”, Bloomberg’s account of Powell’s comments could actually raise some doubts about that:

“If we were to see a serious risk of inflation moving persistently to higher levels, we would certainly use our tools to preserve price stability while also taking into account the implications for our maximum employment goal,” he said. “We think we can be patient and allow the labor market to heal,” he said.

From the FOMC’s August 2020 revised Monetary Policy Strategy statement (my emphasis):

On maximum employment, the FOMC emphasized that maximum employment is a broad-based and inclusive goal and reports that its policy decision will be informed by its “assessments of the shortfalls of employment from its maximum level.” The original document referred to “deviations from its maximum level.”

The Brookings Institute:

As Fed Chair Jerome Powell said in unveiling the new strategy, “Our revised statement emphasizes that maximum employment is a broad-based and inclusive goal.” He specifically cited the benefits that a strong economy brings to “low- and moderate- income communities.” Moreover, Powell articulated a new strategy for achieving this goal, saying that the FOMC would base policy on the extent to which employment fell short of its maximum level, rather than focusing on whether employment was deviating from its maximum level, as it had in the past. (…)

This revised statement acknowledges that the FOMC should take into account the substantial differences in labor market outcomes across communities when thinking about full employment and provides a specific strategy for achieving this.

Recall that the Fed’s new policy was framed in mid-2020 after the FOMC concluded that “the historically strong labor market did not trigger a significant rise in inflation” because “the flattening of the Phillips curve” caused a “muted responsiveness of inflation to labor market tightness”.

The new “broad-based and inclusive” strategy put more emphasis on the employment mandate than on the now more vague, floating, “long-run” 2% average inflation mandate. Powell said that “This change may appear subtle, but it reflects our view that a robust job market can be sustained without causing an outbreak of inflation.”

Today’s Fed finds itself confronted with an upside down world where inflation is rising without “maximum employment” triggering the outbreak.

Only one year after the new strategy, wages, quiet when unemployment ran below 4% in 2018-19, are rising in spite of a 5% unemployment rate (6.3% for Hispanic/Latinos and 7.9% for African Americans).

At Friday’s virtual conference, Powell, for the first time and generally unnoticed, incorporated wages into the inflation risk, per Reuters’ account :

Powell noted, “supply constraints and elevated inflation are likely to last longer than previously expected and well into next year, and the same is true for pressure on wages. (…) For now, the Fed will watch and wait”, Powell said.

When Powell warns that “we will use our tools to guide inflation back down to 2%”, he is trying to mute inflation expectations. This supposedly data-dependent Fed is now boxed inside its new policy and has no other choice than to “watch and wait” and hope that the 5 million pandemic-unemployed Americans will soon disappear along with all these transitory shortages.

The market risk is that investors remain more focused on inflation than on “maximum employment”.

(…) the cognitive transition at the core of the Federal Reserve — regional Fed banks have shown greater awareness — has been remarkably slow and partial, falling ever further behind what the vast majority of companies have been saying and doing as they cope with input shortages, soaring transportation costs and a lack of sufficient workers.

Labor has also received the message. Quit rates have risen to record highs as more workers switch jobs to secure higher compensation elsewhere. In turn, this has been forcing companies to raise wages and salaries for their existing staff as they seek to strengthen labor retention. To compound matters, strike activity is on the increase. (…)

The cognitive inertia has been amplified by the ill-timed adoption of a “new monetary framework,” which is built for the macro world of yesterday (that is, deficient aggregate demand) and not that of today (deficient supply). Political factors and posturing may also be playing a role. (…)

I strongly suspect that the coming evolution in the Fed’s inflation narrative will come with a doubling down on talk seeking to separate, substantially in time and scale, the tapering of large-scale asset purchases from interest rate increases. The longer and harder the Fed forces this distinction, the more likely it will face market resistance as fixed-income investors realize that, rather than deliver a timely and orderly recalibration of monetary policy, the Fed faces an increasing probability of having to slam on the monetary policy brakes down the road — the “handbrake turn,” to borrow a phrase from Andrew Haldane, the former chief economist of the Bank of England. (…)

It is a risk that still can— and must — be avoided, though the window for doing so is closing fast on the Fed.

As of Thursday, the gauge known as the 10-year break-even rate suggested that the consumer-price index will rise by an annual average of 2.64% over the next decade, according to Federal Reserve Economic Data, or FRED. That is up from a recent low of 2.28% in late September and the highest level since 2012.

The break-even rate is found by looking at the difference in yields between nominal Treasury bonds and Treasury inflation-protected securities, or TIPS. The rate is so called because TIPS holders can earn the same return as holders of nominal Treasurys if average annual CPI inflation matches that gap over the life of the bonds. (…)

fredgraph - 2021-10-23T064411.656

(…) In his eyes, a modest price increase of 3% to 3.5% on the Consumer Price Index (CPI) should strengthen the gross domestic product (GDP) and the stock market. (…)

“We’ve been fighting inflation for four decades in this country—always being quick to tighten, slow to ease. And the result is we’ve created some of the most sluggish growth over the last 15 years we’ve had in the entire postwar history.”

For Paulsen, a slight inflation jump, above the Fed target, would spur consumers and companies to take more risk, which in turn would pump up earnings and investment returns. He said he concluded this by examining inflation expectations, as compiled by the Cleveland Fed, going back to 1982, at the end of the double-digit era (the CPI’s rise that year was 6.1%, versus 10.3% the year before). (…)

Inflation “stokes animal spirits,” he said. “If people think prices are going to go up over time, that means you might feel better about getting higher wage hikes, for example. And it might cause businesses to expand more operations because they know they can grow into it with pricing flexibility.” (…)

Paulsen added, “There are some good things from a little higher inflation. Not runaway, but from a little higher inflation. Maybe we’re headed to that environment. And if we are, maybe we’re going to get a little better economic outcome.”

I can’t say about the economic outcome but as far as equity returns, it does not verify:

image

While we’re doing scatter plots, 4% core inflation seems like a trigger for lower P/Es:

image

Here’s the Rule of 20 P/E against Core CPI: dispersion really narrows after 6% core inflation:

image

The majority of positive returns happen below 23 on the R20 P/E. Current: 27.3.

image

INFLATION WATCH

(…) P&G, maker of Tide detergent and Pampers diapers, last week announced a third round of price increases, which will go into effect over the next few months, and told investors to expect profitability to accelerate as the year progresses. (…)

Chipotle Mexican Grill Inc. CMG -2.80% said price increases haven’t turned people off its burritos. Higher menu prices helped net income more than double in the most recent quarter, compared with a year before, despite higher labor and commodity costs. (…)

“We’re seeing price increases that are quite shocking, yet consumers have absorbed these prices without a dip in demand,” said Ben Reich, chief executive of Datasembly, which amasses granular pricing data on a range of consumer goods.

Price increases at U.S. grocers rose 1.18% on average in September compared with a year ago, nearly three times the average increase at the start of 2021, according to the firm, which this week plans to launch a publicly available pricing index for U.S. groceries. (…)

The biggest U.S. grocers say they have been insulating consumers from price increases, but that is starting to change. Kroger Co. KR 2.37% and Albertsons ACI 4.44% Cos. both said they would begin passing more costs along to shoppers to protect their own profitability.

“We’ve been very comfortable with our ability to pass on the increases that we’ve seen at this point,” Kroger finance chief Gary Millerchip said in a recent call with analysts. “And we would expect that to continue to be the case.”

So far since the start of the pandemic, nominal aggregate payrolls (employment x hours x wages) have increased 6.0% and headline CPI 5.9%. Recently, employment growth has slowed while weekly hours are near their cyclical peak. Wages? Real wages? Last 6 months inflation annualized: Food: +7.1%, Energy: +12.8%, Rent: +3.2% (+4.1% in the last 3 months, +4.9% in the last 2 months). Don’t be so comfortable…

Citi last week: “…while the US has a bigger ‘flation’ problem than a ‘stag’ problem, we continue to underline the risks to global activity coming from China, where ‘stag’ seems to be the dominant risk, since there is a chance of a deeper and longer Chinese slowdown than the market is braced for”.

But the “stag” part is not so distant in the U.S. given the increasing “flation” problem.

BTW: The Fiscal Boost Is About To Fade…

(Goldman Sachs vis The Market Ear)

Some relief coming?

  • Natural Gas Prices Drop From Recent Peak Natural-gas prices have shed 19% since hitting a 13-year high earlier this month, reversing some of a run-up that has prompted fears of exorbitant heating bills and higher manufacturing costs at a time of already high prices.

A warm start to autumn is behind the decline. With most of the country yet to turn the heat on, gas has accumulated in storage facilities faster than expected and shrunk a deficit that prompted worries over winter price surges and even potential shortages.

The forecasts that steer commodity traders call for temperatures to remain unseasonably high into November. Meanwhile, federal weather scientists said Thursday that their climate models predict a second straight winter of above-average temperatures, particularly in the South and East. (…)

The U.S. Energy Information Administration said Thursday that about one-third more gas than normal was added to domestic stockpiles last week, the latest in a stretch of above-average weekly builds. Inventories that ended August 7.7% below the recent average are now just 4.2% short, according to EIA data. (…)

(…) At Chinese ports, importers have been able to unload Australian coal—signaling a potential end to a yearlong ban on the trade—though the cargoes haven’t yet cleared customs, analysts and shipping brokers said. (…) “We estimate around five million metric tons of coking coal and three million metric tons of Australian thermal coal stockpiled in Chinese ports could be cleared into China’s domestic market,” said Rory Simington, principal analyst at energy consulting firm Wood Mackenzie. (…)

Canadian Retail Sales Slipped in September Amid Supply Constraints Receipts likely fell 1.9%, a preliminary estimate released Friday by Statistics Canada indicated, after a gain of 2.1% in August — slightly ahead of a 2% consensus estimate in a Bloomberg survey of economists. The statistics agency also revised it July data upward to show receipts fell 0.1% instead of the 0.6% contraction previously reported.

U.S. Home Sales Jumped 7% in September Increase in existing-home sales last month followed late-summer drop in mortgage rates

(…) About 23% of September existing-home sales were purchased in cash, up from 18% a year earlier, NAR said.

Many homes are selling above listing price. The typical home sold in September was on the market for 17 days, unchanged from the prior month, NAR said. (…)

The share of first-time buyers in the market fell to 28%, its lowest level since July 2015. Fierce competition has pushed home prices sharply higher and priced a number of people out of the market. While sales rose for homes priced above $250,000 in September, the number of transactions declined below that price point, NAR said. (…)

The median existing-home price rose 13.3% in September from a year earlier, NAR said, to $352,800. That compares to a 15.2% increase the prior month. Price cuts are becoming more common, too. Nearly 15% of listings lowered their prices in September, up from 7.9% in April, according to Zillow Group Inc. (…)

 image image

EARNINGS WATCH

From Refinitiv/IBES:

Through Oct. 22, 117 companies in the S&P 500 Index have reported earnings for Q3 2021. Of these companies, 83.8% reported earnings above analyst expectations and 12.0% reported earnings below analyst expectations. In a typical quarter (since 1994), 66% of companies beat estimates and 20% miss estimates. Over the past four quarters, 85% of companies beat the estimates and 12% missed estimates.

In aggregate, companies are reporting earnings that are 13.9% above estimates, which compares to a long-term (since 1994) average surprise factor of 4.0% and the average surprise factor over the prior four quarters of 18.3%.

Of these companies, 77.8% reported revenue above analyst expectations and 22.2% reported revenue below analyst expectations. In a typical quarter (since 2002), 61% of companies beat estimates and 39% miss estimates. Over the past four quarters, 79% of companies beat the estimates and 21% missed estimates.

In aggregate, companies are reporting revenues that are 2.6% above estimates, which compares to a long-term (since 2002) average surprise factor of 1.2% and the average surprise factor over the prior four quarters of 4.1%.

The estimated earnings growth rate for the S&P 500 for 21Q3 is 34.8%. If the energy sector is excluded, the growth rate declines to 27.5%.

The estimated revenue growth rate for the S&P 500 for 21Q3 is 14.5%. If the energy sector is excluded, the growth rate declines to 11.7%.

The estimated earnings growth rate for the S&P 500 for 21Q4 is 22.8%. If the energy sector is excluded, the growth rate declines to 16.1%.

Trailing EPS are now $194.85. Full year 2021: $201.35e. 2022: $220.76e.

image

image

TECHNICALS WATCH

My favorite technical analysis firm notes the improvement in overall market breadth but many important indicators remain in a downtrend. Trading volume has fallen and traditional leaders such as Tech and Consumer Discretionary are not showing much enthusiasm. Small caps continue to seriously lag with declining breadth. Prudence and selectivity remain advisable.

Ninja US intelligence officials warn companies in critical sectors on China AI and biotech industries among those alerted over concern Beijing is pushing to obtain data)