The enemy of knowledge is not ignorance, it’s the illusion of knowledge (Stephen Hawking)

It ain’t what you don’t know that gets you into trouble. It’s what you know for sure that just ain’t so (Mark Twain)

Invest with smart knowledge and objective odds

THE DAILY EDGE: 5 FEBRUARY 2021

Global Chip Shortage Takes Toll on Auto Industry A global semiconductor shortage is expected to cut Ford’s vehicle output by up to 20% in the first quarter of this year, illustrating how the fallout from the computer-chip crunch has hit the car business.

Ford said Thursday it plans to cut production of its F-150 pickup truck—the nation’s top-selling vehicle and the company’s biggest moneymaker—because of the shortage, a day after confirming a hit to output of several sport-utility vehicles. Losses of vehicle production globally in the first and second quarters could trim $1 billion to $2.5 billion from its pretax bottom line this year, executives warned while discussing fourth-quarter earnings. (…)

Most major auto makers have been forced to curtail at least some factory output; meanwhile, makers of consumer electronics have had to deal with limited supplies for their devices. The shortages come as manufacturers work to rebound from shutdowns last spring while demand rises with increased use of technology during the pandemic. (…)

As demand for laptops, gaming systems and other personal-electronics has surged during the pandemic, global chip makers have been slammed with semiconductor orders. Remote work has also fueled a boom in computing services and the data centers behind them—all of which is straining chip availability and leading to higher prices.

At the same time, car companies have in recent years become bigger purchasers of semiconductors, using them in everything from engine-control units and transmissions to the large tabletlike displays that are embedded in the dashboard. The industry’s shift to electric vehicles is additionally increasing the need for more software-based systems, analysts say. (…)

Research firm IHS Markit this week said it expects the chip shortage to dent car industry production by about 672,000 vehicles globally in the first quarter, with problems lingering into the fall. It said lead times for chips used in the auto sector typically are 26 weeks. (…)

The German auto maker [VW] has also begun pressing Berlin and Brussels to do more to promote building up a native chip industry to ensure that Europe is independent of Asian producers, where European auto manufacturers buy most of their chips.

Other car companies have also grappled with inadequate chip supplies, including Toyota Motor Corp. and Honda Motor Co. —both of which have trimmed U.S. factory output since the start of the year to manage through shortages. (…)

Mug Lockdown brings beer-can shortage (Axios)

U.S. Factory Orders & Shipments Increase During December

Manufacturing activity continues to strengthen. Factory orders rose in December for an eighth consecutive month. The 1.1% gain (-0.8% y/y) followed a 1.3% November rise, revised from 1.0%. A 0.7% December increase had been expected in the Action Economics Forecast Survey.

Durable goods orders rose 0.5% (1.9% y/y), which was revised from the 0.2% gain reported last week. Transportation sector orders eased 0.8% (-7.6% y/y) as nondefense aircraft orders fell sharply. Machinery orders strengthened 2.7% (6.5% y/y) while electrical equipment & appliance orders gained 0.7% (1.9% y/y). The full report on durable goods activity is available here. (…)

image

Euro Area Retail Sales Make Minor Rebound

Retail sales rose in December but did not gain back all the ground lost in November’s drop. December brought a month-to-month gain in sales volume of 2% in the wake of November’s 5.7% monthly drop. In fact, retail sales growth rates have become progressively weaker from 12-months to six-months and from six-months to three-months. (…)

image

image

Contrast real retail sales with the U.S.: Q4 YoY: Euro: -5.8%, USA: +2.8%

                                                                      Q4 a.r.: Euro: -9.6%, USA:  -0.8%

High five JPM’s Chase credit card data suggest U.S. consumer spending has stalled in late January.

High five But Morning Consult is more upbeat:

In January, the high-income Current Buying Conditions Index remained essentially unchanged from December, increasing by 0.18 percent during the month. While the size of the increase is not impressive, it signals that consumer spending and retail sales are turning the corner after two consecutive months of contracting.

  • Daily data also shows that the CBC Index among high-income adults rose over the course of January. Thus, even if it just maintains on average its current level for the duration of February, the high-income CBC Index in February will increase by 0.28 percent. This moderate increase in the high-income CBC Index provides a floor or lower bound for consumer spending in February.
  • Developments in the fight against the pandemic as well as additional financial support for households suggest that the high-income CBC Index will actually increase by the end of March to 110, driving consumer spending and retail sales higher by 1 to 2 percent over the next two months.
  • Over the past 12 months, the CBC Index among high-income consumers ($100,000 or more) has become the strongest indicator of consumer spending, showing a strong positive correlation with real personal consumption expenditure (.96) and real retail sales (.90).

INFLATION WATCH
Prices Rise Here, There and Everywhere (Moody’s)

Industrial commodity prices have climbed higher in response to both an actual and anticipated firming of global industrial activity. In addition, an abundance of financial liquidity as reflected by the U.S. money supply’s 25% yearly surge that quadruples 2021’s expected annual climb by nominal GDP, has added fuel to industrial commodity price inflation.

Forthcoming fiscal stimulus is likely to put upward pressure on Treasury bond yields. If the Fed attempts to limit or reverse any climb by benchmark bond yields via stepped-up purchases of Treasury bonds and federal agency mortgage-backed securities, the rapid growth of the money supply will be extended. Conceivably, more fiscal stimulus might beget more monetary stimulus in order to rein in fixed-rate borrowing costs. Such a link between fiscal and monetary stimulus lacks precedent. (…)

image

A late January survey conducted by Blue Chip Financial Forecasts found that the percent of surveyed economists who viewed inflation risks as being to the upside for this year and next rose from 78% for 2021 to 92% for 2022.

In response to upwardly revised inflation risks, the 10-year Treasury yield has climbed to a recent 1.14%. The consensus believes the 10-year Treasury yield will average 1.3% during 2021’s final quarter. However, if COVID-19 risks fade and real GDP growth breaks above 4.5% for calendar-year 2021, a 1.5% average seems more appropriate for the 10-year Treasury yield of 2021’s final quarter.

(…) the current holdings of highly liquid financial assets, or M2, by American businesses and households now exceed what they might hold under normal circumstances by $3 trillion to $3.5 trillion. Over time, the excess holdings of highly liquid assets will fund household expenditures, business capital spending, and debt repayment as well as purchases of financial and real assets.

Top-heavy amounts of liquidity show up in the personal income data. The U.S.’ extraordinarily high personal savings rate of 16.2% for 2020 more than doubled the 6.1% average of the 20-years-ended 2019 and reflects a surfeit of highly liquid assets. Calendar-year 2020’s 134% annual surge by personal savings (to a record-high $2.88 trillion) differed radically from the 3% drop by consumer spending (to $14.15 trillion). A likely normalization of the US personal savings rate will help to accelerate consumer spending in 2021.

image

Elsewhere in 2021:

[In the U.S.] A standard subscription jumps from $12.99 to $13.99 per month [+7.7%], while those on the premium tier which allows you to stream to more than one device at a time will see prices rise from $15.99 to $17.99 [+12.5%]. The base level standard-definition plan remains unchanged at $8.99 per month.

Customers in the U.K. will also see emails arriving soon announcing the new prices. The standard package goes up £1 to £9.99 [+11.1%], with premium jumping by £2 to £13.99 per month [+16.7%]. Once again, the base package remains untouched at £5.99 per month. (Forbes)

(…) Brent is on track to rise more than 6% this week. The last time it traded at $60, the pandemic had yet to take hold, economies were open and people were free to travel, meaning demand for gasoline, diesel and jet fuel was much higher. (…)

Further boosting the market, a weekly supply report showed a drop in U.S. crude inventories to their lowest since March, suggesting that output cuts by OPEC+ producers are having the desired effect.

Surprised smile South Korea unveils $43 billion plan for world’s largest offshore wind farm

South Korea unveiled a 48.5 trillion won ($43.2 billion) plan to build the world’s largest wind power plant by 2030 as part of efforts to foster an environmentally-friendly recovery from the COVID-19 pandemic. (…)

Moon attended a signing ceremony in the southwestern coastal town of Sinan for the plant, which will have a maximum capacity of 8.2 gigawatts. (…)

It said the project would provide up to 5,600 jobs and help achieve a goal to boost the country’s wind power capacity to 16.5 GW by 2030 from 1.67 GW now.

The envisaged 8.2 GW amounts to the energy produced by six nuclear reactors, or the effects of planting 71 million pine trees, officials said.

To date, the world’s largest offshore wind farm is Hornsea 1 in Britain, which has 1.12 GW capacity.

  • According to the US Energy Department, new wind projects account for annual investments of over $10 billion. There are 180 onshore and 17 offshore wind projects slated for the next 5 years with a total value of $84bn.

  • Quebec bets on wind, citing shift in cost of power At a cost of 6 cents per kilowatt-hour, its economics rival and even surpass that of new hydroelectric power

EARNINGS WATCH

We now have 263 reports in with an 83% beat rate and a +17.3% surprise factor (+3.3% on revenues!).

Q4 estimates are now +1.6%, +5.3% ex-Energy!

Trailing EPS are now $141.30 and full year 2021 $172.77 rising to $199.61 in 2022.

Corporate guidance remains pretty good:image

We sure need solid profit trends given trends in interest rates, the Fed notwithstanding:

US yield curve steepest since 2015 on stimulus hopes Investors are expecting stronger economic growth and higher inflation

The difference between the yields on the 30-year Treasury and the shorter-term five-year note reached 147.3 basis points on Thursday, the widest since October 2015.

Line chart of Difference in yields between 30-year and 5-year Treasuries (bps) showing US yield curve hits steepest point since 2015fredgraph - 2021-02-05T063507.689

fredgraph - 2021-02-05T064017.939

Bank of America thinks the end of TINA may be in sight. Currently, over 60% of the stocks in the S&P 500 carry a dividend yield higher than the 10-year Treasury yield, which is around 1.13%. Should benchmark rates climb to 1.75% by year end — Bank of America’s current house view — that total would drop to 44%, making the bullish TINA mantra for stocks “less compelling,” the analysts wrote. (…)

“Both ends of the equity duration spectrum are at risk: long duration growth stocks that benefited from a falling discount rate could suffer a reversal of fortune. And short duration high-coupon stocks with no room to raise dividends would pale relative to bond income.” (…) (Bloomberg)

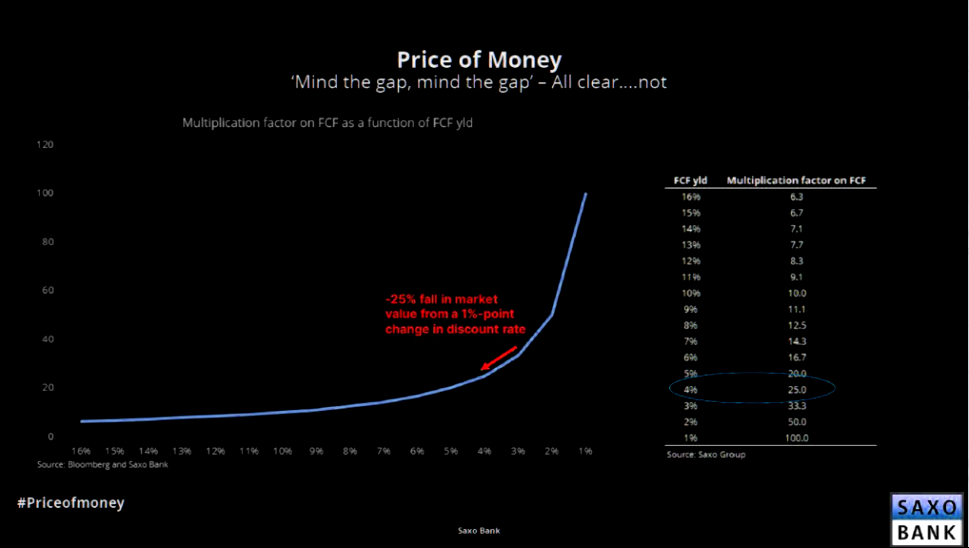
Many tech stocks trade like zero coupon bonds as the Market Ear explains:

NASDAQ is the equity duration play, i.e tech is the winner of crashing yields, but it works both ways. NASDAQ is the biggest and most beautiful place, but the latest moves in yields could be starting to make a relative impact on tech. Watch that 1.15% level in the 10 year closely.

First chart shows NASDAQ vs US 10 year inverted.

Second chart shows the multiplication factor on FCF as a function on FCF yield. That is the price of money…

TECHNICALS WATCH
  • 13/34–Week EMA Trend (all charts via CMG Wealth)

  • Volume Demand vs. Volume Supply
  • S&P 500 Index vs. 50-Day & 200-Day Moving Average Cross
Surprised smile TikTok rival Kuaishou hits $160bn valuation as shares surge after IPO Chinese video app’s market debut is biggest in tech sector since Uber offering in 2019

The FT reports that the stock closed up 160% on its first day. There are many unbelievable facts here:

  • The $160B valuation is for a company that derives most of its revenues from its cut of the tips viewers shower on content creators.
  • Revenues for F2020 totalled $6.3B. Price to sales: 25.4x
  • Kuaishou lost $1.4B last year.
  • Lastly, more than 262M Chinese users check the Kuaishou app an average of 10 times a day, spending an average of 86 minutes watching videos and chatting with the creators who make them. That is 1.5 hour per day, 10.5 hours per week, watching short vids! I bet they also check a few other similar apps…

Bloomberg reports that Robinhood’s app has been downloaded more than 600,000 times last Friday alone:

unnamed - 2021-02-05T071307.398

They seem to enjoy the penny lane. Won’t last:image

COVID-19
  • Approximately 15% of the UK, 8% of the US, and 2.5% of the EU and Canada populations have now received their first dose. Overall, we have left the points at which 50% of the population have received their first dose unchanged at April for the UK, May for the US, and June for the EU. However, we expect Germany to hit this 50% point in June (vs. May previously), at the same time as Italy and Spain, followed by France in July. The interaction of a slow start to vaccinations and new strains suggests that substantial easing of lockdowns across the EU risks slipping beyond March. (Goldman Sachs)
  • Goldman had a conf call with former FDA Commissioner Dr. Scott Gottlieb. Here are the key take-aways. First, The near-term outlook is positive and the pace of vaccinations could further accelerate. Dr. Gottlieb sees vaccinations accelerating from the current pace of 1.3mn/day to 1.6-1.7mn vaccinations/day in a “few weeks” solely based on current supply. If JNJ’s vaccine is approved in March, Dr. Gottlieb believes we could achieve up to 2.5mn vaccinations/day. Second, demand rather than supply could be the concern by late spring. Third, a “return to normalcy” in 2021 is achievable, however normalcy will look different from the past. It is possible, per Dr. Gottlieb, that by next fall, COVID cases resemble a really bad flu season, with ~60k annual deaths, not 600k. (The Market Ear)
  • J&J Seeks FDA Authorization for One-Shot Vaccine The move sets the stage for a potential third vaccine to become available in the U.S. within weeks.
  • Canada Says No Cruises Until 2022, Shutting Down Alaska Trips

THE DAILY EDGE: 4 FEBRUARY 2021: Q4 Earnings Up YoY!

U.S. SERVICES PMI: Sharp upturn in business activity amid stronger client demand

January PMITM data signalled a sharper expansion in business activity across the U.S. service sector. Excluding November’s recent high, the latest upturn was the fastest since March 2015, amid a stronger rise in new business. Foreign client demand also picked up, as new export orders returned to growth. Despite a notable improvement in business confidence, the rate of job creation eased as pressure on capacity dwindled and concerns regarding the short-term outlook remained.

Meanwhile, cost burdens soared once again, with the rate of input price inflation the fastest since the survey began in 2009. Firms largely passed on higher costs to clients through a marked rise in charges.

The seasonally adjusted final IHS Markit US Services PMI Business Activity Index registered 58.3 in January, up from 54.8 in December and [much] higher than the earlier released ‘flash’ estimate of 57.5. The rate of growth was the second-sharpest in almost six years, with firms linking the upturn to stronger client demand and an increase in new business.

image

January data indicated a strong rise in new orders. Excluding November’s recent high, the pace of expansion was the fastest since February 2019 as sales growth regained momentum. The increase was often attributed to greater demand from new and existing clients.

At the same time, foreign customer demand picked up, as new business from abroad returned to expansion. Although only marginal, the rate of growth was the fastest for three months.

Service providers registered another marked increase in input prices at the start of 2021. The rise in cost burdens was the sharpest since data collection began, and the rate of increase has now accelerated for three successive months. Higher input prices were reportedly linked to greater fuel, transportation and supplier costs, especially for PPE.

In line with strong client demand and a spike in input prices, service providers recorded a steep increase in selling prices during January. The rate of charge inflation was the second-quickest on record, only slower than the peak seen in November 2020.

Despite a faster rise in new business, a number of firms reported sufficient capacity to process incoming new work in January. As a result, companies increased workforce numbers only marginally, and at the slowest pace since July 2020.

Reflecting less pressure on capacity, backlogs of work rose fractionally during January. The increase in outstanding business was the softest in the current seven-month sequence of expansion.

Finally, service providers signalled a stronger and robust degree of confidence in the outlook for output over the coming year in January. Optimism was the second-highest since May 2015, with firms linking positive sentiment to hopes of a successful vaccine roll-out and an end to the pandemic during 2021. Many companies also noted that they expect client demand to pick up further once restrictions are lifted.

The IHS Markit Composite PMI Output Index* posted 58.7 in January, up from 55.3 in December, to signal the quickest rise in private sector business activity since March 2015. Sharper rises in manufacturing and service sector activity supported overall growth.

image

New business growth also accelerated, largely driven by a robust increase in client demand at manufacturing firms. The rate of expansion in private sector new orders was the second-fastest since September 2018. At the same time, firms signalled a renewed rise in new export orders.

Deteriorating vendor performance and supplier prices hikes led to the steepest rise in cost burdens since data collection began in October 2009. As a result, private sector output charges increased significantly at the start of 2021.

Rising costs have fed through to higher prices charged for goods and services, which rose in January at a rate not seen since at least 2009. Inflation therefore looks likely to be pushed higher in the near-term. However, some of these price pressures reflect short -term supply constraints, which should ease in coming months as the recovery builds and more capacity comes online.

Business confidence improved in January, amid stronger output expectations at service providers. Manufacturers were slightly less upbeat, but still anticipate higher output in one year’s time.

Finally, a softer rise in employment at service providers offset a quicker increase in job creation at manufacturers, as pressure on service sector capacity waned.

The ISM from ING:

The January reading of the ISM services index confounded expectations of a dip to post a 23-month high of 58.7 (consensus 56.7). New orders rose to 61.8 from 58.6 while business activity held at a robust 59.9 where anything above 50 equates to expansion. The main negative was a 10 point drop in new export orders, but this index is not seasonally adjusted and could be related to the Chinese New Year as well as the effective lockdowns in Europe.

Meanwhile employment jumped to 55.2 from 48.7. With both the manufacturing and services ISM services reporting such strong employment jumps it bodes well for job creation in the months ahead. This follows on from the today’s ADP private payrolls number, which also came in above expectations posting a 174,000 gain versus a consensus forecast of a 70,000 rise.

(…) decent activity, rising prices, rising jobs and a vaccination program gaining momentum will increase doubts that the Fed will continue with QE on its current scale for another 12M and that it will be more than 3 years before the Fed hikes rates from zero.

The U.S.-Europe PMI split

Data: Investing.com; Chart: Michelle McGhee/Axios

Biden Signals Openness to Sending $1,400 Payments to Smaller Group President Biden indicated he was open to sending $1,400 payments to a smaller group of Americans in the next round of coronavirus relief legislation and changing the overall price tag of his $1.9 trillion plan, according to people familiar with the call.

(…) Mr. Biden also said he was flexible on the overall cost of the package, which Democrats have started advancing through Congress through a process that will allow them to pass it along party lines, according to the people familiar with the call. He said Democrats could make “compromises” on several programs in the proposal, one of the people said. (…)

In meetings with Democrats, Mr. Biden has said the GOP [$618B] plan is too small to deal with the effects of the pandemic. (…)

BTW: “If it’s $1.9 trillion, so be it,” Mr. Manchin said on MSNBC. “If it’s a little smaller than that and we find a targeted need, then that’s what we’re going to do.” (WSJ)

The Short March Back to Inflation Like today, policy makers of the 1960s had bigger worries than prices. Then a spike crushed the economy.

This is by Michael D. Bordo and Mickey D. Levy in the WSJ. Mr. Bordo is a distinguished professor of economics at Rutgers University and a visiting fellow at Stanford’s Hoover Institution. Mr. Levy is senior economist at Berenberg Capital Markets. Both are members of the Shadow Open Market Committee.

(…) Sounding the alarm about inflation is out of vogue. Skeptics point out that high deficit spending, zero interest rates and unprecedented quantitative easing didn’t spur inflation in the decade after the 2008-09 financial crisis. That experience has left a strong impression on makers of monetary and fiscal policy.

But the government response to the pandemic is dwarfing the actions that followed the financial crisis. Fiscal initiatives since last March have already authorized deficit spending equal to 17% of gross domestic product. Generous government transfers to individuals and businesses have supported household incomes and will stimulate aggregate demand for years to come. President Biden now proposes additional deficit spending equal to roughly 9% of GDP. These total deficit increases are magnitudes larger than President Obama’s American Recovery and Reinvestment Act of 2009. (…)

This is from the Committee for a Responsible Federal Budget:

(…) The output gap measures the difference between expected economic activity as measured by Gross Domestic Product (GDP) under current law and possible economic output if the economy were operating at full potential — with full employment of workers and capital — and the pandemic were not stifling its performance.

The Congressional Budget Office (CBO) projected on Monday that the nation’s output gap – the difference between actual economic activity and potential output in a normal economy – would be $380 billion for the rest of 2021. This gap will total roughly $300 billion in the last three quarters of 2021 and nearly $700 billion through 2023, the period over which most future relief would take place. Assuming CBO’s estimates are correct, President Biden’s $1.9 trillion American Rescue Plan would likely be enough to close the output gap two to three times over. This overshoot could be beneficial, but could also pose risks to the economy and the fiscal outlook

The theoretical effect of the American Rescue Plan on the economy depends on the economic multiplier associated with the new programs, but in almost any circumstance it would substantially overshoot the output gap as estimated by CBO. With a multiplier of 0.5x, for example, the plan would close 135 percent of the output gap.1 With a 1.5x multiplier, it would close the output gap 4 times over. (…)

The output gap could differ from CBO’s projections. Many forecasts and experts suggest the economy will grow faster this year than CBO estimates. A one percentage point increase in Gross Domestic Product (GDP) growth would reduce the output gap to less than $200 billion, in which case the American Rescue Plan would be large enough to close eight to ten times the output gap based on the Edelberg and Sheiner numbers. On the other hand, many have argued that CBO is underestimating full employment and potential GDP. If potential GDP were 1 percent larger than CBO’s estimate, the output gap would total $1.3 trillion through 2023 and the America Rescue Plan would close 115 to 145 percent of the output gap. (…)

While the economy can operate above its long-term potential for periods of time, it cannot do so indefinitely or sustainably. It is therefore important to understand what might happen if policymakers spend substantially more than what is necessary to close the output gap.

One possibility is that the excess funds are economically ineffective, adding to the debt without improving the economy. Thought of another way, overfilling the fiscal gap could substantially reduce economic multipliers.5 Based on estimates from CBO, adding nearly $2 trillion to the debt would shrink the size of the economy by about 0.3 percent ($100 billion) by the end of the decade while increasing annual debt service payments by roughly $40 billion in that year (and more in future years).6 These costs are probably a worthwhile consequence of addressing an economic crisis and restoring the economy to full employment but harder to justify for spending that has little or no economic impact.

A second possibility is that excess funds could lead to higher inflation, with producers responding to higher demand by increasing prices once it is no longer possible to easily increase production. In some ways, higher inflation could be helpful – it could erode outstanding household and business debt (including pandemic-related debt), lower real interest rates set by the Federal Reserve,7 and help the Fed to reset expectations toward its new flexible inflation targeting regime. On the other hand, higher inflation could also diminish the effectiveness of the fiscal stimulus, erode the value of savings (including the over $2 trillion of personal savings accumulated because of the pandemic), increase the cost of living for many households who could not easily afford it, or, in the worst case, lead to persistently high inflation and all the consequences that come with it.

A third possibility is that excessive stimulus could cause misallocations in the economy. Higher demand amidst a pandemic could lead to increased consumption and production of goods and services that are of less value in normal times. To the extent that firms and households make long-term investments in response to near-term demand, this could cause modest macroeconomic damage in the long term as well as diminishing welfare gains in the near term.

A fourth possibility is that excessive stimulus could temporarily boost economic activity far above its sustainable potential, leading to an economic cliff or crash as the stimulus fades. In their estimates, Edelberg and Sheiner explicitly assume what they describe as a “soft landing” for the economy; even in this scenario, there appears to be virtually no economic growth in 2022, which suggests unemployment would rise over that period.8 The authors warn of the possibility of a sharper and more painful contraction (a “hard landing”) when stimulus funds run out. (…)

While recent data suggest further fiscal support is needed, the package currently under discussion would likely be an overshoot.

Fathom Consulting says that “there is no sign of rising inflation in core prices across the developed world as yet. In fact, core inflation has fallen in most countries thanks to the steepest global recession of all time.”

Interesting, however, to see how U.S. and U.K. inflation have held up against steeply dropping core CPIs elsewhere. Fathom Consulting adds:

The expectation of higher inflation arises in part because of the vaccines, which mean that (in our central case anyway) demand will recover in full and probably go further than that, given the massive amount of policy stimulus, monetary and fiscal, that remains in place, and given the increase in household savings and corporate profits in aggregate that has occurred through the recession (yet another instance to add to the litany of unprecedented events over the course of the last year).

The vaccines mean that these savings and profits can be safely spent. The policy stimulus means the encouragement to spend is still there. The second half of 2021 should (vaccines permitting) see very strong growth indeed. And the economic impact is far less pronounced in the second wave than the first, even though the medical implications are as bad in some countries.

The experience of New Zealand, where the disease has for now been all but eradicated, is salutary: GDP has recovered extremely rapidly and is now above where it would have been had the pandemic not struck. Should the vaccines work effectively, something similar will be coming for the rest of us too.

And now this:

unnamed - 2021-02-04T074102.002

Data: FactSet; Chart: Axios Visuals

One-Third of U.S. Homeowners Are Equity-Rich Over Higher Values

By the end of last year, more than 30% of U.S. homeowners were considered equity-rich — meaning their property was worth twice as much as the underlying mortgage, a report showed.

Helped by low interest rates, the count of equity-rich properties in the fourth quarter of last year rose to 17.8 million of the 59 million mortgaged homes in the U.S., according to the ATTOM Data Solutions fourth-quarter 2020 U.S. Home Equity & Underwater Report released Thursday. That’s up from 26.7% in the fourth quarter of 2019. (…)

The rise in values is also helping to reduce the number of seriously underwater properties. These types of homes — defined as having a combined balance of loans secured by the property at least 25% more than its market value — have fallen by a full percentage point over the past year. They now account for 5.4% of mortgaged U.S. properties. (…)

EARNINGS WATCH

Pointing up We now have 223 reports in, an 83% beat rate and a +18.5% surprise factor. Q4’20 earnings are now seen UP 0.9% YoY from -10.3% expected on Jan. 1. Ex-Energy earnings are seen UP 4.7%. Revenues are also expected UP 0.7% (vs -1.4%).

Q1’21 earnings are now expected to jump 20.5% (was +16.0%).

Trailing EPS are now $141.30. 2021e: $172.77. 2022e: $199.61.

Earnings Season Selling

Bespoke monitors every single earnings report (my emphasis).

Using our Earnings Explorer, we found that 417 companies had reported earnings since the current reporting period began on January 11th.  As shown in the snapshot from the tool below, 84% of these companies beat bottom-line analyst EPS estimates, while 77% beat top-line sales estimates.  In terms of guidance, 14% of companies have raised forward guidance while just 2% have lowered guidance.

What has been notable about this earnings season is the price action that stocks are seeing after they report their quarterly numbers.  On average, stocks that have reported have gained 0.41% at their first open of trading after their earnings release.  This means stocks are initially reacting positively to the earnings news.  From the open to the close of trading after the initial gap higher, though, stocks that have reported have averaged a decline of 1.67%.  Combining the opening gap and the open to close move, the average full one-day change for stocks reporting earnings stands at -1.28% this season.  That’s a pretty bad number that’s indicative of a “sell the news” reaction.

COVID-19

0_All Key Metrics (52)

1R_Reg Positive (15)

U.S. Hits Pandemic Milestone With More Vaccinated Than Cases

The biggest vaccination campaign in history is underway. More than 108 million doses have been administered across 67 countries, according to data collected by Bloomberg. The latest rate was roughly 4.25 million doses a day. In the U.S., more Americans have now received at least one dose than have tested positive for the virus since the pandemic began. So far, 35 million doses have been given, according to a state-by-state tally. In the last week, an average of 1.34 million doses per day were administered. (…) At this rate, it will take 11 months to cover 75% of the population with a two-dose vaccine. [Immunizing 80% of the US population by late this year, will need vaccinations to rise to about 3mn doses a day.] (Bloomberg)

U.K. Has Passed Peak of Covid Surge, With 10 Million Vaccinated

Swiss medical regulator rejects Oxford/AstraZeneca Covid vaccine

Confused smile I DON’T KNOW WHERE I WENT WRONG!

unnamed - 2021-02-04T073412.309

U.K. Revokes Chinese TV License Citing Communist Party Link

China Executes Former Head of Asset Management Firm in Bribery Case

(…) Lai asked for or collected 1.8 billion yuan ($260 million) over a decade, the court said. It said one bribe exceeded 600 million yuan ($93 million). He was also convicted of embezzling more than 25 million yuan ($4 million) and starting a second family while still married to his first wife. (…)