CONSUMER WATCH
Household Income, Savings Rose at End of Last Year Americans’ incomes climbed for the first time in three months in December as a new round of government-aid efforts kicked in, priming the economy for stronger growth this year.
Household income—what families received from wages, investment returns and government-aid programs—climbed 0.6% from the prior month, the Commerce Department said Friday.
The rise partly reflected federal-aid programs, such as enhanced unemployment benefits, that kicked in at the end of the year. Income is expected to rise further this quarter as the government distributes federal stimulus checks of $600 to most households.
Consumer spending fell 0.2% last month, marking the second straight monthly decline. Households cut spending broadly on goods, particularly big-ticket items such as cars and household appliances, while spending on services rose only slightly.
The weak spending has left Americans with historically high savings that could enable them to boost spending later this year. The personal savings rate rose to 13.7% last month, far higher than the pre-pandemic level of roughly 8%. Excluding last year, the savings rate is at the highest level since 1975. (…)
Household income is expected to grow further in early 2021, as the federal government mails one-time cash payments of $600 to most families and provides $400 a week in special benefits to unemployed workers on top of their normal jobless compensation. And tens of millions of Americans with federal student loans have had their monthly payments temporarily waived, interest-free, since last March, freeing up hundreds of dollars a month for the typical borrower. (…)
The pandemic’s impact on employment at the lower end of the wage spectrum is making analysis of aggregate labor income difficult. As Haver Analytics’ table shows, Wages and Salaries have been rising fast in recent months (+7.0% a.r. in Q4), much faster than employment (+2.4% a.r.). On a YoY basis, Wages and Salaries are up 2.3% in December while employment is down 6.2%.
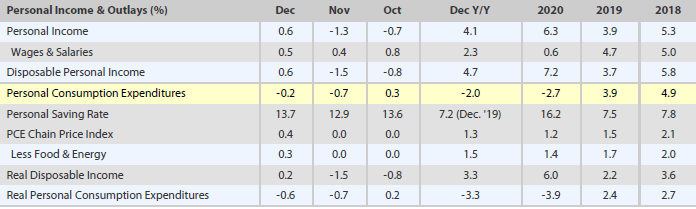
As a result, labor compensation per employee is growing 9.0% YoY, three times faster than in February 2020. The 143 million working Americans seem to be doing well, particularly the 122 millions working in service-producing industries. Per the BLS, “Within compensation, the main contributor was an increase in wages and salaries in service producing industries based on data from the Bureau of Labor Statistics Current Employment
Statistics.”
Meanwhile, government benefits rose 20% YoY in Q4 but have been gradually declining sequentially (-30%) since their May peak. No doubt that the 10 million Americans having lost their job (9 million of which in services) since February are struggling and anxiously expecting more “stimulus checks”.
Amid this bifurcated income trend, total disposable income is up 4.7% YoY in December (3.3% real) while expenditures declined 2.0% (-3.3% real) with particular weakness in Q4. The big debate is no more settled with these latest stats, perhaps even slightly supporting the “consumer bear” side given that consumers did not dip into their savings in December.
The “consumer bull” case will argue that labor income is rising nicely and that the savings rate actually declined from 16.0% in Q3 to 13.4% in Q4 in spite of rising Covid-19 cases and warnings of a rather difficult winter. Interestingly, expenditures declined 1.5% YoY during the second half of 2020, very close to the 1.4% drop in aggregate labor income per aggregate payrolls.

If the long established correlation between expenditures and labor income holds, the consumer bull case gets a lift by the recent gains in payrolls: +0.8% in October, +0.7% in November and +0.4% in December for a +7.8% annualized growth in Q4. December payrolls were only down 0.3% YoY.
Total expenditures declined 2.0% YoY in December as the 5.4% pandemic-induced drop in spending on services offset the 5.4% growth in expenditures on goods with Durables up 11.0% and Non-Durables up 2.5%. While slower than during Q3, spending on Goods remains solid.
-
Lockdowns Spur Shift to High-End Liquor Americans drinking at home are splashing out on pricier whiskey, tequila and other spirits during the pandemic, helping distillers post their strongest sales in four decades.
Tight oil supply could push crude prices to $65 by July, Goldman says
The bank said in a note on Sunday data indicated a deficit of 2.3 million barrels per day (bpd) in the fourth quarter of 2020 driven by higher demand and lower supplies from producers outside the OPEC+ group.
It forecast a deficit of 900,000 bpd in the first half of 2021, a higher level than its previous prediction of 500,000 bpd.
This could help push benchmark Brent crude to $65 a barrel by July, with less industry investment in supply skewing risks to the upside in 2022, the bank said. Brent was above $55 on Monday. (…)
“The nature of the latest OPEC+ agreement will also contribute to this fast tightening market as higher demand this spring will stress the ability of producers to restart production,” Goldman said.
Covid-19 Vaccines to Stress-Test Grocery Stores and Pharmacies The job of vaccinating much of the American public is about to fall largely on retail pharmacies, with chains like CVS, Walgreens, Walmart and Kroger saying they are ready to give tens of millions of shots a month.3

- The virus variant circulating in the U.K. will probably become the dominant strain in the U.S. and may prompt more restrictions, a top health adviser to Biden warned. (Bloomberg)
TECHNICALS WATCH
Buying has become more selective in recent weeks and volatility may well continue for a while. But longer-term indicators suggest a continued uptrend according to my favorite technical analysis service.
However, only smaller cap indices remain well above their still rising 50dma (most others are sitting on their 50dma), perhaps aided by stocks such as Gamestop (1.4% of the S&P 600 now), Bed Bath and Beyond and Renewable Energy. The S&P 500 jumped 7% in January (+13% at some point) against a 0.5% loss for the S&P 500.
Actually, the last 2 months have been essentially short stories:

EARNINGS WATCH
From Refinitiv/IBES
Through Jan. 29, 184 companies in the S&P 500 Index have reported earnings for Q4 2020. Of these companies, 84.2% reported earnings above analyst expectations and 12.5% reported earnings below analyst expectations. In a typical quarter (since 1994), 65% of companies beat estimates and 20% miss estimates. Over the past four quarters, 76% of companies beat the estimates and 20% missed estimates.
In aggregate, companies are reporting earnings that are 17.3% above estimates, which compares to a long-term (since 1994) average surprise factor of 3.6% and the average surprise factor over the prior four quarters of 12.4%.
Of these companies, 76.6% reported revenue above analyst expectations and 23.4% reported revenue below analyst expectations. In a typical quarter (since 2002), 61% of companies beat estimates and 39% miss estimates. Over the past four quarters, 67% of companies beat the estimates and 33% missed estimates.
In aggregate, companies are reporting revenue that are 3.2% above estimates, which compares to a long-term (since 2002) average surprise factor of 1.0% and the average surprise factor over the prior four quarters of 1.8%.
The estimated earnings growth rate for the S&P 500 for 20Q4 is -1.6%. If the energy sector is excluded, the growth rate improves to 2.2%.
The estimated revenue growth rate for the S&P 500 for 20Q4 is 0.2%. If the energy sector is excluded, the growth rate improves to 3.4%.
The estimated earnings growth rate for the S&P 500 for 21Q1 is 19.7%. If the energy sector is excluded, the growth rate improves to 21.2%.

Trailing EPS are now $139.85. Full year 2020: $138.71. 2021: $171.55. 2022: $198.52.
Analysts are still upbeat:


The Rule of 20 P/E is now 28.1 on trailing earnings but 22.9 on “normalized” earnings (see EXUBERANT NORMALITY).

RISK MANAGEMENT
Good piece by Steve Blumenthal that may surprise you:
(…) Here is different look tracking the bear and bull cycles of growth vs. value dating back to 1932:
Source: Ned Davis Research
A new year, a new race.
Oddsmakers currently favor the growth horse, but that old mare is getting tired. I’m suggesting it is time to jump on the value horse. Here’s why:
I write frequently that today’s environment feels all too familiar. In 1999, tech stocks were raging higher and higher. Value managers like Jeremy Grantham were losing clients left and right.
The tide turned the following decade. I believe we find ourselves in a similar position today. To get a feel for what that looked like, check out the following chart from my partner and seasoned high and growing dividends expert, Kevin Malone (pay particular attention to 2000, 2001, and 2002):
For information and illustration purposes only. Not a recommendation to buy or sell any security.
When you think about risk management, there is no harm in taking profits into account. Consider a switch from growth to value. Compare 2000 to 2002 while channeling your inner Buffett: “Rule number 2: Don’t forget rule number one. [Don’t lose money]” I call your attention to the value differences in 2009.
It won’t play out exactly as it did from 2000-2009, but my best guess is that we are looking at an extreme quite similar to the one we saw in 1999. No one knows when, but we can look at price-based indicators for guidance. The trend remains bullish and many stocks are participating to the upside (strong market breadth). Momentum measures, such as the Ned Davis Research CMG US Large Cap Long/Flat Index and NDR’s Big Mo remain bullish and, of course, the Fed and fiscal policy remains supportive. But euphoria abounds and it’s concerning.
I wrote a piece for Forbes this week titled, “GameStop Euphoria – What Is Happening and Why It Will End.” I’m not saying this is the final straw that stops the growth horse but the retail mob mania is real and it’s the type of thing you see at major stock market peaks. As Forrest Gump might say, “Crazy is as crazy does…” Or, “Stupid is as stupid does.”


Steve also shares this Ned Davis chart. High margin debt is never the cause for a market decline, only an accelerator if and when it begins. The current insanity in some equity corners could lead to more widespread selling by hurting funds which could trigger margin calls and yaddi, yaddi, yadda…

-
Melvin Capital Lost 53% This Year, Hurt by GameStop, Others Losses at the hedge fund extended beyond GameStop, but new and existing clients have signed up to invest into Melvin on Feb. 1.
- GameStop Day Traders Are Moving Into SPACs Day traders fueling enormous gains in popular stocks such as GameStop are also powering big swings for another suddenly hot investment: so-called blank-check companies.
- GameStop is just latest sorry case of misallocated capital Price-insensitive investors are driving an increasing disconnect within economies and markets
- Reddit Users Fuel Rally in Silver
Here’s the Reddit post by RocketBoomGo 3 days ago. Serious stuff!
SILVER BIGGEST SHORT SQUEEZE IN THE WORLD $SLV 25$ to 1000$
YOLO
Silver Bullion Market is one of the most manipulated on earth. Any short squeeze in silver paper shorts would be EPIC. We know billion banks are manipulating gold and silver to cover real inflation.
All of the best mines for silver have already been depleted in recent years. There is a severe supply shortage developing. At the same time, demand is skyrocketing. Solar panels, electric cars, electronics and many other products need more silver than ever.
Both the industrial case and monetary case, debt printing has never been more favorable for the No. 1 inflation hedge Silver.
Inflation adjusted Silver should be at $1,000 instead of 25$.
Why not squeeze $SLV to real physical price.
Think about the Gainz. If you don’t care about the gains, think about the banks like JP MORGAN you’d be destroying along the way.
Tldr- Corner the market. Gold Ventures thinks its possible to squeeze $SLV, FUCK AFTER SEEING $AG AND $GME EVEN I THINK WE CAN DO IT. BUY $SLV GO ALL IN TH GAINZ WILL BE UNLIMITED. DEMAND PHYSICAL IF YOU CAN. FUCK THE BANKS.
If the brokerages close trading on $SLV or various silver miners, we can continue to squeeze the market by purchasing physical silver at online or local silver/gold dealers. It all trickles into COMEX to squeeze supply.
Disclaimer: This is not Financial advice. I am not a financial services professional. This is my personal opinion and speculation as an uneducated and uninformed person.

Unlike RocketBoomGo, I am no silver expert (help me Terry) but here’s my 5-minute analysis: from the Silver Institute table below, I see reduced mine production in 2020, likely pandemic induced, and pretty uninspiring demand overall, except, perhaps, from photovoltaic applications (flat in the last 5 years mind you), partly offset by reduced photography demand. In total, market supply keeps exceeding market demand. Only ETPs (Exchange Traded Products) can upset the balance and boost prices, until recycling increases and market demand declines.
Bloomberg informs us that
it’s worth considering how much silver is already stored away under lock and key. Thanks to the rise of financial products tied to commodities over the past decade, this is now a huge pile of metal — some 2.46 billion ounces, of which about 96% is investment-linked product. Only about 7.2% of that mountain is needed each year to meet the demand that’s not being supplied by miners. As a result, there’s ample metal on hand in the world’s bank vaults that can be sold into any periodic price strength.


As Markets Soar, More Companies Turn to Shelf Registrations to Prepare Fundraising
As of Jan. 27 this year, 56 forms known as original shelf registrations—in which companies tell investors that they could issue stock at some point in the next few years, without committing to do so—had been filed with the Securities and Exchange Commission, up from 44 in the same period a year earlier, according to research firm Audit Analytics. That continued the trend of 2020, when companies submitted 844 original filings, up 37.2% from 2019. The figures for 2020 and the start of 2021 were both the highest in at least a decade. (…)
AMC on Wednesday said it sold out its most recent shelf offering of 50 million shares, shortly after the market frenzy began. (…)
FYI, 34 secondaries were announced last week for a total of 191 in the last 60 days. At some point, supply will exceed demand…
Speaking of supply, insiders keep on supplying the market per INK Research data:
Broad insider sentiment appears to be bottoming which is a pattern that is consistent with a market topping pattern. Our US Indicator is 25%, meaning there are four stocks with key insider selling for every one stock with buying. That is more-or-less flat from last week even as the S&P 500 rose by 1.3%.
The bad news for value investors continues at the sector level where we are downgrading both Energy and Basic Materials to Overvalued on the back of depressed insider sentiment. We are also downgrading Financials to Fair-valued. Of course, stocks in the sector could continue to get more expensive, but based on stalled insider sentiment, we suspect that the time is ripe for a broad pause in both the broad market and most sectors.

SPACK ATTACK


 Losses top $70-billion on short positions in U.S. firms: Ortex data


