The enemy of knowledge is not ignorance, it’s the illusion of knowledge (Stephen Hawking)

It ain’t what you don’t know that gets you into trouble. It’s what you know for sure that just ain’t so (Mark Twain)

Invest with smart knowledge and objective odds

THE DAILY EDGE: 7 JANUARY 2020

Happy and Healthy New Year

Recent posts:

Global economic growth accelerates at end of 2019

The rate of global economic expansion accelerated for the second successive month in December, hitting its highest level since April 2019. The uptick was underpinned by stronger inflows of new work, rising employment and improved business optimism. International trade remained a drag on growth, however, as new export orders contracted for the thirteenth successive month.

The J.P.Morgan Global Composite Output Index – which is produced by J.P.Morgan and IHS Markit in association with ISM and IFPSM – rose to an eight-month high of 51.7 in December, up from 51.4 in November. The headline index has posted above the neutral 50.0 mark that separates expansion from contraction in each of the past 87 months.

image

Output growth was recorded in both the manufacturing and service sectors during December. The rate of expansion in manufacturing production eased, as downturns in the intermediate and investment goods sub-industries offset solid growth at consumer goods producers. Business activity at service providers rose at the fastest pace in five months, with expansions seen across the business, consumer and financial services industries.

December saw economic activity increase in the US, China, the euro area, India, Brazil and Russia. Contractions were registered in the UK, Australia and Italy. Output in Japan also decreased slightly, according to Flash PMI data, to extend its downturn into a third successive month.

The level of incoming new business rose at the fastest pace in five months in December. Manufacturing new orders rose only marginally, whereas growth at service providers accelerated to its best since July 2019. (…)

Only a handful of countries are in good and improving manufacturing mode, however.
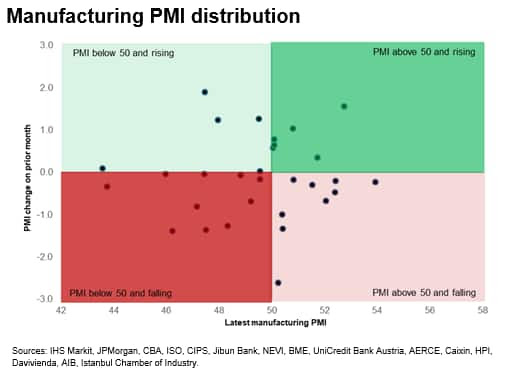
We all wish we had 2020 vision but one’s vision can be affected by one’s narrative. This is what investors need to understand early in 2020 as two critical data sets are floating around and are discriminately used by some pundits based on their own particular narrative.

U.S. PMI and earnings data vary significantly depending on which supplier/aggregator one chooses.

This chart from Axios (Dissecting the U.S. manufacturing divergence) shows the significant divergence between the ISM and Markit U.S. manufacturing PMIs. Bearish analysis will use the ISM which infers a deepening manufacturing recession while the more positive views will highlight the turnaround in IHS Markit’s PMI.

Data: IHS Markit, ISM; Chart: Andrew Witherspoon/Axios

Not insignificant if you also insert these charts in your bearish analysis:

 ISM Manufacturing Index vs. S&P 500 Index ISM Manufacturing Index vs. U.S. Core CPI

The gap between the two PMI surveys is now the largest ever recorded. Historical evidence demonstrates the superiority of Markit’s data as regression analysis

reveal that since 2008 the IHS Markit index has exhibited a closer fit with the official data than the ISM has, the respective adjusted r-square values being 0.79 and 0.69. The regressions also indicate that the IHS Markit production index is running at a level consistent with an average 0.3% quarterly rate of decline in the fourth quarter while the ISM index is consistent with a 1.7% rate of quarterly decline. By comparison, the official data from the Fed so far in the fourth quarter are running 0.4% behind the third quarter despite the November rebound, which is clearly far closer to the IHS Markit signals than the much-weaker ISM survey.

Markit adds:

To help explain why the surveys differ we need to look closer at the methodologies:

  • Survey panel sizes are different: IHS Markit’s survey panel is larger than the ISM’s stated panel size. IHS Markit surveys around 800 manufacturing companies (approximately double the size of the ISM panel size) from which an 80% response rate is typically received. However, unlike IHS Markit, ISM does not disclose actual numbers of questionnaires received. As a general rule, a large panel size produces more stable and accurate survey results, meaning the data tend to be less volatile and ‘noisy’.
  • The surveys also use different panel structures: ISM data are based only on ISM members, and as such are likely to reflect business conditions in larger companies, with small- and medium-sized firms under-represented. In contrast, IHS Markit’s survey includes an appropriate mix of companies of all sizes (based on official data showing the true composition of manufacturing output each year).
  • Survey responses may relate to different markets: The questionnaire that we have seen indicates that ISM does not specifically ask respondents to confine their reporting to US facilities/factories whereas IHS Markit specifies that all responses must relate only to business conditions at US factories. ISM data could therefore be more heavily influenced by global conditions facing of US-owned companies than the IHS Markit data. Note that global manufacturing growth outside of the US, as tracked by IHS Markit’s other PMI surveys, accelerated sharply in 2017, and has since matched the pattern of growth shown by the ISM. More recently, note that global-ex-US growth has slowed sharply to show some of the weakest rates seen over the past ten years.

That said, Boeing’s problems will likely impact a large swat of manufacturers in coming months:

Boeing Reassigns Staff as Spirit Eyes Furloughs Boeing will reassign as many as 3,000 workers that make the 737 MAX, and its biggest supplier is considering voluntary layoffs ahead of a planned production halt of the grounded jetliner.

(…) Boeing has said it will stop accepting MAX parts from suppliers later this month.

Farmers hoping for more “Trump money” in 2020

(…) Background: Farmers had a rough 2019, even with a hefty subsidy package provided to them by the Trump administration as relief from the trade war.

  • Chapter 12 bankruptcies rose 24% over the previous year, and farm debt is projected to hit a record high $416 billion.
  • Overall, farm income increased last year, but without the $14.5 billion tranche of farm subsidies delivered by the government, U.S. farm income would have fallen by about $5 billion from its already low 2018 level. (…)

What’s next: It’s unclear whether U.S. farmers will get more government aid in 2020, but experts say more farmers are becoming financially dependent on the subsidies, Beth Burger of the Columbus Dispatch wrote in November.

  • “‘Trump money’ is what we call it,” Missouri farmer Robert Henry told NPR of the package that totaled $28 billion over two years. “It helped a lot.”
  • “If the government doesn’t pay us, we’re done,” North Dakota farmer Justin Sherlock told Reuters last week.

The big picture: Many are unsure of what crops to plant because no specific details have yet been released on the deal, Reuters reported, noting that farmers in export-dependent regions say they can’t continue to sell their crops for below the cost of production without additional subsidies.

Between the lines: It’s hard to handicap the odds of a third round of farm subsidies because the Trump administration essentially pulled the money for the first two rounds “out of thin air,” NPR’s Dan Charles reported.

  • “[The USDA] decided that an old law authorizing a USDA program called the Commodity Credit Corp. already gave it the authority to spend this money.”

The bottom line: The world’s agriculture supply chains have already changed and American farmers aren’t entirely sure where they fit or what products China will be buying.

  • China has deepened ties with Brazil and Argentina, and its need for U.S. exports like soy and sorghum to feed livestock is waning because of a deadly pig disease experts estimate has killed about half the world’s largest hog herd.
Image result for vacancies sign

Note how the office vacancy rate never really improved this cycle (chart from CalculatedRisk).

Eurozone inflation jumps but don’t get excited just yet Despite a strong increase in inflation and retail sales in December, it’s premature for hawks to get excited. This is not an environment in which core inflation pressures are increasing

The inflation rate jumped on energy price effects. As the oil price jumped in December and base effects played a role, headline inflation increased from 1 to 1.3%. Depending on oil price developments- which are likely to be volatile as Middle East tensions have spiked recently- it is expected that inflation could trend somewhat higher than the 1% range for the coming months. The real story though is in core inflation, which has been at 1.3% for two months in a row now. This is higher than expected and could encourage hawks at the European Central Bank to seek some clawback of the monetary stimulus provided in the second half of last year.

November’s retail sales numbers may also give rise to some excitement, coming in higher-than-expected at 1% month-on-month growth. It’s important to remember, however, that the rise of Black Friday across the eurozone will play an important role here.

Predictions for a sustained rise in core inflation still seem premature, as wage pressures have been moderating recently thanks to the sluggish and uncertain economic environment. The same holds for selling price expectations which have been trending down, indicating that more modest price growth is in the making in the months ahead.

While the higher core inflation reading will be on the ECB’s radar, continued sluggish growth and subsiding wage pressures make a quick rise to the 1.5-2% range an upside risk scenario, rather than a base case. Without material improvement in business confidence and the growth outlook, continued modest price growth seems the most likely scenario for the moment.

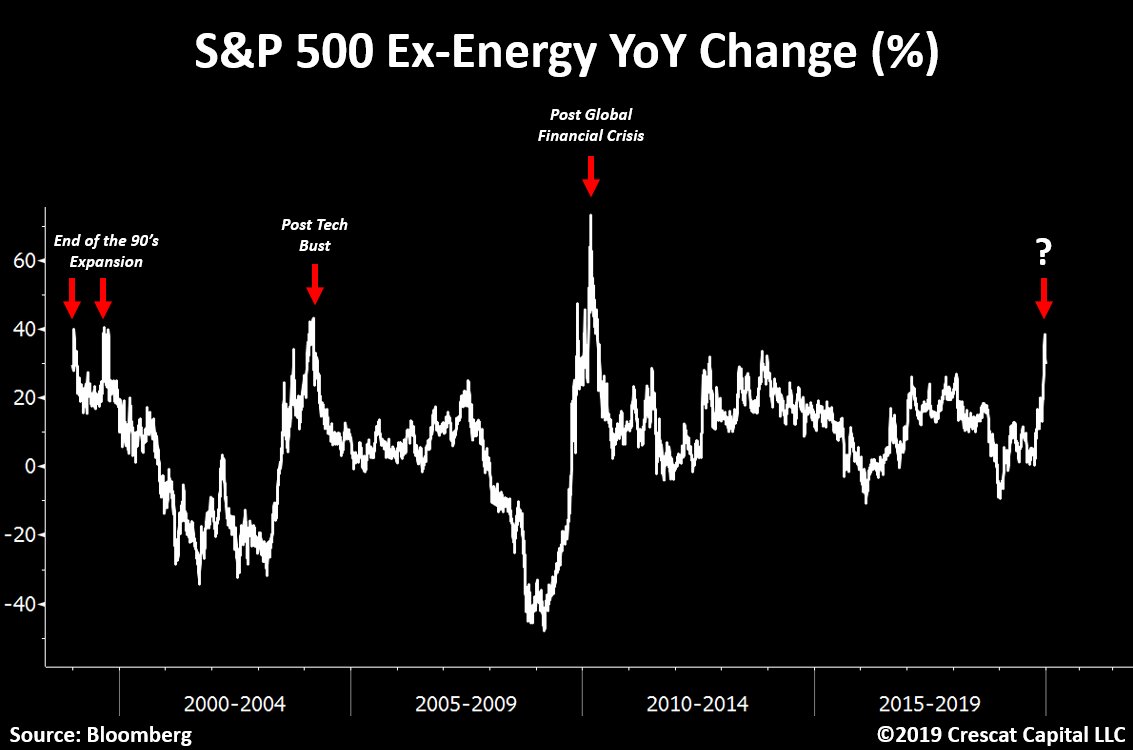
Narrative-fitted 2020 visions also impact earnings.

LARGER CUTS THAN AVERAGE TO S&P 500 EPS ESTIMATES FOR Q4

During the fourth quarter, analysts lowered earnings estimates for companies in the S&P 500 for the quarter. The Q4 bottom-up EPS estimate (which is an aggregation of the median EPS estimates for all the companies in the index) dropped by 4.7% (to $40.69 from $42.69) during this period.

During the past five years (20 quarters), the average decline in the bottom-up EPS estimate during a quarter has been 3.3%. During the past 10 years (40 quarters), the average decline in the bottom-up EPS estimate during a quarter has been 3.1%. During the past 15 years (60 quarters), the average decline in the bottom-up EPS estimate during a quarter has been 4.4%. Thus, the decline in the bottom-up EPS estimate recorded during the fourth quarter was larger than the five-year average, the 10-year average, and the 15-year average.

S&P 500 Change in Bottom Up EPS

As of today, the S&P 500 is expected to report a decline in earnings of -1.5% for the fourth quarter. Based on the average change in earnings growth due to companies reporting positive earnings surprises, it is likely the index will report earnings growth for Q4.

Over the past five years on average, actual earnings reported by S&P 500 companies have exceeded estimated earnings by 4.9%. During this same period, 72% of companies in the S&P 500 have reported actual EPS above the mean EPS estimate on average. As a result, from the end of the quarter through the end of the earnings season, the earnings growth rate has typically increased by 3.6 percentage points on average (over the past five years) due to the number and magnitude of positive earnings surprises.

If this average increase is applied to the estimated earnings decline at the end of Q4 (December 31) of -1.5%, the actual earnings growth rate for the quarter would be 2.1% (-1.5% + 3.6% = 2.1%).

If the index does report growth of 2.1% for Q4 2019, it will mark the first time the index has reported (year-over-year) earnings growth since Q4 2018.

S&P 500 Earnings Growth Est vs Actual

Bearish analysts tend to currently use Factset’s data to support the notion of a profit recession, now in its 4th quarter based on Factset’s numbers.

For its part, Capital IQ shows Q3’19 as the only negative quarter. And, should you be a purist using only “as reported” earnings, Q3’19 was also the only negative quarter and Q4 EPS will jump 26% YoY!

image

Refinitiv/IBES, which I prefer and use for its consistent common sense approach to P&L analysis, kept EPS growth positive in Q1 and Q2 of 2019.

image

Interesting chart:

Image

https://twitter.com/TaviCosta

Tense Time for Buyers of Riskier Corporate Loans The lower reaches of the market for corporate loans have suffered sharp declines in recent months, a sign of growing aversion to earnings shortfalls or other strains at indebted companies including Murray Energy.

(…) In the U.S. at the start of December, some 2.5% of leveraged loans were trading at less than 70% of face value, the most since September 2016, according to S&P Global Market Intelligence’s LCD, the loan market research service.

Analysts and investors blame the loose credit standards that characterized the market in recent years, encouraged by strong demand from yield-hungry investors. The hunt for yield also fed a boom in new issuance of structured loan funds known as collateralized loan obligations, or CLOs, which have been the biggest group of lenders in recent years.

But investors are shying away from such loans at any sign of trouble, including those deemed “covenant lite” for their scant investor protections, which is sparking steep falls in the prices of loans to firms—particularly when they fail to hit earnings targets. (…)

Another factor driving the selloff: many borrowers have been understating their leverage, or the amount of debt they have relative to earnings. They have done so by regularly inflating earnings before interest, taxes, depreciation and amortization, or Ebitda, by including forecasts for cost cuts or additional sales, according to investors, analysts and ratings firms. (…)

According to UBS data, average total debt on new deals is about 5.4 times Ebitda as presented by borrowers, but 6.7 times Ebitda once the add-backs are stripped out. “About 25% to 30% of outstanding leveraged loans are associated with deals done since 2017 that have add-backs worth about 25% of Ebitda,” Mr. Mish says.

Pointing up S&P recently reviewed U.S. leveraged loans it rated in 2015 and 2016 to determine whether companies had fulfilled their projected earnings add-backs—and if leverage levels had fallen as expected. The finding was resoundingly negative.

Of new borrowers in 2016, more than 90% failed to hit earnings targets by the end of the second year of operation after they took out the loan. That meant debt remained a much higher multiple of earnings. Leverage at the median company was projected to fall to 3.1 times Ebitda by the end of the second year in S&P’s models based on management forecasts. In fact, it ended up at 5.9 times, the S&P study found. (…)

In a covenant-lite world, the natural reaction to any sign of stress is to sell out.

Huawei Gear ‘Top Notch,’ Says New CEO of Canadian Telco BCE

(…) Bibic’s comments come as the Canadian government faces a decision over whether to allow Huawei to play a bigger role in developing the 5G broadband network amid security concerns and as tensions between Canada and China remain stretched over the arrest of Huawei CFO Meng Wanzhou. (…)

THE DAILY EDGE: 6 JANUARY 2020

Happy and Healthy New Year

Did you miss THE RULE OF 20 STRATEGY GOES ALL CASH?

Also posted today: BOTTOM FISHING IN THE OIL POOL? THINK AGAIN!

COMPOSITE PMIs
USA: Business activity growth accelerates to five-month high in December

U.S. service sector firms indicated a moderate expansion in business activity at the end of 2019, with growth driven by a stronger rise in new orders. Foreign client demand also picked up, as new export orders increased for the first time since July. Subsequently, the rate of job creation ticked up to a five-month high despite only fractional pressure on capacity. Business confidence, however, remained well below the series average.

Meanwhile, service providers were able to increase their selling prices at a faster pace amid a quicker, albeit only modest, rise in cost burdens.

The seasonally adjusted final IHS Markit US Services Business Activity Index registered 52.8 in December, up from 51.6 in November, signalling a further rebound in output growth following a slump in activity during the summer. The moderate upturn accelerated to the fastest since July and was linked to more favourable demand conditions.

image

A second successive increase in new business drove the expansion in output, with stronger client demand leading to the fastest rise in new orders for five months. Although growth was relatively lacklustre overall, it signalled a turnaround from the slight contraction seen in October. Foreign client demand also improved, with service providers recording the first upturn in new business from abroad since July. The rate of expansion was fractional overall but was only slightly slower than the series trend.

As a result, service providers ramped up hiring efforts as employment rose for the second straight month and at the quickest rate since July. Although only modest overall, the upturn in workforce numbers was commonly linked to greater business requirements following an uptick in new order growth.

Meanwhile, backlogs of work were broadly unchanged at the end of 2019, as firms signalled little strain on capacity. Although some noted that greater new business inflows had put pressure on operations, others stated that orders and projects were completed in a timely manner.

On the price front, cost burdens increased for the third month running and at a quicker rate. The rise in input prices was generally attributed to higher supplier and wage costs. The increase was the sharpest since July despite being only modest.

At the same time, service sector firms were able to increase their selling prices at a solid pace. The rate of output charge inflation outpaced the rise in input prices and was the fastest since February. Greater output prices were largely linked to efforts to pass higher costs on to clients.

Finally, business expectations for the year ahead improved in December. Where firms foresee an increase in activity over the next 12 months, they attributed this to hopes of further boosts to new sales. That said, the degree of confidence was well below the series trend and levels seen at the end of 2018, with a number of firms reporting uncertainty as to the stability of client demand.

The IHS Markit Composite PMI Output Index* registered 52.7 in December, up from 52.0 in November, to signal a moderate expansion in private sector business activity. The upturn was the fastest since April.

image

Private sector new business grew at the strongest rate since July, with service providers recording a second successive and sharper rise in client demand. Similarly, firms indicated back-to-back expansions in new export orders, albeit both at fractional rates overall.

Employment also continued to rebound from the contractions seen in September and October, with both sectors registering a rise in staffing levels.

Meanwhile, rates of input and output price inflation quickened as private sector firms sought to pass higher costs on to clients and protect margins.

Finally, output expectations remained historically subdued as firms remained uncertain regarding future client demand.

Chris Williamson, Chief Business Economist at IHS Markit:

(…) the overall survey results are indicative of GDP rising at a relatively modest annual rate of 1.8% in December. The missing ingredient compared to this time last year is optimism about the future, with business sentiment regarding prospects for the next twelve months running well below levels seen this time last year, and close to the lowest for at least seven years. Indeed, much of the recent improvement in demand has come from stronger sales to consumers, with business spending and investment remaining under pressure amid this anxiety about the economic and political outlook.

Chinese business activity growth softens at end of 2019

The Caixin China Composite PMIâ„¢ data (which covers both manufacturing and services) pointed to another strong rise in total Chinese business activity in December. However, the rate of growth eased since November, with the Composite Output Index falling from a 21-month high of 53.2 to 52.6 at the end of the year.

image

Underlying data showed that business activity continued to expand across both the manufacturing and service sectors, with the former noting the steeper rate of growth. Manufacturing output rose solidly overall, despite the rate of increase easing to a three-month low. In the service sector, business activity expanded strongly overall, though growth also eased from November. This was signalled by the seasonally adjusted Chinese Services Business Activity Index posting 52.5 in December, down from a seven-month high of 53.5 in November.

The total amount of new business received by Chinese companies rose solidly at the end of the year, despite the rate of expansion slipping to a four-month low. This reflected a softer rise in new work placed at goods producers, which registered a modest increase overall. In contrast, services companies recorded a solid increase in sales that was the quickest since September. Anecdotal evidence attributed the upturn in new orders to greater client numbers, new product offerings and improved marketing strategies.

New export order growth weakened in December, with both monitored sectors registering only a marginal rise in new orders from overseas. In the service sector, the slight increase contrasted with a solid expansion during the previous month. Consequently, new export business at the composite level grew at the slowest rate for three months.

Overall, employment across the manufacturing and service sectors in China rose only slightly at the end of the fourth quarter. The upturn was driven by job creation at service providers, as manufacturing firms saw no change to their staffing levels. That said, the rate of payroll growth at services companies was only marginal, with a number of companies adopting relatively cautious approaches to hiring amid efforts to contain costs and boost efficiency.

After a slight fall in November, service providers recorded higher backlogs of work at the end of 2019. Panel members often mentioned that greater volumes of new work had imparted pressure on capacities. That said, the rate of accumulation was only marginal. In the manufacturing sector, outstanding business rose at a modest pace that was the softest for four months. At the composite level, unfinished workloads rose at a slightly quicker, albeit only mild, rate.

December data pointed to a further easing in the rate of input price inflation across China. Notably, services firms recorded the slowest increase in operating expenses since March. Although input costs rose at a slightly faster rate in the manufacturing sector, the rate of inflation remained marginal and much weaker than the historical trend. As a result, cost burdens at the composite level increased at the weakest rate for four months.

Sector data highlighted contrasting trends when it came to selling prices, with an increase in factory gate prices occurring alongside a fall in service sector charges. Though modest, the increase in the manufacturing sector was the most marked seen since October 2018. Output charges set by services companies meanwhile fell for the first time since September 2018, albeit only slightly. Selling prices at the composite level therefore rose at only a fractional pace.

Manufacturing firms based in China were generally optimistic towards the one-year business outlook in December. The overall degree of positive sentiment in the goods producing sector was up from October’s recent low, but still weak in the context of historical data. Meanwhile, the level of optimism expressed by service sector firms edged down to the second-lowest on record. Companies highlighted ongoing trade tensions, relatively subdued economic growth and staff shortages as factors that could dampen prospects over 2020.

Eurozone economy remains close to stagnation at end of 2019

The IHS Markit Eurozone PMI® Composite Output Index improved slightly during December, but still signalled weak economic growth. After accounting for seasonal factors, the index recorded 50.9, up from 50.6 in November and slightly better than the earlier flash reading. Despite the improvement to a four-month high the index nonetheless continued to post at a level amongst the lowest seen since the first half of 2013.

image

The divergence between the performances of the manufacturing and services economies remained noticeable in December. Overall growth remained centred on the service sector, with growth here reaching a four-month high. In contrast, manufacturing output declined at a rate not exceeded for nearly seven years.

imageAt the national level, Ireland moved to the top of the country rankings during December, expanding at the fastest rate for six months. Spain also registered a solid rate of expansion, as did France despite recording its slowest growth in three months.

There was some positive news in Germany, where there was a return to marginal growth following three months of contraction. In contrast, Italy remained inside negative territory for a second month, registering its worst performance in just under a year.

Supporting the upturn in overall activity was an increase of incoming new work for the first time in four months. Growth was, however, only marginal, and again undermined by weakness in foreign demand. Latest data showed exports falling for a fifteenth successive month, albeit to the weakest degree since the start of 2019.

With activity rising at a slightly faster pace than new business, companies were again able to reduce overall workloads at their units. Latest data showed that levels of work outstanding were cut for a tenth successive month during December, although the rate of contraction was marginal and the weakest since June.

Spare capacity, combined with soft new business growth, continued to weigh on hiring during December. Although payroll numbers increased again, they did so only marginally and to the weakest degree for five years.

Nonetheless, higher labour costs remained a key factor behind increased operating expenses at the end of 2019. December’s PMI data indicated another solid rise in input costs, with inflation little- changed since November. Output charges were also raised, although only modestly as competitive pressures and weak demand conditions limited pricing power.

Finally, confidence about the future improved during December to its highest level since May, though remained well below par. The improvement was broad-based, with the exception of France. Germany in particular saw a strong rise in confidence since November, although sentiment remained weaker than in Italy, Spain and Ireland.

The IHS Markit Eurozone PMI® Services Business Activity Index improved in December to a four-month high of 52.8, up from 51.9 in November. All nations covered by the survey recorded growth in activity, led by Spain and Ireland.

A similar-sized increase in new work was recorded in December, although growth was again dampened by a reduction in new export business, the sixteenth in as many months.

Capacity came under pressure, as signalled by a first increase in outstanding business for five months. Modest backlog growth subsequently encouraged firms to take on additional staff, albeit at the slowest rate since the start of 2019.

Rising staffing costs were again a key driver of input price inflation, which was little-changed at a marked level in December. Margins remained under pressure as output charges increased only modestly since the previous month.

Looking ahead to the coming 12 months, business confidence about the future strengthened to its highest level since July. The upturn was led by a strong improvement in sentiment amongst German service providers.

Chris Williamson, Chief Business Economist at IHS Markit:

Another month of subdued business activity in December rounded off the eurozone’s worst quarter since 2013. The PMI data suggest the euro area will struggle to have grown by more than 0.1% in the closing three months of 2019. (…)

image

U.S. Light Vehicle Sales Slip in December and for all of 2019

The Autodata Corporation reported that December sales of light vehicles fell 1.9% from November (-3.3% y/y) to 16.87 million units (SAAR). Earlier figures were revised. For the full year 2019 sales of 17.00 million units compared to 17.27 million during all of 2018 and have been fairly flat for the last five years. During the last three months, sales averaged 16.90 million units, the weakest three-month reading since April.

Sales of light trucks declined 3.8% (-0.7% y/y) to 12.14 million units, the lowest level since April. (…) Auto sales rose 3.3% (-9.4% y/y) to 4.73 million, the highest level since July. (..)

Imports’ share of the U.S. vehicle market fell to 22.1%. Imports’ share of the passenger car market fell sharply to 24.5%. Imports share of the light truck market held steady at 21.1% and remained up from the 12.0% low in January 2015.

image

image

U.S. Construction Spending Stronger than Expected in November

The value of construction put-in-place rose a larger-than-expected 0.6% m/m (+4.1% y/y) in November with significant upward revisions to both October and September. The Action Economics Forecast Survey had looked for a 0.3% m/m rise. As for revisions, the 0.8% m/m decline initially reported for October was revised to a 0.1% m/m gain while the 0.3% m/m decrease previously reported for September was revised up to a 0.7% m/m increase. The revisions were concentrated in private, residential construction.

Private construction rose 0.4% m/m (+1.6% y/y) in November with significant upward revisions to October and September. The initially reported 1.0% m/m decline for October was revised to a 0.1% m/m increase, and the 1.1% decrease previously reported for September was revised to a 0.3% m/m rise. Private residential construction surged 1.9% m/m (2.7% y/y) in November, led by a 3.4% m/m jump in home improvements, but also a 1.2% m/m gain in single family new house building. Multi-family construction was essentially unchanged in November after having fallen in each of the previous three months.

In contrast to residential construction, private nonresidential construction remained weak in November, declining 1.2% m/m (+0.2% y/y), its sixth monthly decline in the past eight months. Leading the weakness in November were lodging (-3.8% m/m), education (-2.0% m/m), power (-1.6% m/m) and manufacturing (-2.4% m/m).

Public construction increased 0.9% m/m (+12.4% y/y) in November with only modest upward revisions to October and September. Construction of highways and streets, the largest category accounting for nearly one-third of public sector building activity, rebounded in November, rising 2.2% m/m after having fallen 3.0% m/m in October. Education construction, the second largest category, was essentially unchanged in November from October following a 2.8% m/m gain.

image

Manhattan property decline worsened as Wall Street boomed Average sale prices for co-ops and condos dropped 7.5% in the fourth quarter
Fed Officials Say Global Economic Shift Is Keeping Rates Low San Francisco Fed President Mary Daly and Dallas Fed President Robert Kaplan said population aging, tech advances and lower productivity have changed how the economy behaves

Speaking on a panel at a conference in San Diego, San Francisco Fed President Mary Daly and Dallas Fed President Robert Kaplan said the aging of the population, technological advances and lower worker productivity have changed how the economy behaves.

“There have been substantial structural changes in the U.S. economy since the 80s and 90s and even since the early 2000s,” Mr. Kaplan said. “We talk a little bit too much about cyclical phenomena and maybe not enough about the structural changes.”

The response to these structural changes can’t come from the Fed, he added.

“We need structural reforms away from monetary policy if we’re going to improve the level of potential growth,” he said.

Ms. Daly said this “new world” make it possible to push the unemployment rate lower and draw more people into the labor force. On the other hand, she said, low inflation and low interest rates could make it difficult for the Fed to fight a downturn using its conventional tools of lowering policy rates.

“We don’t have to worry about inflation taking off so we have a little more room to find full employment,” she said. “On the flip side of that, we are going to be fighting inflation from below.” (…)

Ms. Daly said one solution would be to allow inflation to push above 2% following downturns to make up for previous weakness in inflation.

In the long term, the U.S. will need help from fiscal policy makers to push up its potential for strong economic growth, the two officials said. (…)

EARNINGS WATCH

The Q4’19 earnings season is underway with 16 early reporters boasting an 88% beat rate and a +4.1% surprise factor. Sadly, the good news stops here.

These 16 companies had an actual earnings drop of 18.8% on a +2.3% revenue growth rate. At the beginning of Q3’19, these same companies reported a 19.2% earnings decline on a 0.6% revenue gain. During Q4’18, these same companies had a tax rate-boosted 18.7% earnings gain on a 9.2% revenue jump.

In effect, Q4’19 earnings for these companies are 4.1% below their Q4’17 level even though revenues are up 11.6%. Of the 16 companies having reported, 9 are consumer-centric, 2 Industrials and 5 IT.

Total S&P 500 earnings are seen declining 0.3% in Q4 (Refinitiv/IBES), helped by a 2.2% buyback effect (+2.0% in Q3).

TECHNICALS WATCH

The 13/34–Week EMA Trend Chart from CMG Wealth remains bullish. Other CMG Wealth technical charts are also positive with the notable exceptions of NDR’s Crowd and Trading Sentiment charts which are both negative.

This one from Ed Yardeni calls for ST caution:

image

Iran and the United States: What Comes Next (By: George Friedman)

(…) All of this has to be framed in the strategic context. The U.S. does not want to engage in extensive operations in the region. Washington is depending on sanctions and proxies. Iran still wants to maintain its sphere of influence into the Mediterranean, but above all, an even greater priority is the neutralization of Iraq and the stabilization of its own country. Iran can’t afford to allow Iraq to become a bastion of anti-Iran forces, nor can it wage a conventional war against the U.S., Israel, Saudi Arabia and the UAE. Iran must therefore use what it has used so effectively in the past: special and covert operations. It follows that Iran will take its time to respond. It also follows that the U.S. and its allies, having bought time by killing the head of the Quds Force, must use the time effectively.

Trump administration pressed Dutch hard to cancel China chip-equipment sale: sources

The Trump administration mounted an extensive campaign to block the sale of Dutch chip manufacturing technology to China, with Secretary of State Mike Pompeo lobbying the Netherlands government and White House officials sharing a classified intelligence report with the country’s Prime Minister, people familiar with the effort told Reuters. (…)

The U.S. campaign began in 2018, after the Dutch government gave semiconductor equipment company ASML, the global leader in a critical chip-making process known as lithography, a license to sell its most advanced machine to a Chinese customer, two sources familiar with the matter told Reuters.

Over the following months, U.S officials examined whether they could block the sale outright and held at least four rounds of talks with Dutch officials, three sources told Reuters. (…)

The pressure appears to have worked. Shortly after the White House visit, the Dutch government decided not to renew ASML’s export license, and the $150 million machine has not been shipped. (…)

ASML has never publicly disclosed the identity of the Chinese customer, but Nikkei and others have reported that it is Semiconductor Manufacturing International Corp (SMIC), China’s biggest chip-making specialist. (…)