 Travelling day. Actually, they will all be travelling days for a few weeks. Will post when possible.
U.S. Hiring Steady as Jobless Rate Falls to Half-Century Low U.S. employers added 136,000 jobs last month, and the unemployment rate fell to 3.5%, signaling the labor market continues to provide opportunities for work despite a broader economic slowdown.
We very well know the recession-like conditions in the goods-producing sector. Markit’s latest Services PMI (see below) gave a first serious warning that services are getting impacted. Here’s the warning:
In line with softer demand conditions, service sector firms signalled the first contraction in employment since February 2010. Furthermore, the drop in workforce numbers was the sharpest since the end of 2009. A number of companies reported difficulties finding suitable candidates for unfilled vacancies, but in other firms the drop in headcounts reflected cost cutting amid signs of excess capacity. Service providers reported the sharpest fall in the level of outstanding business since April 2014.
Softer demand, excess capacity, cost cutting to try to protect margins. If these conditions continue in Q4, the economy will dip more seriously. The chart below plots quarterly monthly changes in services employment through Q3. Somewhat softer in the last 2 quarters but nothing terrifying. The next chart shows monthly numbers with a dip in September but still not terrifying. Markit’s “drop in workforce numbers” has not shown in the BEA numbers just yet.


That said, let’s not forget that the BEA uses the “birth-death” model to estimate the effect of new biz on employment and this added 63,000 jobs in September, 40% of the 136k reported…
Aggregate weekly payrolls growth slowed to +4.2% YoY in September and has been rising at a 4.0% annualized rate during Q3 in spite of very spotty monthly trends. With inflation remaining subdued below 2.0% and oil prices having retreated back to $52 on the WTI, consumers are not squeezed even though employment growth has slowed from +1.9% YoY in January to +1.4% last month.


The unemployment rate hit 3.5% in December 1969. A recession officially began in January 1970, FYI. Coincident indicator.
This chart from Rothschild & Co Asset Management Europe (via Isabelnet) shows that the NFIB survey leads U.S. employment by 6 months.

September data indicated only a slight increase in business activity across the U.S. service sector, with the expansion constrained by the slowest monthly rise in new business recorded since data collection began in October 2009. Subsequently, firms reduced their workforce numbers for the first time since early-2010. Business confidence also remained subdued amid ongoing economic uncertainty. On the price front, input costs fell for only the second time in the series history. Firms also cut their selling prices in an effort to remain competitive.
The seasonally adjusted final IHS Markit U.S. Services Business Activity Index registered 50.9 in September, in line with the earlier ‘flash’ figure and up slightly from 50.7 in August, but nonetheless signalled one of the slowest increases in output for over three years. Many firms noted that less robust client demand held back the expansion. Moreover, the third quarterly average for 2019 signalled the weakest business activity performance across the sector since the same period three years ago.

Concurrently, new business growth slipped further to the slowest in the near-decade long series history in September. The marginal expansion was reportedly stymied by tough competition and soft demand conditions. Ongoing economic uncertainty also reduced client demand, notably in foreign markets, with new export orders falling for the second month running. The decrease in new business from abroad the fastest since the series began in 2014.
In line with softer demand conditions, service sector firms signalled the first contraction in employment since February 2010. Furthermore, the drop in workforce numbers was the sharpest since the end of 2009. A number of companies reported difficulties finding suitable candidates for unfilled vacancies, but in other firms the drop in headcounts reflected cost cutting amid signs of excess capacity. Service providers reported the sharpest fall in the level of outstanding business since April 2014.
Meanwhile, cost burdens faced by service providers declined for only the second time in the decade long series history. Input prices fell at the sharpest pace since data collection began. Firms linked reductions to lower purchase prices and reduced borrowing costs following the recent interest rate cut.
As a result, service providers continued to offer discounts and reduce their output charges in September. Firms also stated that softer client demand and efforts to stay competitive were factors behind the drop in output prices.
Expectations towards output over the year ahead remained muted at the end of the third quarter. Although the degree of confidence picked up slightly since August, it was the second-weakest in the series history. Many firms highlighted concerns surrounding ongoing business uncertainty and gloomier global economic growth projections.
The Composite PMI Output Index registered 51.0 in September, in line with the earlier ‘flash’ figure and up from 50.7 in August and indicated only a slight expansion in output across the private sector. The upturn was among the weakest for over three years as only marginal growth in the service sector weighed on the overall increase.

Meanwhile, new business rose at the slowest pace since data collection began ten years ago. Although new order growth quickened in the manufacturing sector, as service providers signalled only a marginal expansion. Challenging external demand conditions led to a further decline in new export orders, the second-fastest in the series history (since September 2014).
Weak demand conditions led to a reduction in employment, with the slight increase across the manufacturing sector offset by a marginal contraction among service providers.
On the price front, input prices continued to decline with reductions made to a greater extent across the service sector. In contrast, manufacturers registered a quicker increase in cost burdens. Subsequently, output charges were broadly unchanged in September, as service providers cut their selling prices fractionally.
Business confidence remained subdued across the private sector, which survey respondents linked to ongoing economic uncertainty.
Chris Williamson, Chief Business Economist at IHS Markit:
A disappointing service sector PMI follows news of lacklustre manufacturing and means the past two months have seen one of the weakest back-to-back expansions of business activity since 2009, sending a signal of slower GDP growth in the third quarter. The surveys are consistent with the economy growing at a 1.5% annualised rate in the third quarter, with forward-looking indicators suggesting further momentum could be lost in the fourth quarter. In particular, inflows of new business have almost stalled, with September seeing the smallest increase since 2009, and business expectations about the year ahead remain stuck at one of the gloomiest levels since at least 2012.
In this environment, companies are taking an increasingly cost-conscious approach to payrolls, with September consequently seeing surveyed firms report a net drop in headcounts for the first time since 2010. This translates into non-farm payroll growth trending below 100,000.
Price pressures have also abated in line with the weak demand picture, suggesting official inflation gauges could likewise moderate in coming months.
The NMI® registered 52.6 percent, which is 3.8 percentage points below the August reading of 56.4 percent. This represents continued growth in the non-manufacturing sector, at a slower rate. The Non-Manufacturing Business Activity Index decreased to 55.2 percent, 6.3 percentage points lower than the August reading of 61.5 percent, reflecting growth for the 122nd consecutive month. The New Orders Index registered 53.7 percent; 6.6 percentage points lower than the reading of 60.3 percent in August. The Employment Index decreased 2.7 percentage points in September to 50.4 percent from the August reading of 53.1 percent. The Prices Index increased 1.8 percentage points from the August reading of 58.2 percent to 60 percent, indicating that prices increased in September for the 28th consecutive month. According to the NMI®, 13 non-manufacturing industries reported growth. The non-manufacturing sector pulled back after reflecting strong growth in August. The respondents are mostly concerned about tariffs, labor resources and the direction of the economy.
Services PMIs held up pretty well while global manufacturing was sinking during 2018 but services are now weakening in trend, globally.

At 51.2 in September, the JPMorgan Global PMI™ (compiled by IHS Markit) fell to a level matching the three-year lows seen back in May and June. The index, which measures changes in total output across both manufacturing and service, provides an accurate advance guide to worldwide GDP growth and hints that the annual pace of global economic growth (at market prices) has slowed to just below 2% in recent months, down markedly from 3% at the end of 2017.
The slowdown reflected a further deterioration of inflows of new business in September, which showed the smallest monthly rise since November 2012, underscoring how growth of global demand for goods and services has cooled markedly in recent months.
With backlogs of work now falling at the sharpest pace since July 2013, hinting at excess capacity, companies have also pared back their hiring. Global jobs growth all but stalled in September, the smallest of possible gains representing the smallest rise since February 2010. The weakening jobs growth, from robust gains seen earlier in the year, has been a key transmission mechanism by which the trade-led manufacturing slowdown has spread to the service sector, which is typically more dependent on domestic demand and household spending. (…)
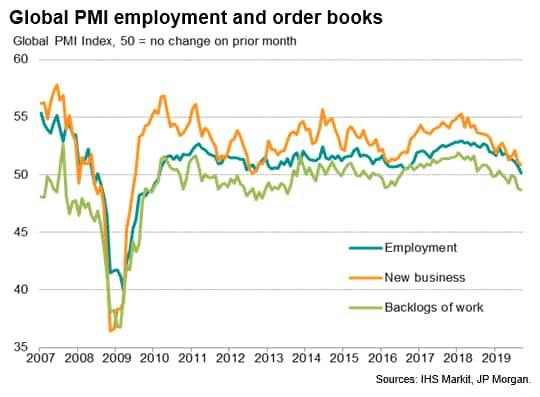
The disappointing readings on the current output and order book situations were matched by gloomy sentiment among both manufacturing and service sector companies about prospects in the year ahead. Expectations of output were collectively the second lowest on record (data were first available in 2012), with only August having witnessed gloomier sentiment, suggesting weakness has further to run.
Looking at the reasons given by companies for negative survey responses (either in terms of falling output, orders or exports, or for gloomier sentiment about the year ahead), recent months have seen record levels of both ‘trade’ and ‘uncertainty’ being cited by PMI respondents.
Concerns over weaker growth and ‘recession’ have also risen sharply, albeit with some easing seen in September, often linked in part to hopes that recent policy stimulus from central banks will help avert further weakness.

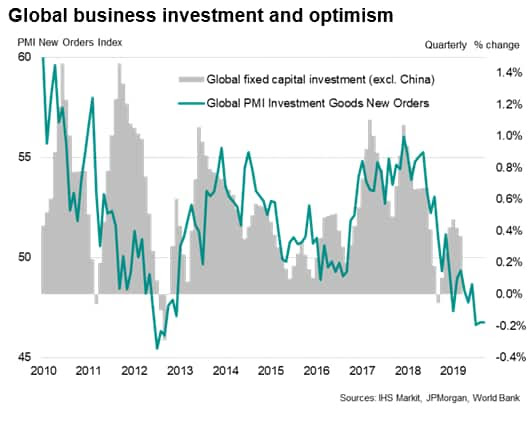
In addition to firms reining-in their hiring, the global PMI data also showed signs of business investment falling sharply. A key PMI gauge of new orders for investment goods has been running at its lowest since 2012 throughout the third quarter. This index correlates well with official business investment spending data, providing an advance guide to global capex trends. The current picture of falling investment is a far cry from the surge in spending seen at its peak early last year.
The investment goods downturn highlights how the global slowdown and darkened outlook has hit capital spending by companies, which could in turn dampen future growth and productivity. (…)
 Coincidentally, SentimenTrader posted this chart last Friday:

Business surveys sent conflicting signals on the health of the US manufacturing sector in September. But dig deeper and the survey divergences can be explained. Our analysis highlights how the IHS Markit PMI has outperformed the ISM survey in providing more accurate indications of actual manufacturing trends in recent years, most likely due to differences in panel structure and questionnaire design.
The IHS Markit Manufacturing PMI™ hit a five-month high in September while the ISM survey’s PMI sank to its lowest level since 2009. Moreover, at 51.1. the former indicated a modest improvement in business conditions while the latter, at 47.8, indicated a deterioration.
Both surveys use diffusion indices whereby 50 denotes no change on the previous month. Both headline PMIs are also composite indicators derived from five individual survey questions relating to output, new orders, employment, inventories and suppliers’ delivery times. Note however that ISM uses a straight average of its five components whereas IHS Markit uses a system such that forward-looking components carry a higher weight. These weights can therefore lead to divergences between the two PMIs. However, even recalculated using the ISM weighting system, the IHS Markit PMI for September comes in at 50.6. The cause of the divergence must therefore lie elsewhere.
We therefore need to dig deeper into the survey sub-indices rather than analysing the headline PMI numbers. (…) In particular, the ISM indices ran considerably higher than the IHS Markit indices through 2017 and 2018, and have also tended to show greater volatility over the past 12 years for which data are available for both surveys.
Using some simple statistical analysis, it is evident that the IHS Markit indices have a stronger relationship with official output, factory orders and employment data than the equivalent ISM indices. The IHS Markit data show consistently higher correlation coefficients and adjusted r-squares than the ISM data when compared with a rolling three-month rate of change in comparable official data, which is the most widely used metric for comparing survey data with government statistics (see table 1).

Implied growth rates for manufacturing output, derived from the regressions and shown in chart 4, confirm the extent to which exaggerated growth signals were sent from the ISM surveys over 2017 and 2018. More recently, in 2019 both surveys have signalled falling manufacturing output trends. Note that, although running higher than the ISM data in September, the IHS Markit data are still indicating falling manufacturing output on a three-month-rolling basis, and the ‘flash’ IHS Markit PMI’s output index even fell to its lowest since 2009 back in July, though the rate of contraction has eased slightly. Both surveys are therefore consistent in indicating that the manufacturing recession was most likely extended into the third quarter, but the September divergence remains a concern.

Some clues as to why the ISM and IHS Markit surveys have diverged can be found through a closer inspection of the survey methodologies:
Survey panel sizes are different: IHS Markit’s survey panel is larger than the ISM’s stated panel size. IHS Markit surveys just under 800 manufacturing companies (approximately double the size of the ISM panel size) from which an 80% response rate is typically received. However, unlike IHS Markit, ISM does not disclose actual numbers of questionnaires received. As a general rule, a large panel size produces more stable and accurate survey results, meaning the data tend to be loss volatile and ‘noisy’.
The surveys use different panel structures: ISM data are based only on ISM members, and as such are likely to only reflect business conditions in larger companies, with small- and medium-sized firms under-represented. In contrast, IHS Markit’s survey includes an appropriate mix of companies of all sizes (based on official data showing the true composition of manufacturing output).
Survey responses may relate to different markets: ISM also does not ask respondents to confine their reporting to US facilities/factories whereas IHS Markit specifies that all responses must relate only to metrics from US factories. ISM data could therefore be more heavily influenced by conditions of US-owned factories in China, for example, than the IHS Markit data.
Pull all of the above factors together and it becomes clearer as to why the ISM data may have exaggerated US manufacturing in 2017 and 2018, and why it is now possibly overstating the weakness. As chart 5 shows, global manufacturing growth outside of the US (as tracked by IHS Markit’s other PMI surveys) accelerated sharply in 2017, and has since matched the pattern of growth shown by the ISM. More recently, note that global-ex-US growth has slowed sharply to some of the weakest rates seen over the past ten years (albeit not as steep as 2012).
As the ISM data is seemingly more reflective of the performance of multinationals than the IHS Markit survey, we argue that it is sending misleading signals regarding the health of the US economy. A more reliable picture of US manufacturing trends is offered by the IHS Markit survey. Moreover, given the greater volatility of the ISM data relative to the IHS Markit and official data, it is possible that the current steep decline signalled by the ISM simply represents another case of the survey exaggerating the rate of change.
Meanwhile, for those concerned that the ISM may be signalling a global manufacturing downturn, a better insight into global trends is provided by our global PMI, which is based on responses to monthly questionnaires sent to purchasing managers in survey panels in over 40 countries, totalling around 13,500 companies. Coverage includes all major developed and emerging markets which collectively account for 98% of global manufacturing value added.

Chinese officials are signaling they’re increasingly reluctant to agree to a broad trade deal pursued by President Donald Trump, ahead of negotiations this week that have raised hopes of a potential truce.
In meetings with U.S. visitors to Beijing in recent weeks, senior Chinese officials have indicated the range of topics they’re willing to discuss has narrowed considerably, according to people familiar with the discussions.
Vice Premier Liu He, who will lead the Chinese contingent in high-level talks that begin Thursday, told visiting dignitaries he would bring an offer to Washington that won’t include commitments on reforming Chinese industrial policy or the government subsidies that have been the target of longstanding U.S. complaints, one of the people said.
That offer would take one of the Trump administration’s core demands off the table. It’s emblematic of what analysts see as China’s strengthening hand as the Trump administration faces an impeachment crisis — which has recently drawn in China — and a slowing economy blamed by businesses on the disruption caused by the president’s trade wars. (…)
Trump has said repeatedly he would entertain only an all-encompassing deal with China. People close to him say he remains firm in that view. (…)
People familiar with the state of play say contacts that resumed over the summer after a breakdown in May have focused on how to resume negotiations and avoid further escalating the tariff wars that have unnerved financial markets.
Yet those talks have centered more on a timeline for implementing a limited deal rather than the substance of provisions where the two sides are at odds.
Discussions have focused on what U.S. administration officials view as a three-phase process, people familiar with the talks said. The sequence would involve large-scale purchases of U.S. agricultural and energy exports by China, implementing intellectual-property commitments China made in a draft agreement this year and, finally, a partial rollback of U.S. tariffs.
Bloomberg News reported in September that Trump’s team was discussing a potential limited agreement that includes those elements. That could clear the way for broader negotiations next year. Yet if China insists it will not engage in any discussions on industrial policy, those plans could be scuttled. (…)
David Dollar, a former U.S. Treasury representative in China now at the Brookings Institution, says China’s push to narrow the discussions is more evidence that both sides are hardening their positions on a broader deal.
The U.S. and China increasingly have reasons to strike a “mini deal” and avoid an escalation, he said. China needs agricultural products such as pork that Trump wants it to buy so he can placate American farmers. And even people in the White House concede there’s a U.S. incentive to hold off on further tariffs to avoid a worsening economic slowdown going into 2020.
“It’s a funny kind of negotiation where both sides’ so-called concession is something that they need,” Dollar said.
EARNINGS WATCH
Dim Earnings Outlook Imperils Stocks A flurry of earnings reports in coming weeks will mark the latest test for stocks after a rocky stretch of economic data exacerbated worries that a global manufacturing slowdown is trickling into the U.S.
(…) Analysts expect earnings for companies in the S&P 500 to fall about 4% for the third quarter, according to FactSet data, in what would mark the biggest year-over-year drop since 2016. In recent months, Wall Street analysts have lowered their earnings expectations for all 11 sectors in the S&P 500, from energy to technology. (…)
Lighting-products maker Acuity Brands Inc. said Wednesday that sales volumes fell 16% in its latest quarter. Chief Executive Vernon Nagel pointed to “a number of market shocks, including the addition of significant tariffs placed on Chinese-made components and finished goods, uncertainty created by the threat of further trade actions and labor shortages in key markets” on the company’s earnings call. Shares slumped 11%, one of their biggest single-day drops of the past decade. (…)
Particularly worrying is the number of tech executives saying that earnings could take a hit. A record number of tech companies are on track to issue negative guidance for the third quarter, according to FactSet, potentially weighing on a key driver of the market’s gains. (…)
The coming earnings season could further distinguish the trade war’s relative winners from its losers, analysts said. For example, Nike Inc. executives said revenue is expected to grow this year after its sales beat expectations for its latest quarter, sending its shares to a record in September. (…)
Some facts:
We already got 21 Q3 earnings reports in. They surprised by 5.4% but still showed earnings down 13.0% on a +3.2% revenue growth. The same 21 companies had earnings down 11.2% in Q2.
The blended growth rate for Q3 has dropped from –2.2% on October 1, to –2.7% per IBES/Refinitiv. Ex-Energy: –0.8%.

 Travelling day. Actually, they will all be travelling days for another week. Will post when possible.


 German industrial output rebounds but recession fears linger Unexpected rise in key metric stokes hope downturn less severe than feared
 Orders Suggest That Germany Flirts With Some Sort of Recession


 Explaining US manufacturing PMI survey divergences