(…) With the -3.0% drop in August, following the -5.9% drop in July, -5.3% drop in June, and the -6.0% drop in May, we repeat our message from last three months: the shipments index has gone from “warning of a potential slowdown” to “signaling an economic contraction.”
We acknowledge that: all of these negative percentages are against extremely tough comparisons, and the Cass Shipments Index has gone negative before without being followed by a negative GDP. However, weakness in demand is being seen across most modes of transportation, both domestically and internationally, with many experiencing increases in the rates of decline.
The weakness in spot market pricing for many transportation services, especially trucking, is consistent with the negative Cass Shipments Index and, along with airfreight and railroad volume data, strengthens our concerns about the economy and the risk of ongoing trade policy disputes. Weakness in commodity prices, and the ongoing decline in interest rates, have all joined the chorus of signals calling for an economic contraction.
(…) we see a growing risk that GDP will go negative by year’s end. (…)

Auto Sales Revved Up August Retail Spending Otherwise, shoppers didn’t spend much more than in July, prompting forecasters to slightly lower their estimates for U.S. growth
Retail sales, a measure of purchases at stores, restaurants and online, climbed a seasonally adjusted 0.4% in August from a month earlier, the Commerce Department said Friday. The robust report beat economists’ expectations and came on the heels of stronger spending in July than initially estimated, a 0.8% rise. (…)
The increase in retail sales in August was driven by a 1.8% jump in spending on vehicles, a sign consumers felt comfortable enough in their finances to make large purchases. (…)
Still, outside of motor vehicles and parts, retail sales were flat in August, and without both vehicles and gasoline they rose a tepid 0.1%. Consumers spent less on food, dining out, and at furniture and department stores last month.
That softness in core retail sales prompted downgrades to forecasts for gross-domestic-product growth in the third quarter. Both the Federal Reserve Bank of Atlanta’s GDPNow model and forecasting firm Macroeconomic Advisers’ forecast slipped, to seasonally adjusted annual rates of 1.8% and 1.9%, respectively. (…)
Control Group retail sales (retail sales ex cars, gas, building materials and garden equipment, office supplies) which directly feed into GDP were unchanged MoM in August but that came after 5 very strong months (aggregating +10.0% annualized nominal growth).Control Group sales are up 4.5% YoY in August.

Here’s what Cass says about retail:
We should note that dry van trucking volume has historically been a fairly reliable predictor of retail sales (container volume serves a similar role). When studied using the DAT Dry Van Barometer, current demand is at levels in line with capacity, which suggests that the consumer economy is still relatively healthy and that retail sales are not contracting. That said, this is a period that seasonally should be seeing much stronger volumes, which makes us cautious about the outlook for demand in September and October.

INFLATION!?
Last week’s release of core CPI jumping to 2.4% YoY in August triggered David Rosenberg to work out that it should translate into a 0.16% MoM increase in the core PCE deflator which would keep it at +1.7% YoY.
But that would come on the heels of +0.18% in July, +.24% in June, +0.12% in May and +0.22% in April. Annualized rates would thus be: +2.0% last 2 months, +2.3% last 3 months, +2.1% last 4 months and +2.2% last 5 months.
The FRED chart below plots the difference between core CPI and core PCE inflation during the last 15 years:

Nordea combines 9 data sets to predict core CPI. This excludes the impact tariffs will (might) have:

Based on simulations of the Moody’s Analytics model of the global economy, this paper examines the consequences for the U.S. and global economies in different scenarios regarding how the trade war between the U.S. and China will unfold. (…)
A game of chicken typically ends one of two ways: Either one party gives way, or both get hurt. At some point it becomes too late for anyone to duck out, and both sides are doomed to mutual destruction. As the tariff volleys intensify, the odds are rising that the U.S. and China are pulled into an economic downturn that takes the rest of the world with them. At some point, a trade deal will not be enough to avert a global recession. (…)
Thing is, one of the chickens faces a deadline in 2020 and they both know it … The “free” chicken has to decide whether it really needs a short term deal or whether it lets the other chicken run until November 2020 and potentially watch it go down the cliff. But the other chicken can also decide not to keep running towards this potential cliff and find a way to halt the game, at least temporarily.
 Source: Deutsche Bank Research (via The Daily Shot)

Nate Silver, founder and editor in chief of FiveThirtyEight, once noted that
(…) since the Civil War, 73% of incumbent presidents who sought another term won, as have 70% since World War II. (…) every incumbent with an approval rating of 49% or higher won re-election, while every candidate with a rating of 48% or lower lost. (…)a year in advance of the election, the model figures that a president with a 60% approval rating is about 90% likely to win re-election, whereas a 40% rating translates into a win probability of a bit below 40%.
Hence
(…) Many of the president’s top economic officials are trying to resurrect the terms they previously were negotiating with China, a deal officials said was “90 percent” done before a sudden impasse this summer, according to a person familiar with the discussions. (…)
The goal of the internal administration discussions is to forestall October tariff increases and the next tariffs set to take effect in December, with some advisers arguing that the economic hit is real and must be mitigated prior to the election year. But the discussions remain fluid and Trump has yet to endorse an approach. (…)
The discussions about some kind of agreement come as the White House holds wide-ranging internal debates about ways to boost economic growth heading into 2020 as data suggest a clear slowdown with the trade wars having an obvious impact, especially on manufacturing.
A China deal is the most obvious way for the White House to affect markets and the economy short of various tax cut ideas being floated that are unlikely to pass Congress.
One of the people close to the talks said deputy-level officials will start meeting next week to set up a potential preliminary deal involving agriculture purchases by China and, on the U.S. side, easing export restrictions on Huawei and potentially more delays to tariff increases. (…)
The United States has gotten the green light to impose billions of euros in punitive tariffs on EU products in retaliation for illegal subsidies granted to European aerospace giant Airbus.
Four EU officials told POLITICO that the World Trade Organization ruled in favor of the U.S. in the long-running transatlantic dispute and sent its confidential decision to Brussels and Washington on Friday.
The decision means that U.S. President Donald Trump will almost certainly soon announce tariffs on European products ranging from cheeses to Airbus planes. One official said Trump had won the right to collect a total of between €5 billion and €8 billion. Another said the maximum sum was close to $10 billion. (…)
The ruling marks the culmination of a decades-long dispute on whether EU countries have illegally supported Airbus by granting subsidized loans known as “launch aid” and other advantages for the development of the A350 and A380 models. The U.S. first filed the complaint in Geneva against Airbus subsidies in 2006.
However, a parallel complaint by the EU, alleging illegal U.S. subsidies for Boeing, is also being examined by the WTO. A ruling in that case is expected in about eight months, industry sources said. (…)
The European Union plans to introduce a tax on digital services even in the absence of a global accord on a so-called ‘web tax’, the Commissioner-designate for Economic Affairs Paolo Gentiloni was quoted as saying on Monday.
“My first task will be to see whether it is possible to introduce a web tax at the OECD/G20 level, that is to say at a global level, because that would be the most effective solution,” Gentiloni, a former Italian prime minister, told daily La Stampa in an interview. (…)
China’s Economy Aches All Over as Beijing Seeks Trade Fix With the U.S. Economic activity in China cooled further in August, testing Beijing’s tolerance for slower growth as it seeks to ease trade tensions with the U.S.
(…) Value-added industrial output in China rose 4.4% in August from a year earlier, far below economists’ expectations of 5.2% growth and slower than the 4.8% increase in July, the National Bureau of Statistics said Monday.
Fixed-asset investment outside Chinese rural households climbed 5.5% in the January-August period from a year earlier, slightly below expectations. Retail sales in China rose 7.5% in August from a year earlier, a tick down from the 7.6% gain in July and below expectations for a 7.9% rise. (…)
Home sales by value for the January-August period rose 9.9% from a year earlier, higher than the 9.2% gain for the first seven months of the year. (…)


ING:
(…) Even with a large fiscal stimulus in infrastructure investment, it will be hard to overcome the damage from the loss of export orders due to the trade war and the structural weakness in global demand for smartphones and related products, both of which are highly weighted in the industrial production data.
The number of smartphones produced fell 10.7% year-on-year, which led to an overall drop of 6.2% YoY in electronic telecom devices. The production of cars fell 7.3% YoY. These products not only face headwinds from structural changes in their own markets but also from soft global demand. (…)
Oil Prices Soar as Saudis Speed to Restore Output Crude prices surged following an attack on Saudi Arabia’s oil infrastructure, as Saudi officials said the kingdom was racing to restore roughly one-third of the disrupted production by day’s end.
(…) Analysts cautioned that prices likely will be volatile as trading volumes increase throughout the session and more details emerge about the disruption in Saudi Arabia, where attacks over the weekend knocked out 5.7 million barrels a day of production, or roughly 5% of the globe’s output.
A sustained spike in fuel prices could mark the latest threat to a world economy already under significant pressure from the U.S.-China trade war. It could also impact stocks in the U.S., where resilient consumer spending has helped lift major indexes. Higher energy prices can raise gas and heating bills, cutting into available income. (…)
“These attacks make it even more difficult to protect these facilities, so there’s a reason why a risk premium is likely to stay over the coming weeks,” said Giovanni Staunovo, a commodity analyst at UBS Wealth Management.
 Question: how can we protect against terrorist drone attacks?
Goldman Sachs:
-
A very short outage – a week for example – would likely drive long-dated prices higher to reflect a growing risk premium, although short of what occurred last fall given a debottlenecked Permian shale basin, a weaker growth outlook and prospects of strong non-OPEC production growth in 2020. Such a price impact could likely be of $3-5/bbl.
-
An outage at current levels of two to six weeks would, in addition to this move in long-dated prices, see a steepening of the Brent forward curve (2-mo vs. 3-year forward) of $2 to $9/bbl respectively. All in, the expected price move would be between $5 and $14/bbl, commensurate to the length of the outage (a six month outage of 1 mb/d would be similar to a six week one at current levels).
-
Should the current level of outage be announced to last for more than six weeks, we expect Brent prices to quickly rally above $75/bbl, a level at which we believe an SPR release would likely be implemented, large enough to balance such a deficit for several months and cap prices at such levels.
-
An extreme net outage of a 4 mb/d for more than three months would likely bring prices above $75/bbl to trigger both large shale supply and demand responses.
(…) we believe the scale of an OECD SPR release could be significant, up to 3.0 mb/d (1.5 mb/d in the US, 1.5 mb/d elsewhere) for at least two-three months and with China potentially adding another 1 mb/d. Such a large response is significant and can offset a potential sustained maximum Saudi outage for several months[1]. This suggests that the release of SPR barrels can eventually provide a material cap to the rally in prices.
(…) Today, energy accounts for about 2.5% of household consumption, down from around 8% in the 1970s, according to Bank of America economists. (…) and the U.S. is now the world’s top oil producer, ahead of Saudi Arabia, according to the Energy Information Administration. (…)
China produces roughly 4.8 million barrels of oil a day but consumes about 12.8 million, according to the EIA, which makes it heavily dependent on oil imports. (…)
Global GDP growth is seen slipping further:

Source: Oxford Economics (via The Daily Shot)
But could be in a bottoming process:
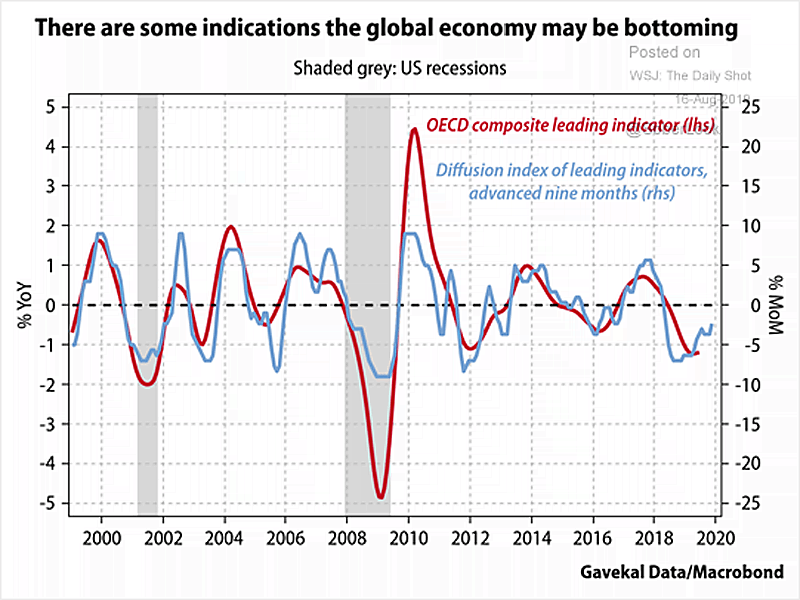
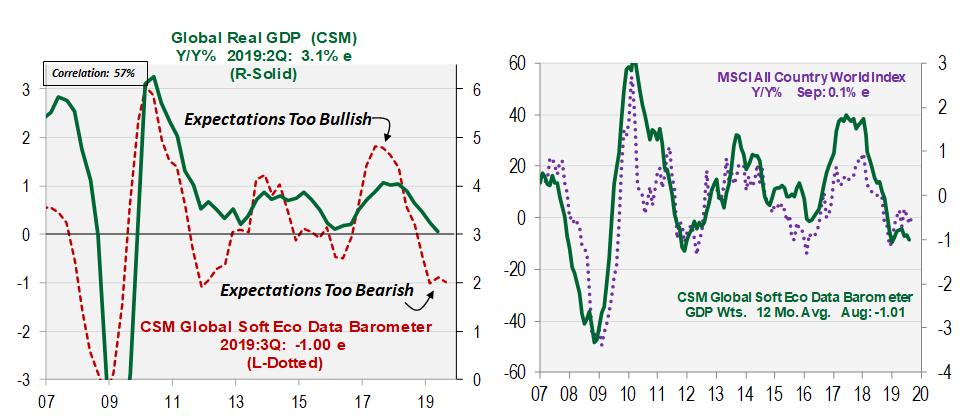 (Cornerstone Macro)
United Auto Workers Go on Strike at GM’s U.S. Factories Factory workers at General Motors went on a nationwide strike, in the United Auto Workers’ largest work stoppage in more than a decade.
The union’s leadership called the strike after talks with GM on a new four-year labor agreement stalled. UAW leaders from across the country voted overwhelmingly here Sunday to authorize the action, instructing nearly 46,000 blue-collar workers at 31 GM plants to either walk off the job or stay home. The UAW confirmed the start of the strike in a statement early Monday. (…)
Union leaders and their members have made it clear they want to share in the earnings gains and are pressing for richer wages and benefits, as well as a commitment to save the four U.S. factories the company has moved to close. (…)
EARNINGS WATCH
From Refinitiv/IBES:
Through Sep. 13, 499 companies in the S&P 500 Index have reported earnings for Q2 2019. Of these companies, 73.9% reported earnings above analyst expectations and 18.0% reported earnings below analyst expectations. In a typical quarter (since 1994), 65% of companies beat estimates and 20% miss estimates. Over the past four quarters, 76% of companies beat the estimates and 18% missed estimates.
In aggregate, companies are reporting earnings that are 5.6% above estimates, which compares to a long-term (since 1994) average surprise factor of 3.3% and the average surprise factor over the prior four quarters of 5.3%.
Of these companies, 56.4% reported revenues above analyst expectations and 43.6% reported revenues below analyst expectations. In a typical quarter (since 2002), 60% of companies beat estimates and 40% miss estimates. Over the past four quarters, 63% of companies beat the estimates and 37% missed estimates.
In aggregate, companies are reporting revenues that are 1.0% above estimates, which compares to a long-term (since 2002) average surprise factor of 1.5% and the average surprise factor over the prior four quarters of 1.0%.
The estimated earnings growth rate for the S&P 500 for 19Q2 is 3.2%. If the energy sector is excluded, the growth rate improves to 3.9%.
The estimated revenue growth rate for the S&P 500 for 19Q2 is 4.6%. If the energy sector is excluded, the growth rate improves to 5.1%.
Analysts keep revising their estimates downward, large and small caps:


This in spite of preannouncements being more positive than at this time during Q2:

The estimated earnings growth rate for the S&P 500 for 19Q3 is -2.2% (–2.0% last week). If the energy sector is excluded, the growth rate improves to -0.4% (-0.3%).
Trailing EPS are $164.44. The Rule of 20 P/E is 20.7.

TECHNICALS WATCH
Lowry’s Research notes that “since the Aug. market low, small caps have played a leading role, outpacing gains in the large and mid cap stocks. (…) Measures of small cap breadth have also recently shown improvement. (…) While these signs of improving breadth and relative performance are encouraging in terms of a rejuvenated bull market, thus far these improvements are only short-term in nature. (…) So long as expanding market breadth produces new highs in the broad based Adv-Dec Lines and a positive balance of rising Demand and, especially, falling Supply exists, the bull market should remain alive and well.”
Lowry’s measures of demand and supply have improved in recent weeks. “These sustained trends of improving Demand and contracting Supply suggest prices are set to continue rising on an intermediate-term basis.”

But the S&P 500 is well above its 200 dma (next 3 charts from Yardeni.com):

Small caps look cheap on a relative basis:

But their relative EPS trends are not positive:

Also, know that Zombie companies are more prevalent among small firms. Low rates have been supporting this trend.

Source: Arbor Research & Trading (via The Daily Shot)
BTW:
Junk Debt Sends Early Warning Signals Warning signals are starting to flash in the market for junk debt, an indicator that investors are worried that companies with high debt loads could be at risk even if the U.S. economy avoids recession.
(…) By one key measure, the risk in the high-yield bond market is at its highest level since 2016, when a sharp slide in oil and natural-gas prices triggered a string of energy-sector defaults. The U.S. distress ratio, which is the proportion of junk bonds that yield more than 10 percentage points above Treasurys, jumped to 9.4% in August this year from around 6% in July, according to data from S&P Global Ratings. (…)
Investors pulled about $6 billion from mutual funds and exchange-traded funds that buy high-yield bonds and leveraged loans and put almost $20 billion into investment-grade corporate bond funds in the six weeks ended Sept. 11, according to data from Lipper.
The liquidity squeeze forced junk-rated companies to sweeten terms of new deals to attract sufficient interest. About one-quarter of borrowers in the leveraged-loan market cut pricing during their marketing processes in August, up from 20% in July and 17% in June, according to data from LCD, a unit of S&P Global Market Intelligence. (…)

(…) Apple once dominated China’s market for premium smartphones, with iPhones accounting for over 80% of handsets sold in the $600-$800 price bracket in the first quarter of 2018. A year later, that dominance had vanished, with its market share plunging to 37% as local rivals overshadowed the iPhone.
During that same period, Chinese phone maker Huawei Technologies has seen its share of the premium smartphone market grow nearly fivefold to 48%, according to Counterpoint, an Asia-based technology analysis company.
China is still a key market for Apple, accounting for more than 17% of its total sales. (…)
A perhaps more critical question for Apple in China is when it will release a 5G-compatible iPhone.
China Mobile and the other two China telecom leaders are expected to roll out 5G communication in most major cities in China by year-end. Chinese customers are eager to experience 5G as soon as the infrastructure is in place, and Asian phone makers have been racing to compete for the upcoming market by unveiling 5G-compatible smartphones.
Huawei’s 5G smartphone went on sale in August, with more than 1 million customers placing preorders. Fellow Chinese maker Xiaomi is expected to unveil its new 5G phone soon, while Samsung Electronics of South Korea launched its first 5G smartphone earlier this year.
At Tuesday’s event, Apple executives did not give out any hints on the 5G iPhone. (…)
(…) Compared with the prices in the U.S., Chinese consumers have to pay a premium that’s between 10.5% and 12.5% for the iPhone 11, and 18.6% to 23% more for the iPhone 11 Pro and Pro Max, according to an analysis by CNBC. (…)


 BUY CANADA!


