The U.S. tariffs of 15% on tools, apparel items, some footwear and many electronics will be charged on imports valued at $111 billion last year, according to an analysis by The Wall Street Journal. Additional tariffs of 15% on $156 billion of smartphones, laptops, toys, videogames and other products have been postponed until Dec. 15, after the period when goods are typically imported for the holiday season. (…)
Chinese retaliatory measures also went into effect on Sunday, with more to come on Dec. 15. The biggest categories of American exports to be hit with extra tariffs Sunday include $3.2 billion in annual soybean shipments, $2.55 billion in crude oil and $1.16 billion in pharmaceuticals, according to Panjiva Research. (…)

(…) In conversations over the past week, the two sides have failed to agree on at least two requests — an American appeal to set some parameters for the next round of talks and a Chinese call to delay new tariffs, two of the people said. (…)
Perhaps the biggest question facing investors right now is whether consumer spending will follow the deteriorating trend in the industrial economy that has spread from China to Germany and the U.S. in recent quarters.
For now, the pessimism of stock analysts clashes with the willingness of American consumers to keep boosting corporate profits. (…)
Here’s a rundown on the U.S. consumer:
Consumer Spending Rise Bolsters Confidence in Economy U.S. households ramped up their spending in July, providing reassurance that the economy’s decadelong expansion continued to roll despite slowing factory activity and global growth.
Personal-consumption expenditures, a measure of household spending, increased a seasonally adjusted 0.6% in July from June, a pickup from the previous two months, the Commerce Department said Friday, continuing a solid performance by the economy’s main driving force. (…)
Household income growth slowed sharply in July, rising just 0.1% after increasing 0.5% in June, Commerce said Friday. Wages and salaries edged up a modest 0.2%, while income on assets fell. (…) The personal saving rate—the difference between after-tax income and spending—was 7.7% in July, down from 8.0% in June and the lowest level since November but still elevated. (…)
“I’m telling my customers, ‘Shop now for Christmas because I’m getting all these emails from all my vendors. They’re all doing price increases starting September,†said Tara Riceberg, owner of Los Angeles-area gift shops Tweak and Tesoro.
Ms. Riceberg will face price increases of up to 30% on furniture for her new store if she doesn’t make purchases soon. Prices are going up on plastic bottles, travel pillows and hourglass minute timers from another vendor due to tariffs, meaning she will have no choice but to pass them along to customers.
“It is going to be terrifying that something that I regularly sell at X is going to be 30% more expensive come December,†Ms. Riceberg said. (…)
The price index for personal-consumption expenditures rose 0.2% in July from the prior month and increased 1.4% from a year earlier. Excluding volatile food and energy costs, prices were up 0.2% on the month and rose 1.6% from a year earlier.
Wages and Salaries are up 3.2% annualized in the last 3 months, +4.2% in the last 2 months and 5.2% YoY in July. Nominal disposable income growth is also good in the 4.0-4.5% range. Real expenditures are up 2.7% YoY in July but rose at a 4.0% annualized rate in the last 3 months (table from Haver Analytics)

Americans have been spending along with the means afforded by their labor income since 2013 but growth in their means (aggregate weekly payrolls) has slowed from 5.7% YoY in January to 4.4% in July along with the slowdown in total employment growth from +1.9% in January to +1.5% in July and in average weekly hours (-0.6% YoY in July).

In fact, sequential growth in aggregate payroll income has been in the 3.0-3.2% range in the last 6 months, pointing to a slowdown in disposable income growth in the second half unless employment growth picks up, unlikely as things are now or unless Americans dip into their savings, especially if they decide to beat the tariffs tax coming. However, I would not hang my best hat on that iffy assumption. The savings rate has dropped from 8.8% last December to 7.7% in July, meaningfully boosting spending but it is now in line with last year’s average, although still above 2016-17 levels.

The fact remains that the more dependable fundamentals of consumer spending are weakening right as we enter the critical part of the year. As President Trump likes to say, we’ll see what happens.
Meanwhile, inflation is perking up: core CPI is +2.2% YoY and core PCE is +1.6%. Last 3 months annualized: core CPI +1.9%, core PCE: +2.2%. Good thing food and gas prices are quiet these days. Total PCE is +1.4% YoY and +1.6% annualized in the last 3 months.


Source: @nytimesbusiness (via The Daily Shot); Read full article
Price-tracking firm GasBuddy predicts the national average for a regular gallon of gas will be $2.55 a gallon on Labor Day, down nearly 30 cents from last year and the lowest price on the holiday since 2016. The national average has fallen for six straight weeks to $2.58. (…)
Since 1973, the U.S. hasn’t had a recession that wasn’t accompanied by a sharp run-up in oil prices, according to James Hamilton, an economics professor at the University of California, San Diego, and Dow Jones Market Data. (…)
The average U.S. household uses about 750 gallons of gasoline a year, according to an estimate from AAA, the automobile association. So a 27-cent-per-gallon drop—the amount that the national average is predicted to fall this Labor Day versus last—would save families about $202.50 a year, or $16.88 a month. (…)
The University of Michigan on Friday said its final index of August consumer sentiment was 89.8, a drop of 8.6 points from July. That was the largest monthly drop since December 2012, when consumers were worried about the “fiscal cliff†of rising taxes and reduced federal government spending. (…) About a third of consumers surveyed mentioned tariffs as a negative driver, said Richard Curtin, the survey’s chief economist. (…) Respondents who mentioned tariffs expected stronger inflation in the year ahead than those who didn’t, Mr. Curtin said. They also were more likely to say they expected rising unemployment and smaller income gains. (…)
Scroll back to the savings rate chart above. The big spike was in December 2012.
THE PMIs
U.S manufacturers signalled a further slowdown in overall growth in August, with the PMI dropping to its lowest for almost a decade. The headline figure was weighed on by a subdued rise in production and lacklustre client demand. Falling orders among foreign clients dragged on overall new business growth and producer confidence. The degree of optimism about the year ahead hit a fresh seven-year series low amid growing business uncertainty. As such, employment was broadly unchanged and spare capacity was used to clear backlogs of work. Meanwhile, inflationary pressures eased further, with rates of input price and output charge inflation among the slowest for almost three years.
The seasonally adjusted IHS Markit final U.S. Manufacturing Purchasing Managers’ Index™ (PMI™) posted 50.3 in August, up from the flash reading of 49.9 but still down slightly from 50.4 in July. As such, the latest reading signalled the least marked improvement in the health of the U.S manufacturing sector since the depths of the financial crisis in September 2009.

The rate of production growth was among the slowest seen for over three years in August, as lacklustre client demand led increasing numbers of firms to curb output. Although the pace of increase picked up slightly, some firms attributed the rise to efforts to clear backlogs of work rather than reflecting any new inflows of orders.
Concurrently, the pace of the upturn in new business eased to a fractional rate that was the slowest for three months and among the weakest seen over the past ten years. Deteriorating demand conditions, especially across the automotive sector, were linked to subdued client demand. External demand also weighed on new business growth, as new export orders fell at the quickest pace since August 2009, linked by many firms to trade wars and tariffs.
In line with the near-stalling of new orders, output expectations dipped to a new series low in August. Although firms were largely optimistic, many stated that uncertainty and fears of a global economic downturn weighed on confidence.
At the same time, firms remained hesitant towards hiring in August, with employment levels broadly unchanged during the month. That said, some firms stated that little change in workforce numbers was in part due to difficulties finding suitable candidates.

On the price front, historically muted rises in input prices and output charges were once again recorded by goods producing firms in August. A reduction in demand for inputs reportedly limited suppliers’ pricing power, and pressure to remain competitive meant that firms largely refrained from sharp rises in output charges.
Weak client demand also led to a further fall in input buying among manufacturing firms and both pre- and postproduction stocks were depleted at modest rates.
From the WSJ:
Economic confidence among small U.S. companies fell in August to the lowest level since November 2012, according to a monthly survey of more than 670 small companies conducted for The Wall Street Journal. The portion of respondents that expect the economy to worsen over the next 12 months rose to 40%, compared with 29% in July and 23% a year ago.
The survey of small U.S. companies by Vistage Worldwide Inc., an executive coaching organization, was taken last month, just after President Trump announced additional tariffs on Chinese imports, but before he ordered U.S. companies to start looking for alternatives to China. Forty-five percent of the small firms—which have revenue between $1 million and $20 million—said the president’s tariff announcement would impact their businesses.
In the survey, some U.S. small-business owners said they supported the tariffs, even if they are painful in the short run, and a majority said they are optimistic about their finances. Also, tariffs are just one factor contributing to changes in the economic outlook.
But business owners on both sides of the tariff issue said the uncertainty—about if and when the duties will be applied, how large they will be and how long they will remain in effect—is making it hard to plan and is hurting their businesses. (…)

Operating conditions faced by Chinese manufacturers improved slightly in August, with firms registering the quickest increase in production for five months. New order intakes were meanwhile broadly stable, despite a faster decline in export sales. The improved production trend led firms to expand their purchasing activity further, while stocks of finished goods rose for the first time this year to date. Prices data showed a renewed fall in input costs contributed to a stronger decline in output charges. At the same time, sentiment regarding the 12-month outlook for output softened to a level that was among the lowest in the series history, with optimism dampened by worries over the future trading relationship of China and the US, as well as signs of weaker global conditions.
The headline seasonally adjusted Purchasing Managers’ Index™ (PMI™) rose from 49.9 in July to 50.4 in August, signalling a renewed improvement in the overall health of the sector. Though only marginal, it was the strongest improvement recorded since March.

Supporting the higher headline index reading was the quickest increase in production for five months. Though only slight overall, the expansion contrasted with broadly unchanged output in July and a reduction in June. This contributed to the first rise in stocks of finished goods in 2019 to date.
Companies often mentioned raising output due to signs of firmer demand conditions. After a marginal rise in July, total new work received by Chinese manufacturers was broadly stable during August. Data indicated that improved domestic demand helped to offset a further reduction in export sales. Notably, the latter fell at the quickest pace since last November.

Capacity pressures meanwhile persisted in August, as highlighted by a further increase in backlogs of work. The rate of accumulation was the quickest seen for just over a year. Improved order book trends and insufficient staff numbers were linked to the latest rise in outstanding workloads. Employment was broadly unchanged in August, following a modest reduction in July.
Buying activity rose slightly for the second month running, with some firms attributing this to rising output requirements. Stocks of purchases meanwhile fell marginally. Average input costs fell across China’s manufacturing sector in August amid widespread reports of reduced raw material prices. Though moderate, the rate of reduction was the joint-quickest since January 2016. Lower cost burdens and efforts to stimulate sales led firms to cut their output charges at a quicker pace in August, with the rate of discounting the steepest since December 2015.
Although firms generally anticipate output to increase over the next year, the degree of confidence weakened from July, largely due to concerns over the ongoing China-US trade dispute and signs of a slowing global economy.
-
China’s Yuan Drops to Fresh 11-Year Low China’s yuan weakened further, at one point nearing 7.2 to the dollar, less than a month after Beijing let the currency pass a threshold it had previously defended.

The IHS Markit Eurozone Manufacturing PMI® improved on July’s six-and-a-half year low during August, but nonetheless remained well inside contraction territory. Rising from 46.5 in July to a level of 47.0, the index registered its second-lowest reading since April 2013 to indicate another notable deterioration in operating conditions. The PMI has now recorded below the 50.0 no-change mark for seven successive months.

At current levels, the survey is consistent with goods production declining at a quarterly rate of 1%.
The downturn in the manufacturing sector remained centred on the intermediate and investment goods categories during August, with notable contractions recorded across both sectors. In contrast, consumer goods continued to buck the wider trend, expanding at a solid rate and extending the current period of growth to nearly six years. (…)
 Order books continued to decline in August, and again at a rate that was amongst the sharpest seen over the past six years. Only France, Greece and the Netherlands recorded any growth in new order books, whilst Germany continued to record the greatest monthly drop. Exports remained a source of demand weakness, with the rate of contraction signalled by the survey again considerable despite improving on July’s near eight-year record.
(…) Employment has now fallen for four months in succession, with the latest reduction at a pace little changed on July’s 74-month record. The degree to which employment was cut in Germany was the greatest in just over eight years. (…)
With few supply-side constraints, prices for raw materials and semi-manufactured goods continued to decline in August. Latest data marked a third successive monthly fall, with the rate of reduction only slightly weaker than July’s 39-month record. Firms responded by reducing their own charges, albeit only marginally.
Finally, worries of a further deepening of the recent global manufacturing downturn, in part related to the ongoing trade war between the US and China, pushed confidence amongst firms to its lowest level since November 2012. Outright pessimism about the future was seen in Austria and Germany, with firms based in the latter the most downbeat in over eight years of data collection.
The headline Jibun Bank Japan Manufacturing Purchasing Managers’ Index™ (PMI)® was little-changed from July, recording 49.3 (49.4 previously). This was consistent with a contraction in the manufacturing economy and was among the strongest declines seen across the past three years.

Continuing the trend which has been apparent since the turn of the year, new business placed with Japanese manufacturers fell in August. The reduction gathered pace since July and was the fastest in five months. Slower demand was attributed to tougher conditions in both domestic and overseas markets. Panellists also mentioned China as a particular source of weakness, with survey data showing reduced inflows of new export orders.
(…) August’s fall in output was the eighth in as many months, although the pace of decrease was the weakest since January. (…) Japanese manufacturers also looked to keep stock levels lean, with both pre and post-production inventories being depleted during the latest survey period.
Elsewhere, there were signs of a softening inflation environment in August, with input costs rising at the slowest rate since December 2016. Reports suggested that some suppliers had offered discounts, however this failed to offset higher transport costs and increased prices for other raw materials. Nonetheless, Japanese manufacturers reduced their output charges in an attempt to stimulate sales, marking a third successive reduction in selling prices. (…)
If you think other ASEAN countries are doing better owing to the U.S./China trade war:
The headline index fell further below the 50.0 neutral mark, slipping from 49.5 in July to 48.9 in August and signalling a further deterioration in the health of the ASEAN manufacturing sector, the quickest since late-2015. Contributing to the decline was a moderate reduction in new business inflows and a second consecutive downturn in output. The strongest fall in external demand since November 2015 also weighed on overall new orders. (…)

Three countries are in contraction but all seven are weakening:

This is a big deal nobody seems to care about, now:

Well, some people do care about that:
(…) Across emerging markets, the yield from junk-rated debt in U.S. dollars has spiked to more than 3.6 times that of investment-grade issuers, according to a Bloomberg analysis. That’s the highest ratio since the data was first compiled in 1998, adjusting for duration. (…)

The other big slowdown:

Source: ANZ Research (via The Daily Shot)
EARNINGS WATCH
From Refinitiv:
Through Aug. 30, 496 companies in the S&P 500 Index have reported earnings for Q2 2019. Of these companies, 73.8% reported earnings above analyst expectations and 18.1% reported earnings below analyst expectations. In a typical quarter (since 1994), 65% of companies beat estimates and 20% miss estimates. Over the past four quarters, 76% of companies beat the estimates and 18% missed estimates.
In aggregate, companies are reporting earnings that are 5.6% above estimates, which compares to a long-term (since 1994) average surprise factor of 3.3% and the average surprise factor over the prior four quarters of 5.3%.
Of these companies, 56.5% reported earnings above analyst expectations and 43.5% reported earnings below analyst expectations. In a typical quarter (since 2002), 60% of companies beat estimates and 40% miss estimates. Over the past four quarters, 63% of companies beat the estimates and 37% missed estimates.
In aggregate, companies are reporting earnings that are 1.2% above estimates, which compares to a long-term (since 2002) average surprise factor of 1.5% and the average surprise factor over the prior four quarters of 1.0%.
The estimated earnings growth rate for the S&P 500 for 19Q2 is 3.2%. If the energy sector is excluded, the growth rate improves to 3.9%.
The estimated revenue growth rate for the S&P 500 for 19Q2 is 4.6%. If the energy sector is excluded, the growth rate improves to 5.1%.
Overall a pretty good earnings season with EPS up 3.2% after +1.6% in Q1. Excluding share buybacks, earnings are +1.4% in Q2 after –0.8% in Q1 so no “earnings recession†on large caps just yet. That is unless you operate in sectors such as Energy, Materials and Technology which have all experienced 2 consecutive quarterly earnings declines and are forecast to have another one in Q3.

Earnings revisions remain generally negative…


…even though preannouncements are surprisingly good given the environment:

Just in the past week, we got 12 positive guidance against 7 negative. 34 companies have positively preannounced for Q3, up from 20 at the same time in Q2.
Factset tells us that earnings revisions for Q3 are, so far, roughly in line with history ex-tax reform:
The Q3 bottom-up EPS estimate (which is an aggregation of the median EPS estimates of all the companies in the index for the third quarter) dropped by 3.0% (to $41.64 from $42.90) during this period. During the past five years (20 quarters), the average decline in the bottom-up EPS estimate during the first two months of a quarter has been 2.6%. During the past 10 years, (40 quarters), the average decline in the bottom-up EPS estimate during the first two months of a quarter has been 2.1%. During the past fifteen years, (60 quarters), the average decline in the bottom-up EPS estimate during the first two months of a quarter has been 3.1%. (Factset)

Q3 earnings are now expected to decline 1.8% (-0.3% ex-Energy), unchanged from last week.
Trailing EPS closed the month (and, likely, the second quarter) at $164.43, up 0.3% from 3 months ago and only 1.0% from 6 months ago but still +7.6% YoY.
The near-stalling in trailing EPS coupled with the rise in core inflation from 2.00% to 2.21% results in the Rule of 20 Fair Value (20 minus inflation times EPS) declining for the second consecutive month, a headwind for equities if not reversed fairly soon. FYI, the correlation between the S&P 500 Index and the Rule of 20 Fair Value is 98% since 1927 and 1957, 97% since 1980 and 96% since 2003 (blue and yellow lines).


TECHNICALS WATCH
This is a game of probabilities and Lowry’s Research talks probabilities: “While the market deals in probabilities, not certainties, the more positive balance of Supply and Demand during the current market pullback/consolidation suggests the probabilities should favor a renewed rally, likely to reach new all-time highs in the months ahead.â€
But its closing is significantly less probabilistic: “This combination of exhausted Supply and strengthening Demand offers compelling evidence of a sustainable market bottom.â€
FYI: compelling: “not able to be refuted; inspiring conviction. Not able to be resisted; overwhelming.â€
To Lowry’s credit, its analysis remained positive last December but equities valuation was a lot more compelling at 16.8 on the Rule of 20 P/E scale.
SENTIMENT WATCH

Source: BofA Merrill Lynch Global Research (via The Daily Shot)
Yearslong Tax Dispute Could Cost Big Tech Companies Billions A long-running tax dispute is racking up a potentially hefty price tag of nearly $2 billion and counting for dozens of big U.S. companies, including Facebook and Google’s parent, Alphabet.
Since the most recent ruling on the case, in June, more than two dozen companies have disclosed the potential impact on their financial results. Facebook recorded a $1.1 billion tax expense because of the case, while Alphabet, the parent of Google, reversed a $418 million benefit it had previously taken. Other companies reporting at least a $50 million impact include Twitter Inc., Lam Research Corp. and Symantec Corp.
The case pits Altera Corp., now a subsidiary of chip maker Intel Corp. INTC 1.15% , against the Internal Revenue Service. The IRS in 2003 issued a regulation dictating how companies must account for stock and other equity compensation they pay to workers when they are parceling out costs between the parent and their foreign subsidiaries. Altera sued in 2012, arguing the IRS exceeded its authority.
Legally, the case turns on questions of administrative law and the government’s ability to fill in the gaps in a vague statute. It also has significant tax consequences. A federal appeals court in San Francisco is deciding whether to give the issue another hearing.
Multinationals benefit by allocating as much pay as possible—including stock-based pay—to U.S. operations, where the companies could claim a business-expense deduction for it against higher domestic tax rates. In foreign jurisdictions, reporting lower costs increases profits that can be taxed at lower foreign rates. That was especially advantageous before the 2017 federal tax overhaul reduced the gap between U.S. and foreign corporate-tax rates.
The government’s 2003 rule requires companies to share more of the costs with their foreign subsidiaries, reducing taxable profits in low-tax jurisdictions and increasing them in the U.S.
Companies are supposed to determine the right foreign-U.S. split by figuring out what the foreign subsidiaries would have had to pay an unrelated company for the same services. The fight over the regulation is about how that calculation happens. (…)
In 2015, the U.S. Tax Court ruled for Altera. In 2018, the Ninth U.S. Circuit Court of Appeals overturned that decision—siding with the IRS—then withdrew its own ruling because one of the judges in the 2-1 majority died before it was released. A new panel reached the same conclusion this year, upholding the 2003 rule on the grounds that the IRS had acted reasonably and legally in writing the rules. (…)
No Relief for Big Tech Under New EU Leadership The incoming head of the EU executive arm is promising new laws on artificial intelligence and the use of big data within 100 days of taking office on Nov. 1, as the bloc’s antitrust enforcer gathers evidence to probe the practices of companies including Facebook and Amazon.
(…) Mrs. Von der Leyen, the former German defense minister, in addressing the European Parliament before her confirmation hearing in July, said she was in favor of fair taxes on tech giants that “barely pay any taxes because they play our tax system.†(…)
China will exempt Tesla Inc’s (TSLA.O) electric vehicles from its purchase tax, the Ministry of Industry and Information Technology (MIIT) said on Friday, a concession made amidst trade tensions with the United States.
Tesla sees China as one of its most important, growing markets, and the exemption from a 10% purchase tax could reduce the cost of buying a Tesla by up to 99,000 yuan ($13,957.82), according to a post on Tesla’s social media WeChat account. (…)
Trucking Company Shutdowns Grow as Shipping Market Cools Carrier failures more than triple in the first half of 2019 from the prior year period as truckers cope with slowing demand
Approximately 640 carriers went out of business in the first half of 2019, up from 175 for the same period last year and more than double the total number of trucker failures in 2018, according to transportation industry data firm Broughton Capital LLC. (…)

Source: @WSJ; Read full article
(…) the car can accelerate from 0-60 mph in less than 3 seconds. (Tesla claims its upcoming new Roadster goes 0-60 in 1.9 seconds.) (…) Lotus claims the Evija can reach 186 mph in less than 9 seconds, which is “better than any other direct competitor,†the company says. (…)
Lotus’ hypercar should be able to reach 250 miles before its 70 kilowatt-hour (kWh) battery runs out of juice. Recharging up to 80% of the battery’s capacity at an 800-volt, 350 kW, Level 3 fast charger will take 12 minutes, while you’d need to wait additional six minutes for a full charge. Impressive, but still not the world’s fastest-charging battery pack despite the company’s claim — the Porsche Taycan’s battery charges from 0-100% in only 15 minutes. (…)
Lotus plans to produce only 130 of these beauties, making the Evija one of the scarcest cars on the planet. (…)

I did the math for you: at top speed, you’ll need to recharge every 80 minutes. I’ll pass. 


 Meanwhile, China’s growing Services sector helps support the economy:
 Composite business activity growth improves to four-month high in August

 The Atlanta Fed:


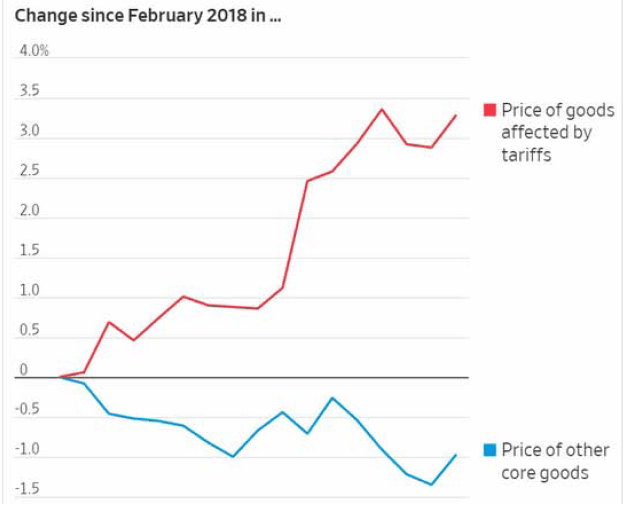


 How Much Will the Trade War Cost You by the End of the Year?
 Cheap Gas Revs Up Consumers, Boding Well for U.S. Economy


 Lotus rises from the dead with a 2,000-horsepower electric sports car