The Chicago Fed’s National Activity Index (CFNAI) is a monthly indicator designed to gauge overall economic activity and related inflationary pressure. It is a composite of 85 monthly indicators as explained in this background PDF file on the Chicago Fed’s website. The index is constructed so a zero value for the index indicates that the national economy is expanding at its historical trend rate of growth. Negative values indicate below-average growth, and positive values indicate above-average growth. (…)

China confident of keeping 2019 growth within ‘appropriate range’ China is fully confident that it is capable of keeping its economic growth rate within an appropriate range in 2019 in spite of challenges, state news agency Xinhua reported Chinese Premier Li Keqiang as saying on Friday.
The FT reports that research firm Strategy Analytics’ numbers reveal that Huawei increased its market share in China during the fourth quarter from 20% to 27.8% in the last year, while Apple saw its share decline from 11.5% to 10.1%. Local rivals Oppo and Vivo also increased their market share. According to Strategy Analytics, Apple now ranks 5th in China, a very uncomfortable position in the largest market in the world.
Pricing may not be Apple’s main handicap. American brands in general seem to be suffering from the trade war. New American made car sales in China dropped 18.5% in 2018 while Japanese, German and Korean brands sales grew 5.7%. 4.8% and 3.1% respectively. In December 2018, American car sales slumped 39.6% while Japanese and German car sales rose 10.%. American brands took 10.5% of the huge Chinese market in 2018, down from 12.3% in 2017. It was down to 9.0% in December 2018 from 12.5% in December 2017.
-
Manufacturers Take Sales Hit in China U.S. companies that bet heavily on China’s expansion are watching that opportunity shrink, as Chinese demand for U.S. goods weakens and U.S. factories’ export activity declines.
(…) “China is weaker than normal, weaker than seasonal,” Keith Jackson, chief executive of ON Semiconductor Corp. , said earlier this month. (…) Industrial glue maker H.B. Fuller Co. , which gets about 13% of its sales from China, said weaker demand there had cut $10 million off its profit in 2018 and would likely reduce profit by $20 million this year. (…) PPG Industries Inc. said sales of its coatings for cars made in China fell 15% in the fourth quarter. (…)
China isn’t the only problem for U.S. manufacturers exposed to global trade. A stronger dollar and higher costs as a result of tariffs on some foreign goods are also weighing on some companies.
The WSJ Dollar Index, which tracks the dollar against a basket of currencies, is up 7% from a year ago, meaning overseas sales equate to less earnings in dollar terms. And U.S. companies face higher prices for steel, aluminum and Chinese-made goods like engines and vinyl flooring that are now subject to tariffs.
Correct Craft Inc., a Florida-based boat manufacturer, is paying more for aluminum, and it is losing sales in Europe as a result of retaliatory tariffs placed on boats made in the U.S. (…)

Source: Pantheon Macroeconomics (via The Daily Shot)
Like other manufacturers, Caterpillar has also raised prices to offset rising transportation and material expenses. Some of those higher costs are a result of U.S. tariffs on foreign goods including steel and aluminum.
“Material costs and freight were adverse and worse than we were expecting,” Caterpillar Financial Chief Andrew Bonfield said on Monday in an interview. (…) Caterpillar said costs related to tariffs came in close to the bottom end of the $100 million to $200 million range it had expected for 2018.
The company has said it plans to raise prices between 1% and 4% in 2019 on most of its machines and engines to offset higher costs. (…)
EARNINGS WATCH
Of the 112 companies in the S&P 500 that have reported earnings to date for Q4 2018, 72.3% have reported earnings above analyst expectations. This is above the long-term average of 64% and below the average over the past four quarters of 78%.
In aggregate, companies are reporting earnings that are 2.1% above estimates, which is below the 3.2% long-term (since 1994) average surprise factor, and below the 5.7% surprise factor recorded over the past four quarters.
Fourth quarter earnings are expected to increase 14.3% from Q4 2017. Excluding the energy sector, the earnings growth estimate declines to 12.4%.
58.0% of companies have reported Q4 2018 revenue above analyst expectations. This is below the long-term average of 60% and below the average over the past four quarters of 72%. In aggregate, companies are reporting revenues that are 0.4% above estimates.
Fourth quarter revenue is expected to increase 5.6% from Q4 2017. Excluding the energy sector, the revenue growth estimate declines to 4.8%. (Factset)
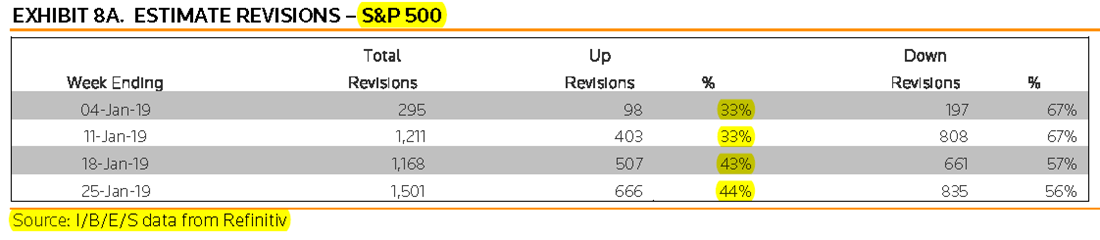
From Refinitiv:


At this point in time, 16 companies in the index have issued EPS guidance for Q1 2019. Of these 16 companies, 15 have issued negative EPS guidance and 1 has issued positive EPS guidance. The percentage of companies issuing negative EPS guidance is 94% (15 out of 16), which is above the 5-year average of 71%. (Factset)
Pension Losses Could Hit Companies Like AT&T and Verizon Hard Late-2018 market plunge could weigh on bottom lines of the telecom giants and others because of how they account for pension plans
These companies and others count gains and losses in their pensions and retiree-benefit plans in the same year that they occur, as opposed to spreading them out over a number of years. They were on track for much of 2018 to get an earnings boost until markets swooned in the fourth quarter.
Now, they may report pension losses that will weigh on their bottom lines, or pension gains will be far lower than would have been expected earlier in the year. In fact, many other companies with defined-benefit plans could see their earnings in 2019 and beyond hit by the markets’ stumbles, pension analysts say, though the effect will be more gradual and harder to notice. (…)
One company already feeling the impact: Ford Motor Co. The auto maker’s fourth-quarter earnings, announced Wednesday, included an $877 million pretax loss from a pension adjustment. The loss was due to “adverse financial market conditions that occurred late in the year,” Chief Financial Officer Bob Shanks said on Ford’s conference call. (…)
Ford uses the same pension-accounting method as Verizon, AT&T and dozens of others: a mark-to-market approach that records changes more immediately than most companies which still “smooth” their plans’ results into earnings over a period of years. That can make companies’ earnings more volatile, but it is simpler and more transparent for investors. (…)
While the impact of the market’s tumble is clearest at mark-to-market companies, ultimately it will affect earnings at many others with defined-benefit plans. Plans whose assets declined in value in 2018 because of the market slump could see that show up in their 2019 pension costs, which are counted as part of overall earnings. (…)
TECHNICALS WATCH
Lowry’s Research analysis of the longer-term trends in Supply and Demand through its Selling Pressure and Buying Power Indexes “confirm that the rally over the past month has been based on a strong expansion in Demand and contraction in Supply, a relationship that has historically been associated with primary market uptrends.”
Lowry’s also says that “it’s clear there has been a powerful expansion in breadth during the market’s month long rally” reaching all three market segments with large cap the primary beneficiary.
The State of the Union Is Missing America loses something worthwhile as Trump and Pelosi cast aside another traditional norm.
(…) As to its other purposes, the speech is a moment of enacted majesty. Not real majesty—real majesty would be Jackie Kennedy walking behind the caisson and behind her a street full of kings. But it’s a night when our democracy struts its stuff. The president, Congress, the Supreme Court, the cabinet, the diplomatic corps, the military, the press in the gallery, all arrayed. The heroes in the balcony, reminding us not of our politics but of our humanity, of the fact that almost against the odds America keeps producing spectacular individuals. All are there acting out comity, dignity, stature. I don’t really care if they feel these things. No one cares. We just want them to show it because children are watching, or at least taking a look as they pass a screen, and learning how adults in public act. (…)
Too bad there are 364 other days when children are watching and learning how adults in public act…