U.S. Tariff Threat Could Scuttle Trade Talks With China The White House’s surprise decision to move forward with tariffs and other sanctions against China threatens to derail trade talks scheduled for this weekend.
(…) The Trump administration sent a sudden, harsh message to Beijing Tuesday, saying the U.S. is moving forward with its threat to apply tariffs on Chinese imports and restrict China’s access to sensitive U.S. technology.
This startled many observers as well as officials in Beijing, as the White House had for days trumpeted the outlines of an agreement for both sides to put such measures on hold while negotiators—led on the U.S. side by Treasury Secretary Steven Mnuchin—worked on a deal to narrow the $375 billion annual trade gap by increasing Chinese purchases of U.S. goods.
With Mr. Ross scheduled to head to Beijing later this week, the administration’s latest tack could give the U.S. added leverage as the trade talks with China resume, U.S.-China experts say. (…)
But the tactic isn’t being received well in the Chinese capital, and Beijing wasted little time claiming the moral high ground in the trade conflict. A strongly worded article from the official Xinhua News Agency early Wednesday said the Trump administration’s “flip-flopping” is hurting U.S. “national credibility.” (…)
Mr. Zarit [chairman of the American Chamber of Commerce in China] added that rising trade tensions have affected its member companies, forcing them to reconsider their supply chains against the possibility that materials and products they use are hit by tariffs.
-
China vows to protect its interests from ‘reckless’ U.S. trade threats
-
Wilbur Ross rebuffs EU demands for tariff exemptions Hopes fade in Brussels that full carve out from punitive tariffs can be secured
-
Trade war risk stalks global economic upturn: OECD
-
China exporters see slowing orders as clouds gather
Chinese exporters reported that business barely improved in May from the previous month’s weak showing, with slowing order growth and flat export prices offsetting a slight pick-up in volumes and profits. (…) The FTCR New Orders Index fell 1.8 points to a 10-month-low of 50.3. (…)
BTW, did you miss EXPORTS’ IMPORT
-
As Trump Talks Tough on Trade, Worries Mount Over Lack of Action Deals come up short of initial rhetoric; administration says it is making ‘terrific progress’
(…) It might be a negotiating tactic—make strong demands to win future concessions—or else the administration lacks plans to follow through. Either way, the development has become clear to a growing number of observers.
“The pattern has been: A lot of sound and fury, threats to withdraw from agreements and negotiate the best ever deal, and then in reality something a lot less,” said Matthew Goodman, senior adviser for Asian economics at the Center for Strategic and International Studies. (…)

BTW: Manufacturers and consumers are hurt by this development far more than any gains we may see in steel production employment.(The Daily Shot)

-
Canada Would Rather Have No Nafta Than a Bad Deal, Trudeau Says
Canada ‘very ready’ to fire back if U.S. imposes steel tariffs, Freeland says
-
Trump’s auto tariff plan threatens GM’s $7 billion South Korea rescue
A Worrying Turn Ahead for Auto Loans Auto loan delinquencies are too high considering the strong economy
(…) Credit-card loans that are more than 90 days delinquent rose to 8% of total balances in the first quarter from 7.5% a year earlier, according to Fed data. The portion of delinquent auto loans rose to 4.3% from 3.8%.
Although the volume of auto-loan originations has slowed, terms remain loose. The average length of a new loan rose to 69.2 months in April compared with 65.5 months in April of 2013, according to Edmunds.com. A flood of cars coming off leases also has pushed down used-car prices. In April used-car prices fell 1.6% from a year earlier, the biggest decline since March of 2009, according to Labor Department inflation data. (…)
-
Banks Hunting Growth Loosen Terms on Business Loans Regulators raise red flags as rising interest rates may make it harder for businesses to pay off loans
(…) While the rate of bad business loans remains very low and most banks still have a moderate risk appetite, the regulator said that over the past year it privately issued more warnings ordering financial institutions to modify their business-lending practices. (…)
They are extending interest-only periods, allowing borrowers to draw down bigger portions of the value of collateral and relaxing covenants meant to protect from losses, the agency said. Many large banks are also lowering rates over their cost of funds, according to the Federal Reserve. (…)
In 2016, nonbank lender Encina Business Credit started operating with a business strategy of making asset-based loans to distressed companies that banks shied away from. Bill Kearney, senior managing director at the firm, said in the past year banks are increasingly outbidding Encina and other nonbank lenders on loans to struggling retailers. (…)
The rate at which banks lend to each other for three months has been rising much faster than the rate at which they lend for one month, pushing the gap in April between the two to its widest since 2009. The three-month U.S. dollar London interbank offered rate has climbed 0.62 percentage point this year to 2.32%, while the one-month counterpart has climbed a comparably meager 0.41 point to 1.98%.
Accordingly, more than half of junk-rated corporate loans recently had interest payments tied to one-month Libor, up from less than a quarter at the beginning of 2016, according to data tracked by Wells Fargo & Co. on about $500 billion of loans. The share of loans tied to three-month Libor has been dwindling.

Bank of Canada Seen on Hold Amid Trade Uncertainty, Housing Slowdown


(…) Goldman expects that stronger-than-forecast first quarter growth and rising inflationary pressures will spur the BOC to resume hiking, after policy makers tapped the brakes following three rate increases in five meetings through January. The next hike will come at the bank’s July meeting, Goldman predicts. (…)
Morgan Stanley, meanwhile, expects Poloz to keep policy dovish and allow Canada’s economy to “run hot” to boost growth and inflation. The nation’s sensitivity to declining global liquidity and risk sentiment because of dependence on portfolio inflows to fund its current account deficit will also undermine the loonie, strategists led by Hans Redeker wrote in the firm’s global FX mid-year outlook this month. (…)

Why Canada’s Big Banks Aren’t Too Worried About Household Debt
(…) While unprecedented debt levels pose risks, they say there won’t be any major upset to the economy for a number of reasons, including the view Bank of Canada Governor Stephen Poloz won’t press ahead with higher rates if signs of stress begin to emerge. (…)
Germany’s business expectations (blue) are rapidly diverging from current conditions (gray)
 (via The Daily Shot)
EMERGING SUBMERGING
Indonesia Raises Interest Rates Again to Stem a Slide in Its Currency
Indonesia’s central bank raised its benchmark interest rate for the second time in two weeks, the latest attempt by policy makers in an emerging market to tame the effects of a stronger dollar. (…)
“This is a preemptive, front-loading and ahead-of-the curve policy response” in anticipation of more interest rate increases by the U.S. Federal Reserve and “risks in the global financial market,” Mr. Warjiyo said. He left open the possibility of more “measured” rate increases, if needed. (…)
The rupiah has depreciated 3% against the dollar so far this year, despite Bank Indonesia spending billions of dollars to curb that slide. The currency fell as much as 4.5% for the year at its low last week, according to Thomson Reuters data. (…)
Non-resident investors held 38.4% of Indonesian government bonds at the end of April, considered a high level, according to ANZ.
Foreign investors yanked a net $4.5 billion out of Indonesia’s stock and bond markets between February and April, ANZ data said.


SENTIMENT WATCH
Italy’s Astonishing Bond Reaction Tests Global Markets Tuesday’s Italian bond selloff was astonishing. Short-dated bonds that can usually be treated as a close proxy for cash turned toxic, and bondholders showed serious panic.
(…) Italian 2-year bonds had by far their worst day since at least 1989, when Thomson Reuters data starts. The yield leapt more than 1.5 percentage points to 2.4% at the close of European hours, with more selling later. (…)
The country is the third-biggest borrower in the world, with €2 trillion ($2.33 trillion) of bonds and bills outstanding. Much of its debt is domestically owned, but the sheer size of Italy’s debt pile means a default would be catastrophic both for its own and Europe’s banks. It would also create political fractures that could threaten the European Union, ironic for an organization founded by the Treaty of Rome. (…)
As one hedge-fund manager shorting Italian bonds put it, there has been a “buyer’s strike” because foreigners were unwilling to buy, while domestic investors were scaling back holdings. (…)


This was a preview of how liquidity can suddenly disappear on both bonds and stocks…even more so when the central bank has been the sole buyer for a while…
-
U.S. Debt Load Seen Worse Than Italy’s by 2023, IMF Predicts
-
David Rosenberg: Trumponomics will cause the next recession – and soon. Here is why: https://goo.gl/itEhGv
-
Investors Bet $4 Billion on a Cryptocurrency Startup Start-up company block.one is on track to raise $4 billion through a yearlong sale of digital tokens—the largest fundraising of its kind—even as investors still don’t know how the company will use the windfall.
(…) That a little known startup could raise so much money without a concrete plan for it speaks to trends in the topsy-turvy world of cryptocurrencies and views of the future of the online world. (…)
EOS and its rivals think they can beat Ethereum to mass adoption by creating systems that aren’t as decentralized, and so can process more transactions per second. Essentially, they are trying to occupy a space between Ethereum and Android. (…)
Yet block.one isn’t clear about how exactly it will spend the proceeds. The company plans to build a platform for hosting web applications; the first live version is set to be released in June. There’s a twist, though: The company doesn’t plan to develop the software after releasing it. It hopes to see others do that and has said it won’t operate any public network built upon the EOS software.
To that end, block.one has pledged to invest more than $1 billion in startups building on EOS. It hasn’t said, though, what it will do with the remainder of the funds.
Block.one is expanding. Its website lists eight jobs for software engineers in Blacksburg, Va., where the company’s chief technology officer, Dan Larimer, lives and works. The company also recently hired a new general counsel, former Bank of New York Mellon lawyer Lee Schneider, and a new chief financial officer, Rob Jesudason, who was CFO of Commonwealth Bank of Australia.
Both report to Brendan Blumer, the company’s 31-year-old, Hong Kong-based CEO. (…)
To steer clear of regulators, the firm blocked investors in the U.S. and China, though some used technical workarounds to get in on the action. Based on those sales, which are visible through digital wallets, it appears the company will raise more than $4 billion.
EARNINGS WATCH
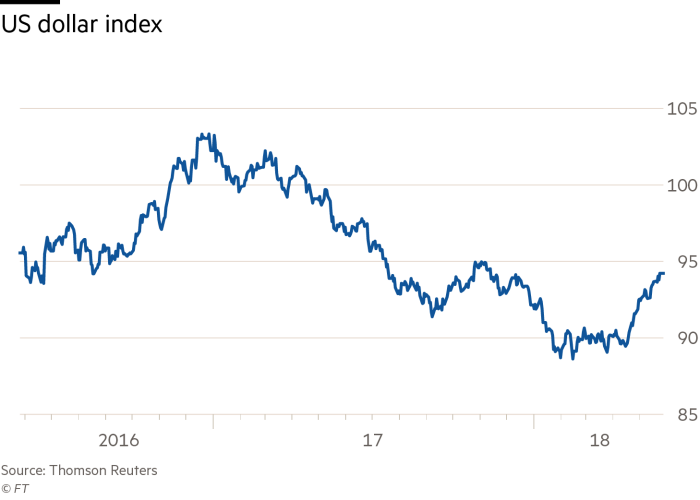
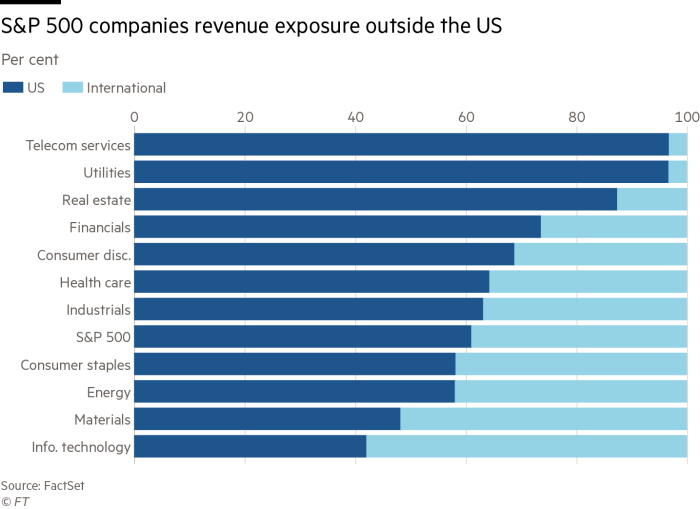
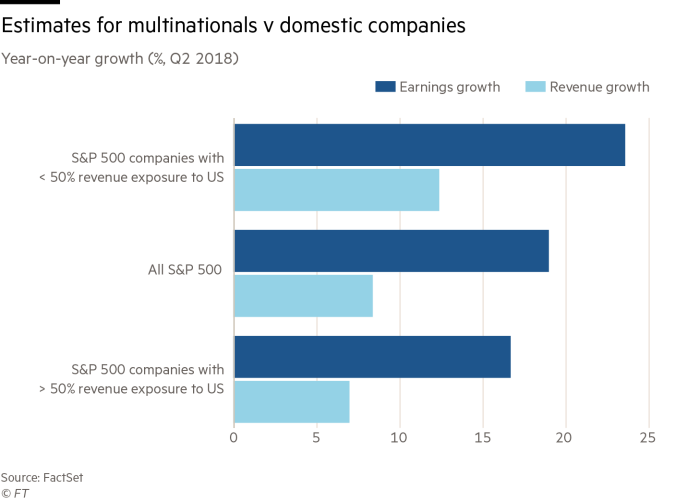
Stronger dollar poses challenge for US blue-chips Currency strength seen hurting foreign revenues for multinational companies
(…) According to David Lefkowitz, senior equity strategist at UBS Global Wealth Management, the back of the envelope calculation indicates that a 10 per cent change in the dollar spurs a 2 per cent shift in S&P 500 earnings. (…)
To be carefully watched:

BTW:
A Chick-fil-A is paying $18 an hour to retain fast-food workers
By 2022, the minimum wage in California will rise to $15. But the owner of a Chick-fil-A restaurant in Sacramento plans to go ahead and raise the wages of his employees now, offering a huge bump to $17 to $18 from the $12 to $13 he pays now. (…)
TECHNICALS WATCH
Yesterday’s “sell-off was primarily a large-cap affair, as the DJIA and S&P 500 lost 1.58% and 1.16%, respectively, while the S&P Mid Cap and Small Cap Indexes were lower by just 0.39% and 0.04%, respectively. In addition, Buying Power lost 4 points while Selling Pressure gained just 1 point, suggesting today”s market drop was due more to a withdrawal in Demand than to expanding Supply. In addition, today”s Down Volume was 74% of total Up/Down Volume, well short of the 90% threshold.” (Lowry’s)
But we are back into the wedge, on rising volume:

 J Capital launched this very interesting website: China Ghost Cities
Some of J Capital’s research reports can be found from time to time in the library.
![Image_thumb[1]](https://i0.wp.com/www.edgeandodds.com/wp-content/uploads/2018/05/Image_thumb1.jpg?ssl=1 "Image_thumb[1]")
 The CPB World Trade Index is still up 5% YoY but new export orders rapidly falling near the 50 neutral level is worrisome. The latest World Trade Outlook Indicator released on May 17 is at 101.8, only slightly above the baseline value of 100 and below the previous value of 102.3, which
 ![image_thumb[3]](https://i0.wp.com/www.edgeandodds.com/wp-content/uploads/2018/05/image_thumb3.png?ssl=1 "image_thumb[3]")
![image_thumb[5]](https://i0.wp.com/www.edgeandodds.com/wp-content/uploads/2018/05/image_thumb5-1.png?ssl=1 "image_thumb[5]")
![image_thumb[15]](https://i0.wp.com/www.edgeandodds.com/wp-content/uploads/2018/05/image_thumb15.png?ssl=1 "image_thumb[15]")


