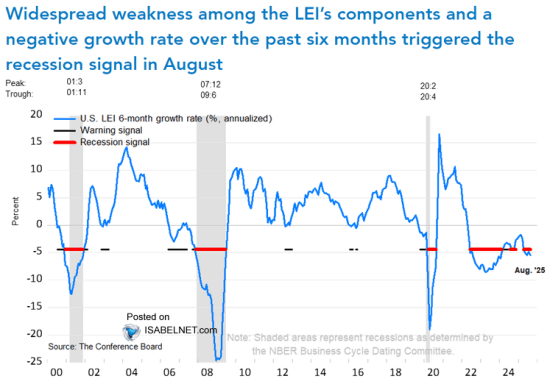
U.S. Leading Economic Indicators Weaken Again
The Conference Board’s Composite Index of Leading Economic Indicators eased 0.1% (+0.4% y/y) during September following a 0.2% August decline, revised from no change. (…) Performance amongst the components of the Leading Indicator index was mixed last month. Contributing negatively to index change were the readings for ISM new orders, building permits, the yield spread between 10-year Treasuries & Fed Funds and consumer expectations for business/ economic conditions. Offsetting these declines were initial claims for jobless insurance, stock prices and the leading credit index. The average workweek was unchanged.
Three-month growth in the leading index of 0.4% (AR) remained below the high of 9.1% in December 2017. The y/y change also weakened to 0.4%.
The Index of Coincident Economic Indicators held steady (1.5% y/y) during September following an unrevised 0.3% August gain. (…) Three-month growth in the coincident index fell to 1.1% (AR) from 2.3% in August.
The Index of Lagging Economic Indicators improved 0.1% (3.2% y/y) last month following a 0.4% decline during August, revised from -0.3%. (…) Three-month growth in the lagging index declined to 1.9%, down from 4.5% growth as of July.
The ratio of coincident-to-lagging economic indicators is sometimes considered a leading indicator of economic activity. It was little changed versus August and higher than the July low.
The LEI has been trending poorly lately, up only 0.2% in the last 6 months, 0.1% in the last 3 and down in each of the last 2 months totalling –0.3%.
From @ScottMinerd, Global Chief Investment Officer of @GuggenheimPtnrs
Sept. decline in Leading Economic Indicators (LEI) plus Aug -0.2% revision sets stage for possible negative print next month. Every US #recession has been preceded by 3 negative mos of LEI. A necessary condition, not sufficient but 4 negative prints will seal the deal. Be warned!
Bespoke confirms Markit’s more accurate Manufacturing PMI:
ISM Offsides, If Not Utterly Incorrect
This week’s manufacturing activity releases from the New York Fed and Philly Fed showed a slightly weaker but generally upbeat assessment of economic activity. The numbers from these two regional surveys may not be fully representative of the aggregate national economy, but they’re usually a pretty good indicator. As shown in the chart below, they’ve been a decent guide to what the ISM Manufacturing index says about national activity since the Empire State manufacturing index started its releases in 2001.
Unlike these two indices, which have shown a general uptick in activity over the last few months, the ISM index shows a different route. But that data isn’t backed up by the average results across the five Fed districts that survey their manufacturers. The size and scale of the divergence is so big that one of these indices is almost certainly wrong, but which?
For a tiebreaker, Markit’s manufacturing survey suggests conditions are at multi-month highs and picking up, more consistent with the data from Fed surveys than ISM. Markit’s sample size is bigger and the index is more representative of the whole sector than ISM only; with all five regional Fed surveys in the mix, they also have a sample size advantage over ISM. Hard data of late (including manufacturing production, exports, and hiring) has all sided against ISM and is showing data more consistent with the Five Fed or Markit surveys. For now, it looks like the brutal ISM results are a bit overstated.

China’s Liu Confirms Phase One of U.S. Trade Deal is in Progress
(…) “China and the U.S. have made substantial progress in many aspects, and laid an important foundation for a phase one agreement,†Vice Premier Liu He said at a technology conference in Nanchang, Jiangxi, on Saturday. He reiterated that China is “willing to work in concert with the U.S. to address each other’s core concerns on the basis of equality and mutual respect.†(…)
Matthews Asia’s Andy Rothman is among the optimists. He also offers some interesting stats:
STEPPING BACK FROM THE BRINK?
(…) Trump’s enthusiastic comments leave me optimistic that a formal deal can be concluded next month. Stating that the two sides had already “come to a deal on intellectual property, financial services,†as well as “a tremendous deal for the farmers,†Trump said, “I have very little doubt that we’ll be able to get this thing finalized now. It’s not overly complex.â€
The president remarked “there was a lot of friction between the United States and China. And now, it’s a lovefest.†He also provided some domestic political cover for Xi, describing the deal as “fantastic for China†as well as “fantastic for the United States.â€
I remain convinced that both sides are highly motivated to conclude a deal. Trump appears to recognize that a deal is better than no deal for his re-election prospects. No deal would mean continued taxes on Chinese goods, paid for by American families and businesses. No deal would mean a continued Chinese boycott of American soybeans, which is contributing to harsh conditions for farmers in politically important states. No deal would mean continued economic uncertainty, which is leading to weaker corporate CapEx and worries about a recession.
The tariffs are not a huge problem for Xi, as China is no longer an export-led economy, but failure to conclude a deal would open up the risk that a trade war leads to restrictions on China’s access to American tech, everything from semiconductors to research collaboration. That would be a significant setback to China’s economic growth, which Xi wants to avoid.
(…) the dollar value of retail sales in China was equal to 91% of U.S. retail sales last year, up from 36% a decade earlier. But real retail sales rose 6.4% YoY during the first nine months of this year, compared to 1.6% in the U.S. (…)
Over the last five years, the real growth rate of retail sales in China slowed by an average of 0.9 percentage points each year, and during the first three quarters of this year, the growth rate also slowed by 0.9 percentage points, compared to the same period in 2018.
This year and in 2018, sharply weaker auto sales—due to structural issues, including the removal of subsidies that brought forward demand in earlier years—contributed significantly to slower growth in overall retail sales.
Excluding autos, nominal retail sales rose 9.1% during the first nine months of this year, compared to 10.4% during the same period last year and 11% in 2017. (…)
Here is another perspective: household consumption—a metric which includes services as well as goods—rose 9.9% YoY in 3Q19, up from 7.3% in 1Q19 and 8% a year ago. This acceleration reflects the rising share of consumer spending on services, as well as the strength of spending on services, including education and travel. (Spending on education, culture and recreation is up 14% this year, for example.) Services now account for 51% of household consumption, up from 40% in 2008.
This consumer story has been fueled by phenomenal income growth. Real income rose 5.8% YoY during 3Q19, a bit slower than 6.3% a year ago. Over the last decade, real income rose 120% in China, compared to a 17% increase in the U.S.
A key driver of income growth has been the rise of entrepreneurs. There were no privately owned firms in China when I first worked there in 1984, but now 87% of urban employment is by small, private companies.
And I think the consumer story is sustainable, in part because Chinese households still save about 27% of their disposable income, compared to an 8% savings rate in the U.S. (…)
In my view, the impact of the tariff dispute on the Chinese economy has been modest. A bigger contributor to slower growth has been the Chinese ongoing campaign to reduce risks in the financial system, which has led to a sharp crackdown in off-balance sheet, or shadow credit, which declined 7.9% YoY in September. This has reduced systemic risks, but it has also meant that the firms that relied on non-standard credit sources, especially small private companies, have struggled (even more than usual) to get access to credit.
It is a positive sign that Beijing has not responded to slower growth by allowing a resurgence of shadow credit. (…)
Aggregate credit outstanding rose 10.9% YoY last month, the same pace as in August and slightly lower than 11.2% a year ago. Credit isn’t tight—it is rising faster than nominal GDP growth—but there is no sign of significant stimulus. This leaves room for stimulus should growth slow more sharply if the trade dispute worsens.
Beijing also has room to cut rates if needed. During 1H19, the weighted average lending rate was 5.7%. (…)
-
Cooling Economy Drives China to Prioritize Growth After years of trying to stem rising debt, China’s policy emphasis seems to be back on headline GDP
(…) Beijing is taking steps to give banks more leeway to lend, prodding local authorities to borrow to fund big-ticket infrastructure projects like high-speed railways, and allowing the country’s currency, the yuan, to depreciate to counter trade challenges from the U.S.
In the last few years, China’s government has signaled it was de-emphasizing the GDP’s pace, in favor of an emphasis on what officials called the quality of growth. The priority was containing debt. But authorities are now indicating that the headline growth rate is important again. (…)
The problem is that after China’s building binge in the past few decades, it is harder than ever to come up with projects that make economic sense and would meet regulatory requirements, according to ANZ economist Betty Wang, who notes officials are unwilling to stake their political careers on projects that may face a backlash. (…)
SENTIMENT, TECHNICALS WATCH
Investors have been spooked by last year’s 18.7% correction (!!) and recent volatility. Will we see a repeat of 2016-2017?
-
 Lowry’s Research says that “the forces of Supply and Demand suggest the market is consolidating its gains from the Dec. 24, 2018 and June 4, 2019 lows through this sideways trading rather than forming a significant topping pattern. Thus, the probabilities are this period of consolidation will be resolved to the upside through a rally that carries to new all-time highs. (…) Historically, breadth tends to lead price in moving to new highs. Thus, if precedent holds, the new highs in the various Adv-Dec Lines reinforce the probabilities the market’s current sideways movement will be followed by a rally that carries the major price indexes to new highs in the months ahead.â€
Lowry’s Research says that “the forces of Supply and Demand suggest the market is consolidating its gains from the Dec. 24, 2018 and June 4, 2019 lows through this sideways trading rather than forming a significant topping pattern. Thus, the probabilities are this period of consolidation will be resolved to the upside through a rally that carries to new all-time highs. (…) Historically, breadth tends to lead price in moving to new highs. Thus, if precedent holds, the new highs in the various Adv-Dec Lines reinforce the probabilities the market’s current sideways movement will be followed by a rally that carries the major price indexes to new highs in the months ahead.†-
If You’re Not Long, You’re Wrong
By Frank Holmes, CEO and Chief Investment Officer, U.S. Global Investors
The reason for my bullishness is simple: Bad news is good news. Policymakers and heads of states see the threat of a slowdown and are more likely to enact stimulus measures to prevent a full-blown recession. This is especially the case in nations with upcoming federal elections—the biggest one being the U.S. presidential election.
President Donald Trump is under pressure from a series of House investigations, not to mention an impeachment inquiry that’s near guaranteed to result in official articles of impeachment. Be that as it may, Trump is the only U.S. president that I’m aware of who sees the market as a barometer of his policies’ success. Every morning, after he wakes up and coifs his hair in the mirror, he wonders what his administration can do to drive stocks higher. We’ve already seen aggressive corporate tax cuts and a wave of deregulation, and we may expect to see more as Trump seeks reelection. So even though you may not like the man’s governing style or his Twitter activity, he always has investors’ interests in mind.
Friday saw the highest equity put volume since August 2011. As a % of NYSE volume, it was the highest since February 2009. Bullish or bearish?
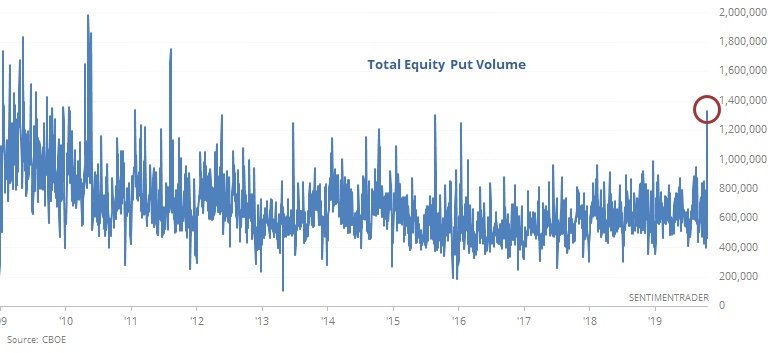
As recent weeks pass it seems the investor sentiment measures are increasingly indicating an investor that is becoming more bearish even as the market continues to trend higher this year. The current investment environment seems like one where the market is climbing the proverbial “wall of worry.” A case in point is the spike on Friday in the CBOE Equity Put/Call ratio to .99. This is the highest level since the Equity Put/Call ratio reached 1.13 on December 21, 2018, Historically, readings above 1.0 have been associated with levels where the market is near a point where it turns higher. This potential set up to a move higher is on top of the 21% gain achieved year to date.

-
 Participation Problem
Among all common stocks trading on the NYSE, fewer than 50% of them have moved above their 200-day averages. For a time when the S&P had climbed to within 1% of a former high, this is an abnormally low figure. On average, 63% of NYSE stocks are in bull markets when the S&P nears an old high. (…)
Better returns came when participation was not at an extreme, when between 50% – 70% of NYSE were in bull markets as the S&P approached a prior high. That could still happen in the days ahead if a bunch of stocks suddenly move above their 200-day average. As it stands, it looks to be a modest, but inconsistent, negative. (Sentimentrader)

- Lowry’s argues that “much of this drop in the percentage of New Highs can be attributed to a rotation in market leadership, as buying has moved away from momentum stocks towards stocks that have been market laggards. (…) much of the improvement in the Small Cap percentage has occurred over the past seven weeks, largely concurrent with the rotation among market leaders. Relative to their Sept. 5 levels, (…) the percentage of OCO Small Cap stocks near their highs has climbed, from 7.75% to 11.51%, suggesting an increased focus on small cap stocks. Since small caps are typically among the weakest performers prior to and during the formation of a major market top, recent strength in this segment also suggests the market’s sideways movement should be resolved through a breakout rally to new highs.â€
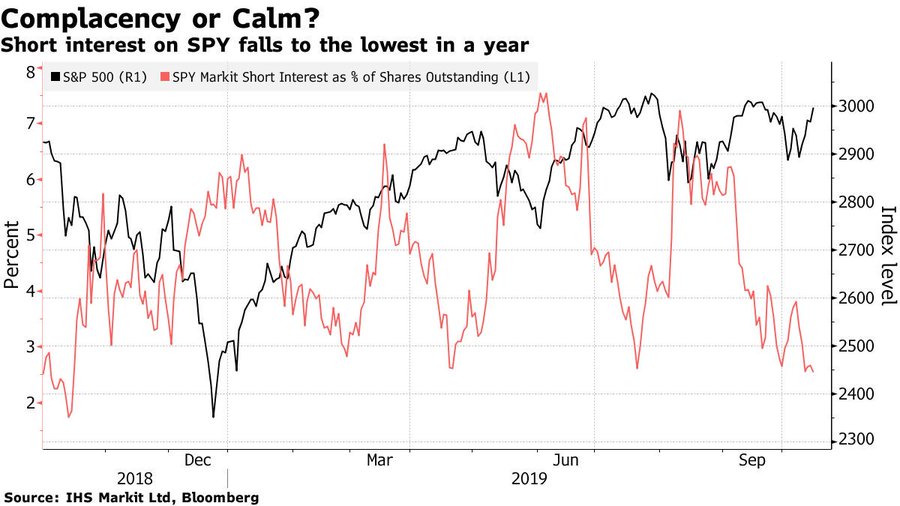
- Lastly, short interest is at a low:
![]()
![]() But watch the fundamentals. Valuations are high when earnings are weak. And the equity-market-watcher-in-chief is embroiled with a
But watch the fundamentals. Valuations are high when earnings are weak. And the equity-market-watcher-in-chief is embroiled with a ![]() Congress, a huge foreign policy mistake in the Middle-East, a not-so-easy-to-win trade war with China and an economy hanging on the consumer nails, one year away from the elections. So, while “after he wakes up and coifs his hair in the mirror, he wonders what his administration can do to drive stocks higherâ€, he may come short of answers…other than to eventually sign something, anything, with President Xi.
Congress, a huge foreign policy mistake in the Middle-East, a not-so-easy-to-win trade war with China and an economy hanging on the consumer nails, one year away from the elections. So, while “after he wakes up and coifs his hair in the mirror, he wonders what his administration can do to drive stocks higherâ€, he may come short of answers…other than to eventually sign something, anything, with President Xi.
EARNINGS WATCH
The facts from Refinitiv/IBES:
Through Oct. 18, 73 companies in the S&P 500 Index have reported earnings for Q3 2019. Of these companies, 83.6% reported earnings above analyst expectations and 4.3% reported earnings below analyst expectations. In a typical quarter (since 1994), 65% of companies beat estimates and 20% miss estimates. Over the past four quarters, 74% of companies beat the estimates and 18% missed estimates.
In aggregate, companies are reporting earnings that are 4.3% above estimates, which compares to a long-term (since 1994) average surprise factor of 3.3% and the average surprise factor over the prior four quarters of 5.3%.
Of these companies, 61.6% reported revenues above analyst expectations and 38.4% reported revenues below analyst expectations. In a typical quarter (since 2002), 60% of companies beat estimates and 40% miss estimates. Over the past four quarters, 59% of companies beat the estimates and 41% missed estimates.
In aggregate, companies are reporting revenues that are 1.0% above estimates, which compares to a long-term (since 2002) average surprise factor of 1.5% and the average surprise factor over the prior four quarters of 0.9%.
The estimated earnings growth rate for the S&P 500 for 19Q3 is -3.1%. If the energy sector is excluded, the growth rate improves to -0.6%.
The estimated revenue growth rate for the S&P 500 for 19Q3 is 3.1%. If the energy sector is excluded, the growth rate improves to 4.3%.
![]() Actual earnings growth for the 73 companies having reported is –0.9% on revenue growth of +2.9%.
Actual earnings growth for the 73 companies having reported is –0.9% on revenue growth of +2.9%.
By comparison, after 79 reports during Q2, the beat rate was 77%, the surprise factor +5.3% and the blended growth rate +1.0%, up from +0.3% on July 1. Actual earnings growth for the 79 companies having reported was +9.0% on revenue growth of +2.8%.
In effect, in spite of a strong beat rate and a decent surprise factor, earnings growth for the early reporters is negative compared to +9.0% during Q2. Meanwhile, analysts keep revising downward across the board:


The estimated earnings growth rate for the S&P 500 for 19Q3 is -3.1% which is a worsening from the –2.2% estimated on October 1. At the same time last July, estimates for Q2 were improving from +0.3% to +1.0%.
The estimated earnings growth rate for the S&P 500 for 19Q4 is 2.7% (was +4.1% on Oct. 1, +7.2% on July 1). If the energy sector is excluded, the growth rate improves to 5% (5.9%).
In all, this, so far, is not a typical, market lifting earnings season. Earnings from 6 sectors are being revised downward from -6.7% on average on Oct. 1 to -9.3%. Average growth for the other 5 sectors is only being upped from +1.3% to +1.7%.
Trailing EPS are now $162.66, down 0.4% from their level at about the same stage during Q2 and –1.0% from the end of September. Look at the yellow line below: headwinds which, if not reversed, need a strong valuation push to take equities higher.

Still early but not a great earnings season so far. Some of the reasons
Thorough analysis of the impact of tariffs on prices/margins for both importers and exporters from and to China. This is the conclusion:
A rich literature theoretically characterizes the motivations behind enacting tariff policies and the potential implications they carry. Relatively little is known, however, about how economies in practice respond to tariffs, particularly when these trade policies involve large countries that have the potential to influence prices. (…)
We find that tariffs passed-through almost fully to US import prices, implying that much of the tariffs’ incidence rests with the United States. In these same data, we find far lower rates of passthrough from exchange rate shocks into import prices. Furthermore, despite this rapid increase in the total cost of importing goods, we find more mixed evidence regarding retail price increases, which suggests that many US retailers reduced the profit margin on their sales of the affected goods.
Finally, we show how the response of US exporters to foreign retaliatory tariffs was not symmetric to the response of foreign exporters to US import tariffs. Foreign tariffs targeted undifferentiated goods exported by the United States, and US exporters significantly reduced their ex-tariff export prices on these goods, particularly on shipments to China. (…)
We offer some evidence that importers to some extent front-ran the recent changes in trade policy and document clear trade diversion away from China. These non-price margins of adjustment suggest that so far, we may have only seen the short-run response to tariffs.
-
U.S. Companies Can’t Buck a Strong Dollar Currency’s strength likely to weigh on third-quarter earnings; tech sector is most exposed
Third-quarter earnings season has just begun, but at least 16 companies in the S&P 500, including Delta Air Lines Inc., Johnson & Johnson and General Mills Inc., have already blamed a strong currency for denting profits, according to company earnings calls.
That number is likely to grow in the weeks ahead as technology companies, consumer staples and others that get a significant portion of their sales from overseas report.
The WSJ Dollar Index, which tracks the dollar against 16 other currencies, rose to its highest level since 2017 last month. It is up nearly 1% so far this year after rising 4.3% in 2018. (…)
Companies, especially multinationals, have been blaming the dollar for hurting profit margins all year. A stronger dollar generally makes U.S. products less competitive overseas and raises the costs of converting foreign revenue back into local currency. The S&P 500’s technology sector makes more than half its revenue overseas, leaving it most exposed to a burgeoning dollar, followed by materials firms, energy companies and consumer staples. (…)
“It’s a pretty modest driver†of weaker earnings, [UBS] Mr. Lefkowitz said of the dollar. He estimates the dollar will shave about 0.5% from S&P 500 earnings versus the same period a year ago. The impact was bigger earlier this year, erasing 1% from profits in the first and second quarters, he added. (…)
-
Exchange Rates Deal $22.56 Billion Blow to Companies’ Earnings Honeywell, Johnson & Johnson and Philip Morris in recent days reported hits from currency fluctuations
(…) Abbott Laboratories, a manufacturer of health-care products, reported a 4% hit on sales from foreign exchange rates in key emerging markets such as India, Brazil, Russia and China. Johnson & Johnson, meanwhile, reported sales in markets outside the U.S. were 2.8% lower because of currency effects.
Philip Morris’s net revenue was reduced by $115 million because of currency effects in the third quarter, resulting in a foreign-exchange impact of $931 million since the beginning of the year. “Currency is something that is very hard to predict,†Chief Financial Officer Martin King said in an interview Thursday. The company hedges against movements in some currencies, including the Japanese yen, he said.
During the second quarter, North American companies listed on the New York Stock Exchange and Nasdaq recorded currency-related losses of $21.01 billion, down from $23.39 billion in the first quarter, according to Kyriba. Exchange rate-related losses at these companies have exceeded $20 billion for three consecutive quarters.
European companies listed on the FTSE 100 and Euronext reported a decline in foreign-exchange effects to $1.55 billion in the second quarter, down from $3.31 billion in the first quarter of 2019, Kyriba said.
If Kyriba’s numbers are right, currency losses represent 6-7% of quarterly earnings on the S&P 500 Index.
Credit-rating firms raise more alarms about the weakest corporate borrowers
S&P Global Ratings said its list of “weakest link†companies reached a 10-year high in September of 263, the most since November 2009, during the credit crisis when defaults soared to 10.5% globally for speculative-grade companies.
That doesn’t mean defaults in the roughly $1.2. trillion “junk bond†market are now at crisis levels, but it shows that S&P thinks hundreds of companies could flounder if conditions worsen. (…)
“The default rate of weakest links is nearly eight times greater than that of the broader speculative-grade (rated BB+ or lower) segment, and the weakest link tally may signify higher default rates ahead,†a team of S&P analysts led by Nicole Serino wrote.
Moody’s Investors Service on Thursday said that U.S. corporate defaults were still a low 3.2% in September among speculative-grade companies, but warned that downgrades and defaults could swell when the credit cycle turns.
The credit-rating firm isn’t forecasting that to happen in the next 12 months, but said defaults could “easily exceed the last cycle†peak of 14% if conditions deteriorate, largely due to the record volume of B3-rated debt that risks falling into Caa territory. (…)

The search for yield seems to be holding high yield spreads down. Moody’s multi-variable regression model (r-square statistic of 0.89) “now generates an estimated midpoint of 475 basis points for the composite high-yield bond spread. By contrast, the actual high-yield bond spread closed at 432 bp on October 16, which left its October-to-date average at 458 bp.†Moody’s goes a few steps further to warn us:
Of the many readily available macroeconomic variables that might explain the high-yield bond spread, the moving three-month average of the Chicago Fed’s NAI shows the strongest correlation of -0.82 with the high-yield bond spread. (…)
The NAI provides valuable insight regarding both the underlying quality of business activity and the risk of persistently rapid price inflation. On the inflation front, the Chicago Fed notes that a rising risk of an accelerating rate of consumer price inflation has been associated with a moving three-month average for the NAI of at least 0.70 points. (…)
Moody’s Analytics estimates EDF metrics for publicly-held firms. For any issuer, the EDF, or the probability of default within one year, will be greater, the lower is the issuer’s market value of net worth and the higher is the volatility of the market value of the issuer’s business assets. If debt outruns the firm’s market value, the market value of net worth declines.
Moody’s Investors Service’s one-year high-yield default rate for U.S. issuers has been highly correlated with the average one-year EDF for eligible North American high-yield issuers of nine to 12 months earlier. For example, the high-yield default rate’s correlations are 0.88 with the high-yield EDF of nine months earlier and 0.79 with the high-yield EDF of 12 months earlier. (…)


Prospect of President Warren Spooks Energy Investors Of all the market-moving tweets these days, one in particular from Democratic presidential hopeful Sen. Elizabeth Warren is sending shivers through the oil industry.
“On my first day as president, I will sign an executive order that puts a total moratorium on all new fossil fuel leases for drilling offshore and on public lands,†she tweeted on Sept. 6. “And I will ban fracking—everywhere.â€
Outlawing a technique that energy producers use to blast oil and gas from shale formations would require legislation and spur a torrent of opposition from companies, investors and probably even state governments.
Substantial as those hurdles may be, they haven’t stopped analysts from running the numbers for investors and energy executives to see what might happen, if hydraulic fracturing were banned.
They are particularly focused on Ms. Warren’s threat to choke off drilling on federal lands. (…)
Entire oil-field service companies would become obsolete. Pipeline owners would suffer without replenishment, as existing wells peter out. The winners would be Canadian shale drillers and big global operators like Exxon Mobil Corp. and Chevron Corp. , for which higher energy prices would offset losses on U.S. assets. (…)
A spokeswoman for the Warren campaign said that motivating investors to move money from the oil-and-gas business is the aim. (…)
Analysts with Piper Jaffray’s Simmons Energy heard enough about Ms. Warren from money managers recently that they parsed her energy and infrastructure policy proposals in a note sent to clients last week. Though the presidential hopeful’s policies threaten the U.S. oil-and-gas business, they wrote, “her proposals would also result in continued downward impetus for renewable energy’s cost of capital and a likely step-change increase in renewable energy investment and rate of growth.â€
Reuters’ Exclusive: Huawei in early talks with U.S. firms to license 5G platform – Huawei executive
Blacklisted Chinese telecoms equipment giant Huawei is in early-stage talks with some U.S. telecoms companies about licensing its 5G network technology to them, a Huawei executive told Reuters on Friday.
 How TURBINE PANDA and China’s Top Spies Enabled Beijing to Cut Corners on the C919 Passenger Jet
Rarely in the infosec industry do cyber investigators get the luxury of knowing the full scope of their adversary’s campaign—from tasking, to actual operations, all the way to completion. The oft-repeated mantra “Attribution is hard†largely stands true. Short of kicking down the door just as a cyber actor pushes enter, it is frustratingly hard to prove who is responsible for cyber attacks with 100% certainty. However, a series of recent U.S. Department of Justice (DoJ) indictments released over the course of two years, combined with CrowdStrike Intelligence’s own research, has allowed for startling visibility into a facet of China’s shadowy intelligence apparatus.
In this blog, we take a look at how Beijing used a mixture of cyber actors sourced from China’s underground hacking scene, Ministry of State Security (MSS/国安部) officers, company insiders, and state directives to fill key technology and intelligence gaps in a bid to bolster dual-use turbine engines which could be used for both energy generation and to enable its narrow-body twinjet airliner, the C919, to compete against western aerospace firms. What follows is a remarkable tale of traditional espionage, cyber intrusions, and cover-ups, all of which overlap with activity CrowdStrike Intelligence has previously attributed to the China-based adversary TURBINE PANDA. These operations are ultimately traceable back to the MSS Jiangsu Bureau, the likely perpetrators of the infamous 2015 U.S. Office of Personnel Management (OPM) breach. (…)