Food Service and Drinking Places sales are up whopping 10.1% YoY in August and 6.2% YtD compared with +4.0% YtD for Grocery Stores. Bespoke illustrates the longer term trend:
For several years now, we’ve seen Bars and Restaurants increase their share of total sales at the expense of Food and Beverage Stores. As shown in the chart below, though, this shift is on the verge of a major inflection point where Bars and Restaurants will overtake Food and Beverage stores in terms of their total share of retail sales. The house of tomorrow may not have a kitchen!
 (Bespoke)
Here’s the other way to look at the same series but using actual sales in real terms, further highlighting the acceleration in outside eating since 2015 and the huge jump in 2018.
![image_thumb[3]](https://i0.wp.com/www.edgeandodds.com/wp-content/uploads/2018/10/image_thumb3.png?ssl=1 "image_thumb[3]")
Real restaurant sales were up 7.5% YoY in August. While we have seen similar eating-out bursts in the past, they were always against weak trends in grocery stores sales. Not this year. Americans seem to be eating more.
![image_thumb[5]](https://i0.wp.com/www.edgeandodds.com/wp-content/uploads/2018/10/image_thumb5.png?ssl=1 "image_thumb[5]")
Eating-related spending troughed at 21% of total retail sales in 2005-06, down from 27% in the mid-1990s. The Financial Crises brought the ratio to 24% but it has only receded to 23% since. Spending at grocery stores is back to its 11% mid-2000s level but eating-out expenditures, at 12% of total sales, are now far exceeding their levels during the last crisis.
![image_thumb[7]](https://i0.wp.com/www.edgeandodds.com/wp-content/uploads/2018/10/image_thumb7.png?ssl=1 "image_thumb[7]")
From a USDA research published in 2017:
- Millennials spend significantly less time eating at home than do any of the older generations. Specifically, Millennials eat over 13 percent less of their meals at home than Traditionalists, who report the highest percentage of food consumption at home. In terms of meals, Millennials eat 2.8 more meals away from home per week than do Traditionalists (assuming an individual eats 3 meals a day, in a given week).
- Millennials eat in a restaurant or bar around 30 percent more than any of the older generations. With 2.3 percent of meals eaten at a restaurant or bar, this amounts to about one restaurant trip every other week for Millennials and helps to explain lower overall FAH [Food at Home] purchases from Millennials in the IRI data.


No kids, no house. Bars and restaurants. The good old days!! ![]()
![]()
![]()
But it may be wise not to straight-line recent trends:
While Millennials may be delaying parenthood, it’s not for lack of interest in eventually becoming moms and dads. Members of this generation rated being a good parent as a top priority in a 2010 Pew Research Center survey. Some 52% said it was one of the most important goals in their lives, well ahead of having a successful marriage, which 30% said was one of their most important lifetime goals.
Regardless of which generation they belong to, parents say having children is central to their identity. Among Millennials, six-in-ten (60%) said that being a parent is extremely important to their overall identity, according to a 2015 Pew Research Center survey. A similar share of Gen X parents said as much (58%), as did a slightly smaller share (51%) of Baby Boomers with children younger than 18. (Pew Research)
Bloomberg recently ran a story outlining the 14% decline in restaurant meals per capita since 2000 with the bulk of the drop (-11.4%) having occurred since 2009.
Eighty-two percent of American meals are prepared at home — more than were cooked 10 years ago, according to researcher NPD Group Inc. The latest peak in restaurant-going was in 2000, when the average American dined out 216 times a year. That figure fell to 185 for the year ended in February, NPD said.
Don’t be fooled by reports of rising U.S. restaurant sales at big chains like McDonald’s Corp. Increases have been driven by price hikes, not more customers. Traffic for the industry was down 1.1 percent in July, the 29th straight month of declines, according to MillerPulse data.
![1416ec4d-b7d5-4bde-b8fe-56506777f211_thumb[1]](https://i0.wp.com/www.edgeandodds.com/wp-content/uploads/2018/10/1416ec4d-b7d5-4bde-b8fe-56506777f211_thumb1.jpg?ssl=1 "1416ec4d-b7d5-4bde-b8fe-56506777f211_thumb[1]")
Price hikes indeed. Since 2009, inflation at the grocery store totalled 9.1%, significantly less than the 25.5% in Food-away-from-home CPI. Since 2015: –1.2% in Food-at-home vs +9.3% in Food-away-from-home.
![image_thumb[9]](https://i0.wp.com/www.edgeandodds.com/wp-content/uploads/2018/10/image_thumb9.png?ssl=1 "image_thumb[9]")
For obvious reasons, dining out costs more than dining in. But the gap has really exploded since 2015:
![image_thumb[11]](https://i0.wp.com/www.edgeandodds.com/wp-content/uploads/2018/10/image_thumb11.png?ssl=1 "image_thumb[11]")
Not that restaurant inflation has lately sharply accelerated. It has actually been rather stable around 2.5% since 2012. However, grocery store inflation has slowed markedly: YoY, it has not exceeded 1.0% since mid-2015 but overall, grocery store prices are 1.3% lower now than in September 2015:

As a result of these recent unusual trends
- The cost of dining out relative to the cost of eating at home has increased by 10% in recent years. Unsustainable.
- To the extent that CPI-Food at home is a decent proxy for restaurants input costs, gross margins have certainly expanded meaningfully in the last 3 years. Unsustainable.
Add the accelerating cost of labor (availability, churn, training, minimum wages) and the outlook gets even less appetizing.
Maybe during a year of tax cuts, the increased liquidity incites patrons’ indulgence towards restaurant operators having to fight scarce labour and skyrocketing minimum wages. Maybe the stronger economy coupled with 2.5-3.0% restaurant inflation allows improved revenue metrics for this highly discretionary but generally slow growing industry as RBC illustrates:
But for how long?![image_thumb[13]](https://i0.wp.com/www.edgeandodds.com/wp-content/uploads/2018/10/image_thumb13.png?ssl=1 "image_thumb[13]")
Private equity firm Roark Capital won’t eat any of this cautious stuff. On September 25, Roark-controlled Inspire Brands (Arby’s, Buffalo Wings, Rusty Taco) announced that it had agreed to acquire Sonic Corp. in a $2.3 billion deal, adding more than 3,600 locations to its investment menu, giving it a total of about 8,200 locations and make it one of the 10 largest restaurant groups in the U.S. by that measure.
Just a month before, Wendy’s sold its stake in Inspire which will be paying 30 times trailing EPS, 18 times cash flow and 16 times EBITDA, all records for SONC. Also at record levels are Sonic’s margins, thanks in large part to the above mentioned trends and the tax cuts which have more than offset the 16% decline in Sonic’s sales per share since 2008. In fact, Bloomberg reveals that Sonic’s same-store sales have been declining during the last 8 quarters.
EXPENSIVE MENU
The restaurant industry has inspired many other pretty fat deals this year as Grant’s reports:
In August, JAB Holding Co. bought Panera Bread Co. for $7.5 billion, paying 18 times EBITDA. Also In August, Roark Capital’s own Focus Brands affiliate bought Jamba Juice Company for $200 million, or more than 35 times EBITDA. It’s not just PE paying up for restaurants. Last spring, publically-traded (and junk-rated) Restaurant Brands International, Inc. paid $1.8 billion, or more than 21 times EBITDA for Popeye’s Louisiana Kitchen, Inc.
Buying at 16 times EBITDA means accepting a 6.25% return on capital, before meeting such mundane obligations like paying interest on the debt, income taxes and making any minimal reinvestment in the business, among the very first items on any restaurant operator’s to-do list. After these minimal requirements are met, the 30 times P/E returns 3.3% after tax on capital for a restaurant chain already at record net earnings and cash flow margins on declining same-store sales. in an industry with increasingly fragile fundamentals.
According to Statista, the U.S. restaurant population has been growing at twice the rate of the entire population since 2012. Retail sales of “Food Services and Drinking Places” averaged $85,371 per restaurant in 2017, up a nice 20% since 2012 (3.6% annually) but only 11.8% in real terms, equal to 2.2% per year. By comparison, real restaurant sales rose by less than 0.8% per year between 2000 and 2012.
Recall that, since 2015, the cost of dining out has far outgrown the cost of eating at home while apparent gross margins have unusually fatten. Once Americans have swallowed their 2018 tax cuts, the reality will likely sink in. Meanwhile, restaurant operators are scrambling to find and retain employees. The Employment Cost Index for Accommodations and Food Service, which rose at a 1.0% average rate between 2010 and 2014, has been rising 3.2% on average since and 3.5% in the last 12 months, easily outpacing restaurant inflation rate.
CHECK PLEASE
Years of extremely low interest rates are like an all-you-can-eat buffet. At some point, diners realize they ate way too much and must pay the price, which eventually turns out a lot more exacting then initially thought.
Spreads on BBB bonds, the low end of the investment grade scale, are currently near the bottom end of their 1.0-3.0% range.

And junk-rated bonds are selling at a 520 bps spread with BBB bonds, a level rarely and only briefly touched over the last 20 years. Effectively, the hunt for yield has driven investors to the bottom of both the IG and the junk barrels.

But wait, there’s another level, the leveraged loan market…
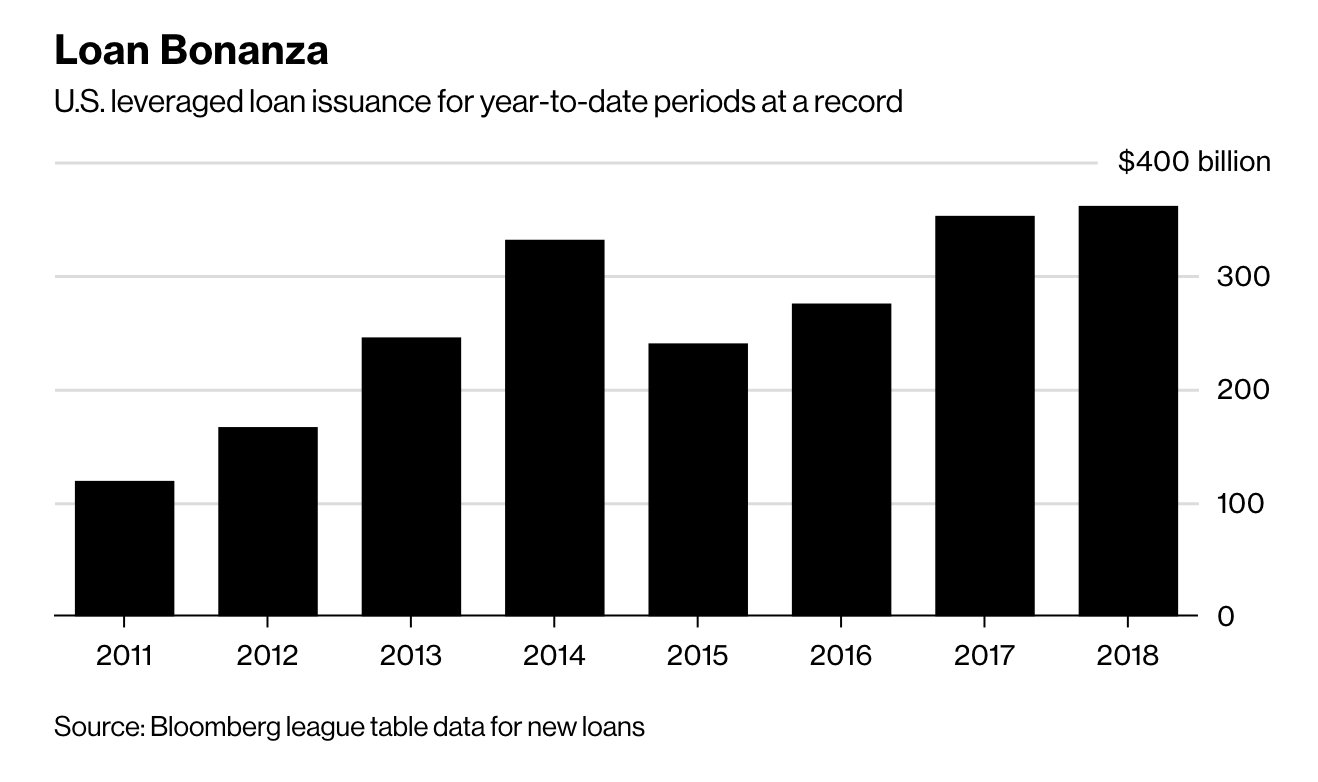
…which fills the buffet table with items lacking basic health protection like adequate levels of debt/ebitda coverage but also less obvious safety nets called loan covenants:
(…) protections for investors in the more than $1 trillion leveraged loan market are weakening too. Looser strictures and safeguards will likely lead to bigger losses for debt investors whenever credit markets start to cool. (…)
“Every week you come in and think they can’t get any looser, but they do,” said Frank Ossino, a senior portfolio manager at Newfleet Asset Management, referring to lenders and the terms on loans. (Bloomberg)
Moody’s Covenant Protection Score shows that only 4% of 2017 covenants were at least Good from 53% when the Financial Crisis was still in everybody’s mind:

Moody’s Loan Covenant Quality Indicator (LCQI) finished 2017 with its weakest yearly score on record, suggesting that leveraged loan investors face significant future risks. Last year was the first in which overall covenant protections had an average covenant quality score higher than 4.00 [range 1.0-5.0 (weakest)], indicating that today’s investors face unprecedented risks from the lack of strong covenant protections. (…)
Vanishing covenant protections expose investors to rising risk as they forfeit traditional means of recourse when a borrower comes under financial stress, adds Hoque. Over the past five years, protections that restrict certain borrower behavior, provide warnings of credit deterioration and trigger enforcement rights have eroded as covenant flexibility has expanded, leaving investors with less covenant protection than at any other time in recent history.
Moody’s says that protections around restricted payments, debt incurrence and financial maintenance covenants are currently among the weakest, driven by incurrence-based carve-outs, increased closing date capacity and the rise of “cov-lite” loans. As overall covenant protections have weakened, covenant-lite issuance reached a new record level, with “cov-lite” loans now accounting for nearly 80% of the leveraged loan market.
But while the upsurge in cov-lite issuance is noteworthy in itself, investors should bear in mind that a lack of financial maintenance covenants is just the “tip of the iceberg,” notes Moody’s. The rating agency’s analysis also reveals that covenant protections have grown steadily weaker in each of the seven main risk categories Moody’s evaluates . (Moody’s)
Part of the reason for the low yield spreads and vanishing protection clauses is that small investors now have access to leveraged loans through ETFs. According to Bloomberg, debt ETFs have exploded to more than $600 billion in the U.S., doubling their assets from just five years ago. Borrowers have quickly realized that this unsophisticated end of the demand side can gobble up just about anything thrown at it. These investors, thinking they are safer using floating rates instruments when the Fed is hiking, are actually getting into a lobster trap: rising rates will make it tougher for borrowers and surprise lenders with little possibilities for the latter to exit unscathed.
Eventually, the music will stop, the buffet will close and the stomach pain will come.
1 thought on “UNAPPETIZING”
Subprime junk food — very tasty!
Comments are closed.