U.S. Retail Spending Fell in March Retail spending fell a seasonally adjusted 1% in March, as American consumers pulled back on purchases of vehicles, furniture, appliances and gasoline amid rising interest rates.
(…) From a year earlier, retail sales increased 2.9% in March, the smallest gain since June 2020, when the economy was emerging from pandemic lockdowns. March’s year-over-year increase was below the 5% rate of inflation. (…)
That’s about all the WSJ had to say on the March retail sales report.
A 2.9% YoY growth rate looks quite low but, considering that goods inflation was 1.5% YoY in March, demand for goods remains healthy. A word of caution, though, both February and March saw declining real sales on a MoM basis following January’s strong showing.

Americans kept going out with a vengeance. Sales at restaurants and bars (the only “services” category item in the report) were up 13.0% YoY in March, substantially stronger than CPI-Food-away-from-home at +8.8%. The consumer is not retrenching just yet.

Data: U.S. Census Bureau; Chart: Tory Lysik/Axios Visuals
In spite of this ominous chart from @IanRHarnett:
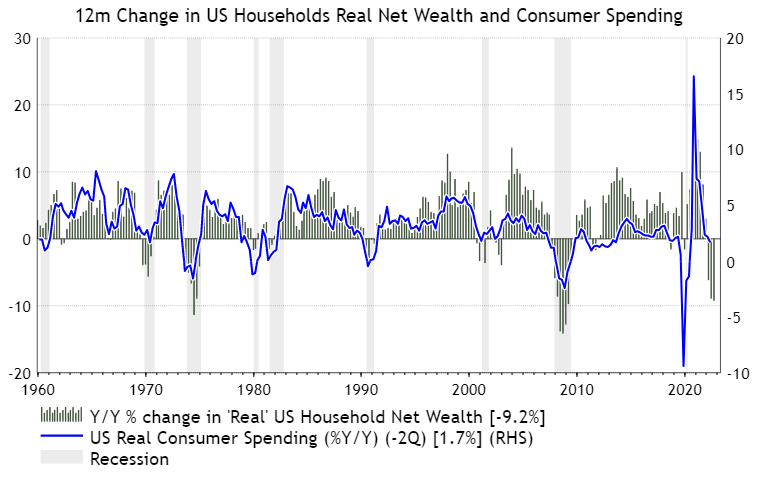
Total consumer spending generally tracks labor income (black) which is still up 6.2% YoY in March.

But BofA consumer deposit data show that after-tax “wages and salaries slowed to 2% on a three-month average basis, down from a peak of 8% in April 2022” with higher-income households bhit particularly hard.


- Accenture Is Delaying New-Hire Starts on Top of Job Cuts The professional-services giant is slowing hiring of recent graduates after slashing 19,000 jobs.
Accenture Plc is delaying start dates for some recent hires as it looks to recalibrate its massive workforce for a more cost-conscious environment. (…)
The delays are the latest blow to the professional-services field, which includes Big Four accounting firms such as KPMG and Deloitte along with blue-chip consultants McKinsey & Co. and Boston Consulting Group. Booming business during the pandemic led to hiring binges, and now the firms have too many consultants chasing too little work. Accenture said last month that it would cut 19,000 jobs — about 2.5% of its workforce — over the next 18 months. (…)
Accenture Chief Executive Officer Julie Sweet said in March that the company, which employed about 738,000 people as of February, is “taking steps to lower our costs in fiscal year 2024 and beyond, while continuing to invest in our business and our people.”
Economists Turn More Pessimistic on Inflation Persistent inflation will keep interest rates elevated and recession risks high, the Journal’s latest survey of economists finds.
On average, economists expect inflation, as measured by the annual increase in the consumer-price index, to end this year at 3.53%, up from 3.1% in the January survey. (…)
With both inflation and interest rates persisting at higher levels than previously expected, economists put the same probability of a recession at some point in the next 12 months at 61%, as they did in January. They expect a recession to be relatively shallow and short-lived, in line with other recent surveys. They see the contraction as likely to begin in the third quarter of this year, later than the consensus in January’s survey, which had put it in the second quarter. (…)
Economists expect stagnant growth this year, forecasting inflation-adjusted gross domestic product to rise just 0.5% in the fourth quarter of 2023 from the fourth quarter of 2022. Growth in 2024 isn’t expected to fare much better, at 1.6%.
For the first time since officials began lifting rates a year ago, Fed staff in March presented a forecast that anticipated a recession would start later this year because of banking-sector turmoil, according to minutes released Wednesday. Previously, the staff had judged a recession was roughly as likely to occur as not this year.
A so-called hard landing—in which high interest rates succeed in lowering inflation but at the cost of a significant rise in unemployment and a recession—hasn’t become more likely in recent months, but it remains the most probable outcome, economists said. Among respondents, 76% said there would be no soft landing, compared with 75% in January. (…)
Yet, the latest CPI data can only be seen as encouraging. The trimmed-mean CPI was +2.8% in March, sharply lower than anything seen in the past 12 months. Both the core CPI and the median CPI were below 5% annualized in March.

Fed Official Backs Higher Interest Rates as Banking Stresses Fade Inflation is still much too high, says Fed governor Christopher Waller
A Federal Reserve official said he was prepared to approve another interest-rate increase because recent banking-system stresses haven’t produced a significant pullback in lending while high inflation remains supported by strong growth. (…)
“All else equal, a significant tightening of credit conditions could obviate the need for some additional monetary policy tightening, but making such a judgment is difficult, especially in real time.”

(NBF)
Bank loans dropped $12.3B during the 2 weeks ended April 17, after -$49B the previous 2 weeks. While not as bad, a $61B decline in bank loans has rarely been seen outside of recessions and the recent pandemic.

EARNINGS WATCH
Bank earnings came in strong last week. We now have 30 reports in, a 93% beat rate and a +12.7% surprise factor. Those 30 companies reported aggregate earnings up 12.2% YoY on revenues up 10.3%.
Trailing EPS are now $217.24. Full year 2023: $219.52e. Forward 12-m EPS: $226.29e.
TIMING
Daniel Lacalle, a Spanish economist and Chief Investment Officer at Tressis Gestión SGIIC tweeted this last week:
The “last hike” used to be negative for stocks, but not anymore, as it usually includes growth in money supply. This time we could have a “last hike” moment… with no money supply growth?
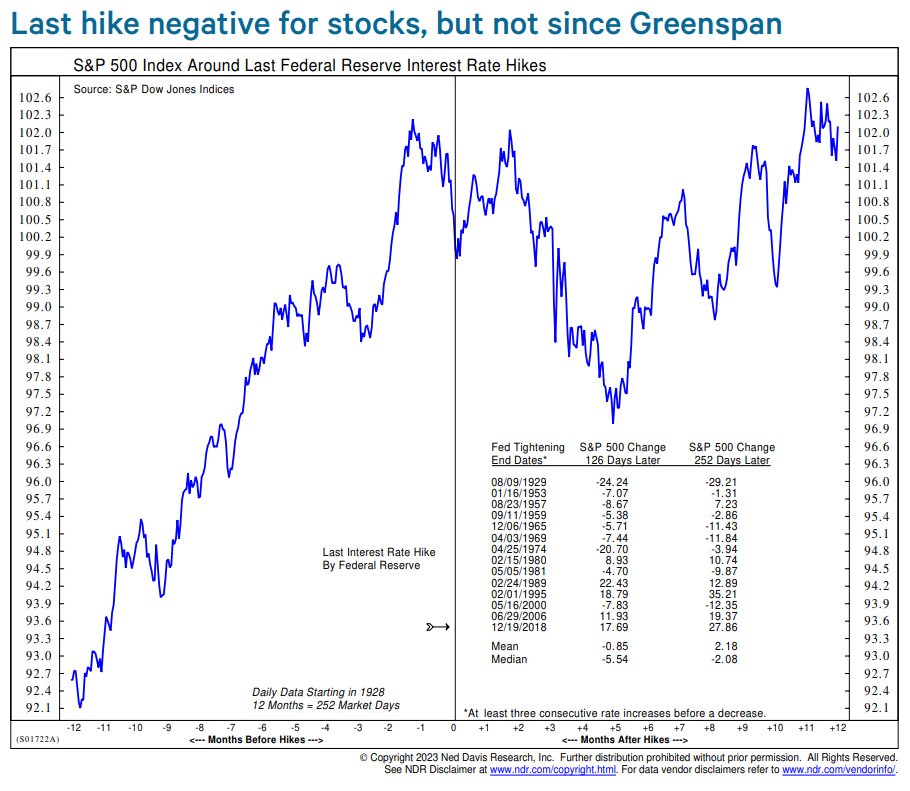
I was a money manager during all of Greenspan’s Fed chairmanship (begun on June 2, 1987 and confirmed by the Senate on August 11, 1987, lasting through January 2006) and I don’t have such fond memories of what his initial easings did to equity markets.
From my EQUITY MARKETS: SEEKING FAIR VALUE piece of Jan. 10, 2023:
While it is true that equities eventually tend to do well after Fed easing episodes, “eventually” is the key word here: most times, the Fed eases for “good” reasons. Equity markets are not always in sync with the FOMC and some lags have been very costly.
I found 15 “Fed changes of posture” since 1957.
- From the first pause to the market low, the S&P 500 troughed 9 months after, on average. But the range is -3 months to +31 months.
- From the first cut to the market low, the S&P 500 troughed 6 months after, on average. But the range is -3 months to +21 months.
Actually, the S&P 500 declined after every Fed cut but five (1966, 1980, 1984, 1989, and 1995). Equities dropped between -4.0% to -47.7% (month end data) with an average of -16.1%. If we exclude 1974 (inflation) and 2001 and 2007 (bubbles), the average is -5.9% (range: 0.0% to -19.9%).
And I found no stable correlation with valuations, inflation and profit trends that could help decide when it might be safe to jump in.
A dovish turning Fed then only tells us to reduce our underweight and get ready to buy more aggressively.
Not long ago, Elliott Wave International poste this chart:
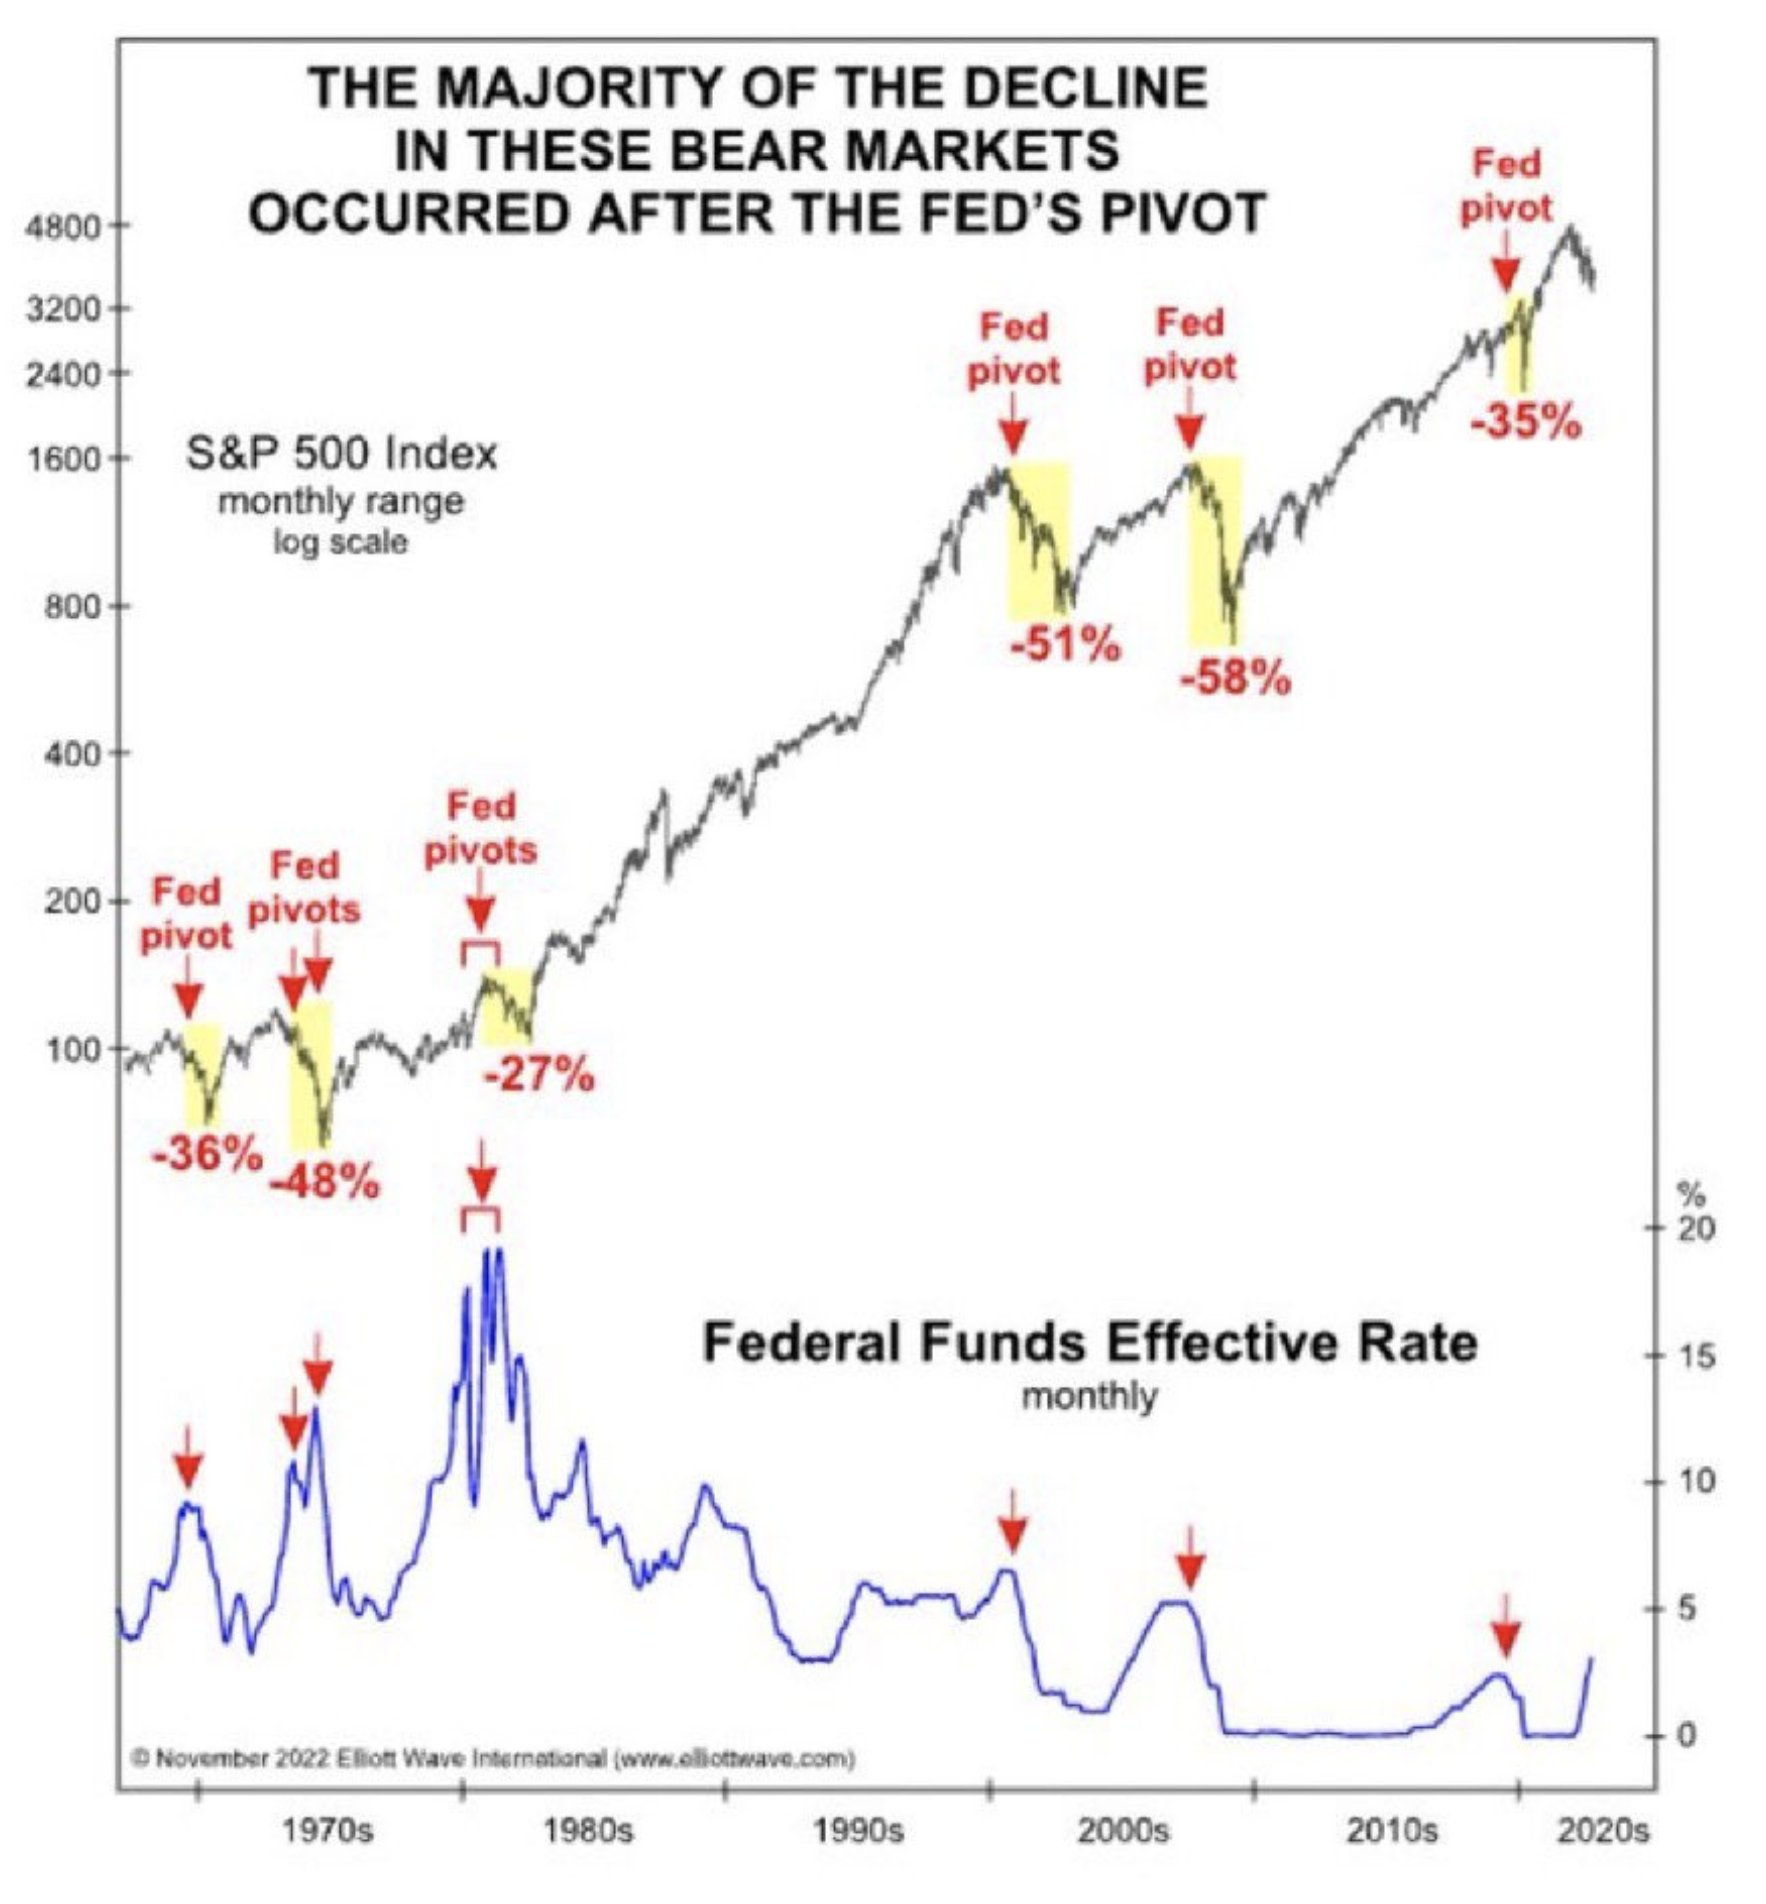
So when you see charts like this one, remember to beware averages.

BlackRock on December 14, 2022:
(…) We analyzed 10 hiking cycles since 1950 to assess when monetary tightening has the biggest impact on growth. The conclusion is that it’s not unusual for the economy to remain relatively strong throughout a Fed hiking cycle, and only later, typically the following two years, does growth begin to weaken materially.
As the chart below illustrates, personal consumption, non-residential investments (think business capital expenditures) and government spending remained well in positive territory as the Fed was raising interest rates. Over time, tighter policy accumulates and growth begins to falter with non-residential business investment and consumption the biggest drivers contributing to a deceleration in GDP. This makes sense – the whole reason the Fed hikes rates is to slow a booming economy and prevent overheating.
Against this prosperous backdrop while the Fed is hiking, businesses and consumers tend to feel confident spending. Ultimately though, the tighter financial conditions slowly trickle into business decision-making and household spending, which often precipitates the pause in hiking.
Contribution to GDP Deceleration
Source: BlackRock, BEA via Haver Analytics as of November 30, 2022
The notable exception to this timeline is residential investment. Again, this is logical – the impact of higher Fed Funds rates is almost immediately passed on to higher mortgage rates, leading to a slowdown even early in a hiking cycle. By the time the Fed pauses, however, most of the damage has been done and activity tends to rebound modestly after a period of restraint. Another caveat is net exports, which have on average been positive after the Fed pauses but this is often due to weakness in imports which is another manifestation of a decelerating domestic economy.
The bottom line is that monetary policy has long and variable lags and even if the Fed stops hiking early next year it will take time for the full impact to be felt. Thus, 2023 may likely be the year that the long-awaited growth slowdown unfolds. (…)

In today’s WSJ:
- Fed Pause Wouldn’t Necessarily Refresh Stock Market Faltering earnings growth and high valuations are factors that could undercut stocks’ tendency to rise after rates peak.
Stocks have historically rallied after the Federal Reserve has finished raising interest rates. Markets might not get the same boost this time around, some investors and analysts warn.
Going back to 1982, the S&P 500 returned an average of 19% in the 12 months after the federal-funds rate peaked, according to a Goldman Sachs team led by chief U.S. equity strategist David Kostin. Goldman studied six Fed tightening cycles over that time period. Stocks rose after all but one of them.
Yet Goldman is skeptical markets will rally again once the Fed is done with its current set of interest-rate increases. (…)
Earnings growth has faltered. S&P 500 companies are expected to report profits declining at the start of the year by the biggest amount since the second quarter of 2020. Stocks also look expensive relative to history. The S&P 500 trades at about 18 times its next 12 months of expected earnings. That ranks in the 81st percentile for valuations going back the past 40 years, according to Goldman. (…)
So far, markets have appeared to shrug off the possibility of a downturn. The S&P 500 has risen 7.8% for the year, while the Dow Jones Industrial Average has gained 2.2% and the Nasdaq Composite has climbed 16%. (…)
“I think investors often make mistakes by trying to overanalyze and overpredict market cycles…when they begin, when they end,” said Darrell Cronk, president of Wells Fargo Investment Institute. “Probably more important than predicting is positioning.”
Is Recession Already Behind Us? Some indicators imply that a recession happened months ago.
From Fidelity Investment:
The National Bureau of Economic Research (NBER) hasn’t officially called a recession, but signs suggest that we may have already had a fairly bad one. One of the most consistent recession indicators has been a contraction in real wages (adjusted for inflation), which happened in every recession since 1962 except the 2020 COVID shutdown.
Real wages declined throughout 2022—falling more than they did during the Great Recession—as inflation outpaced wage growth. Real wage growth may have bottomed last fall; a rebound could provide a tailwind for the economy and the stock market.
The 2022 contraction in real wages is on par with past “hard landing” recessions: 1970, 1980, 1982, 1990, and 2008. In those recessions, stocks started recovering around the same time that real wages hit bottom. The S&P 500 appeared to be following this pattern through January. By contrast, in “soft-landing” recessions (1967, 1995, 2011), stocks maintained an upward trajectory as the market looked beyond the trough in real wage growth.
The past year also looks recessionary based on inflation-adjusted gross domestic product (GDP). In previous recessions, the stock market typically started to recover before real GDP growth bottomed. (Since 1960, the only exception occurred in 2001 and 2002, as the market worked off excessive valuations.) Twelve month real GDP growth dropped below 1% in the fourth quarter of 2022, a level consistent with real GDP growth around the start of many recessionary stock market recoveries. (…)


TECHNICALS WATCH
- 13-w EVA trend:

- Moving averages crossing and rising:

I was a client of the late Marty Zweig but I must admit I have never seen this indicator:
- Zweig Breadth Thrust: Another constructive price-based signal. This signal is basically generated when you get a sharp lift in the proportion of stocks going up vs down from previous suppressed levels. Going only back to 1950 it has a perfect track-record on a 12-month forward returns window.

Source: @RyanDetrick (via Callum Thomas)
Another new one thanks to Callum Thomas:
- Markets in Turmoil? Good. Another intriguing bullish signal with an impeccable track record — whenever CNBC runs a “Markets in Turmoil“ Special, it’s basically been buying time. Pretty much your classic contrarian signal: ‘be greedy when others are fearful’ and all that.

Source: @charliebilello
 Moderna, Merck Show Progress Toward Cancer Vaccines An mRNA shot helped prevent relapse in high-risk melanoma patients.
 The Graphic Truth: No country for old men
US life expectancy has declined two years in a row, meaning that babies born today are expected to live about 2.5 years less than those born in 2019, according to the CDC. Americans on average will now kick the bucket at 76, the lowest age in the 21st century — and more than six years earlier than the rest of the G-7.
The biggest contributor to Americans’ shortening life spans is drug overdoses, especially from fentanyl. The pandemic — and the mental health crisis that ran alongside it — is also to blame. The US saw more COVID deaths than other G-7 nations, while fatalities from suicide and alcohol-induced liver failure skyrocketed. Many of these deaths were of young people, which has a compounded effect on the national average.
While COVID took a toll on life expectancy across the G-7, all but the US rebounded after the first year. The US knocked off a whopping 1.3 years in life expectancy between 2019 and 2020 and has continued to slide. The speed of America’s decline marks the biggest two-year drop in life expectancy since 1921.
US life expectancy to the G-7 average (minus America) since 2000
A chart comparing life expectancy in the US with the rest of the G-7 countries. Credit: Luisa Vieira
