Note: I will be away this week. Posting may, or may not happen.
HOUSING
U.S. housing starts fell 1.4% in December to a 1.382 million annualized unit rate on top of the 1.8% drop in November. Free falling.
Single-family starts rose 11.3% to 909k units a.r. after three months of slippage but are -25% YoY.
Building permits are down 1.6% in December and off for three straight months to a 1.33 million-unit level (annualized). Permits are off 30% YoY.
Single-family permits are -6.5% MoM in December.
Multi family was +1.0% MoM and +25% YoY to the highest level on record (926k). Completions are +26% YoY.
The single-family market is in a rather unusual situation: generally, permits (green), starts (black) and completions (red) fluctuate in a tightly similar fashion. When sales (yellow) turn down, permits and starts naturally drop faster than completions until sales recover and begin matching units under construction (blue), restarting the cycle.
Currently, builders are still trying to complete their strong 2020-21 sales with limited manpower so that units under construction are well above (+30%) sales levels, something that never happens, even during recessions.
This means that construction employment is holding up in spite of the sales drop, but not for long, unless sales turn back up quickly.
The good news, so to speak, is that sales have stabilized around 600k since last spring, the 2017-18 level.
The not-so-good news is that mortgage rates were then between 4.0% and 4.8% and the median new house price was in the low $300k, some $170k below current levels.
The multi-family end is in a similar situation with units under construction above 900k while permits and starts are down in the 500k range, about 10% above their pre-pandemic levels.

The next chart gives an overview of the multi-family housing cycle, from permits (black) to starts (red) to under construction (teal) and to completed units (blue). Note the unusually large number of units under construction (926k, 40% of the total) while permits and starts are declining.

Here’s a complete picture of the housing industry’s cycle. The 2008-09 cycle was an extended one after the previous bubble but housing cycles typically are V shaped.

Construction employment, 5% of total jobs, typically flattens or declines before a recession. It has been rising relentlessly since last spring as the labor shortage extends construction times.
Amazingly, total housing units under construction are 41% above February 2020 while construction employees are up only 2%. The winding down will take time for these well-paid workers, contributing to the softer cycle so far.

Last Friday, we learned that existing home sales declined 1.5% to a seasonally adjusted annualized rate of 4.02 million units in December, above consensus expectations for a 3.4% decline. December home sales declined for both single-family units (-1.1%) and condos and co-ops (-4.5%).
The median sales price of all existing homes decreased 0.3% month-over-month, corresponding to a YoY rate of +2.3%, and are now cumulatively down 4.3% from the May peak.
Note from these CalculatedRisk charts how current sales of 4M annualized homes are done from 1.2M offered while the same number of sales in 2008-09 were from 3.7M homes offered. Prices can’t collapse in such an imbalanced market.


(…) An affordability index released earlier this month by the NAR, based on home prices, median family incomes and prevailing mortgage rates, rose to 95.5 in November from a multidecade low of 91.3 hit in October. (Lower values indicate lower affordability.) For comparison’s sake, over the 12 months before the Covid crisis struck, it averaged 162.
A back-of-the-envelope calculation—assuming family incomes continued to grow at their recent pace, that the median home price is unchanged from December and a mortgage rate of 6.15%—suggests the NAR index for January would register about 106. One way for it to get back to its prepandemic level 162 would be for the average mortgage rate to fall to about 2.6%. Another would be for prices to fall by about a third. Yet another would be for family incomes to increase by about 50%.
Now, homes probably don’t have to get quite as affordable as they were right before the pandemic for the housing market to mount a recovery—affordability measures were historically quite high then. Housing supply in the U.S. remains limited, and that provides some support for the market. Plus, there are a great many Americans who are now entering the prime age for home buying, with United Nations figures showing that as of 2021 the largest U.S. five-year U.S. population cohort was aged 30 to 34, and the second largest was aged 25 to 29. (…)
KKR’s analysis of the U.S. housing market concludes that
even with higher mortgage rates, home prices continue to benefit from a fundamentally constructive backdrop related to demographic-driven demand amidst a chronic undersupply of housing. Specifically, Millennials – the largest generation of Americans – are entering first time home-buying age at a time when the supply of existing single-family homes for sale remain near all-time lows.
In act, the cumulative gap between new households formed compared to new housing starts since 2009 is on the order of 2.1 million, and the supply of existing homes is being constrained both by higher mortgage rates and by increased longevity of existing homeowners. As a result, while we do think that U.S. home prices will experience low single-digit year-over-year declines in coming years, housing wealth should still settle close to or above 2019 levels, providing a key support to consumer confidence and spending.

With 1.7 million of housing units currently under construction, the most ever (1.4M in 2006, 1.6M in 1973), some of the gap will close this year, although 65% will come from the rental market.
Chinese ‘Revenge Spending’ Might Not Hit U.S. Levels Built-up savings will substantially boost China’s growth in 2023, but the nation might not fully replicate the U.S.’s postpandemic consumer boom.
(…) First and most important, Beijing never handed households big stimulus checks the way Uncle Sam did; Chinese household savings rose over the course of the pandemic, but much less precipitously than in the U.S. Moreover, the value of most households’ biggest asset—housing—has taken a substantial hit over the past two years. Several key pillars of China’s labor market—exports, the internet technology sector and the housing market—still face structural or cyclical headwinds. And finally, financial conditions remain relatively tight: Overall credit growth in December was weak, and bond yields and money-market rates have risen in recent weeks.
All of this means that while Chinese “revenge spending” will give a jolt to the economy this year, those expecting a U.S. 2021-style consumption bacchanalia might be disappointed.
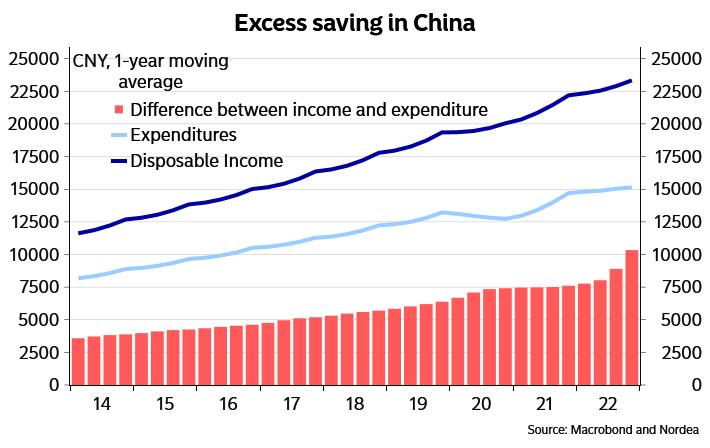
On a per capita basis, Chinese households saved about 33% of their disposable income in 2022, according to data from CEIC, up from an already high 30% in 2019. And personal deposits rose a full 17% in 2022 according to ratings agency Fitch—although some of that rise probably represents proceeds from the sale of other riskier assets like stocks, rather than new savings. (…)


Source: Citi Private Bank via The Daily Shot Source: Gavekal Research via The Daily Shot
- Household have accumulated excess savings – but to a limited extend (Nordea)
- From the Peterson Institute
Can China revive growth through private consumption?
(…) Until the COVID situation stabilizes and people feel free to move about again, consumer confidence and household expectations on jobs and income will remain weak. Moreover, given households have parked much of their savings in less liquid assets like time deposits with longer maturity in order to gain higher returns on those savings, they cannot draw upon much of their savings for consumption right away. Household consumption will likely recover only gradually.
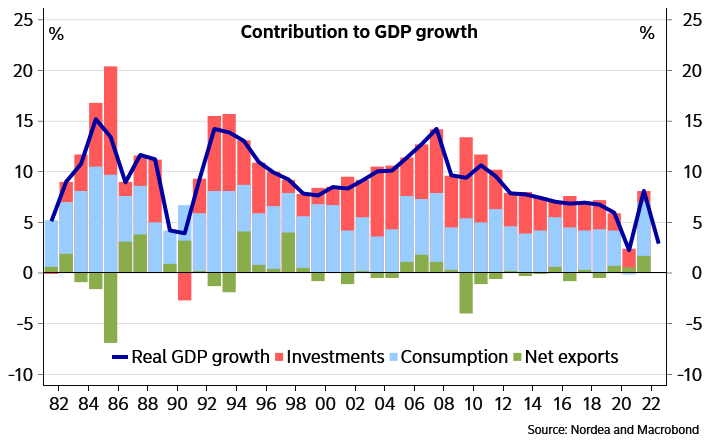
(…) In an environment of slumping investment and industrial production, uncertain export prospects, and declining property values, consumption is vital for economic growth. But the pace of household consumption growth has been slow in recent years. Private consumption has accounted for less than 40 percent of GDP in recent years, a sharp decline from levels during the first two decades of economic reform in the 1980s and 1990s and well below the level of 60 percent or more in most Organization for Economic Cooperation and Development (OECD) economies. (…)
Surveys suggest that consumer appetite for spending remains weak. According to a survey conducted by the People’s Bank of China (PBOC), in the fourth quarter of 2022, only one-fifth of depositors said they would consume more, and more than 60 percent were in favor of even more savings deposits.
The PBOC survey also shows households’ expectations on income and jobs further worsened in the last quarter of 2022, with nearly 90 percent of respondents seeing their income stagnate or drop and more than 90 percent observing a worsening job market. All this suggests that a rapid rebound in consumer spending in the immediate term is unlikely.
Over the long term, a transition back towards a consumption-led growth model will require expanding household disposable income and further strengthening of the social safety net. Ending zero-COVID lockdowns, which drove millions of workers out of the labor force, will boost incomes. Social programs still cover too few people with only modest benefits and should be expanded.
In essence, China needs to spend more on its people if it wants its people to spend more. But none of these changes can be accomplished in the near term, suggesting that increased consumption—and its contribution to China’s economic recovery—will be modest.


China’s Global Mega-Projects Are Falling Apart Many of China’s Belt and Road infrastructure projects are plagued with construction flaws, including a giant hydropower plant in Ecuador, adding more costs to a program criticized for leading countries deeper into debt
(…) During the past decade, China handed out a trillion dollars in international loans as part of Beijing’s Belt and Road initiative, intended to develop economic trade and expand China’s influence across Asia, Africa and Latin America. Those loans made Beijing the largest government lender to the developing world by far, with its loans totaling nearly as much as those of all other governments combined, according to the World Bank. (…)
Now, low-quality construction on some of the projects risks crippling key infrastructure and saddling nations with even more costs for years to come as they try to remedy problems. (…)
Chinese construction companies often bid for government projects or directly approach local officials with projects with a promise that they can easily arrange financing packages from Chinese banks and insurers.
That, developing-country officials say, has given Chinese companies a leg up, because it means governments eager to build a new dam or road don’t have to drum up their own funding. In Africa, more than 60% of the revenue major international contractors collected in 2019 went to Chinese companies, according to a 2021 paper by the China-Africa Research Initiative at Johns Hopkins University. (…)
Many Chinese projects fulfill real development needs, especially in countries that struggle to get other financing to build necessary infrastructure. In Argentina’s poor, northern province of Jujuy, PowerChina built the Cauchari solar park, South America’s biggest solar project. At more than 13,000 feet above sea level, it is able to power some 160,000 homes, according to Argentina’s government. In Brazil, China’s State Grid built one of the world’s longest transmission lines, connecting the Belo Monte dam in the northeast to southern cities some 1,550 miles away. (…)
EARNINGS WATCH
From Refinitiv/IBES:
Through Jan. 20, 55 companies in the S&P 500 Index have reported earnings for Q4 2022. Of these companies, 63.6% reported earnings above analyst expectations and 32.7% reported earnings below analyst expectations. In a typical quarter (since 1994), 66% of companies beat estimates and 20% miss estimates. Over the past four quarters, 76% of companies beat the estimates and 21% missed estimates.
In aggregate, companies are reporting earnings that are 2.3% above estimates, which compares to a long-term (since 1994) average surprise factor of 4.1% and the average surprise factor over the prior four quarters of 5.3%.
Of these companies, 67.3% reported revenue above analyst expectations and 32.7% reported revenue below analyst expectations. In a typical quarter (since 2002), 62% of companies beat estimates and 38% miss estimates. Over the past four quarters, 73% of companies beat the estimates and 27% missed estimates.
In aggregate, companies are reporting revenues that are 0.3% above estimates, which compares to a long-term (since 2002) average surprise factor of 1.3% and the average surprise factor over the prior four quarters of 2.5%.
The estimated earnings growth rate for the S&P 500 for 22Q4 is -2.9% [-2.9% on Jan. 6]. If the energy sector is excluded, the growth rate declines to -7.3% [-6.7%].
The estimated revenue growth rate for the S&P 500 for 22Q4 is 4.1% [4.1%]. If the energy sector is excluded, the growth rate declines to 3.3% [3.3%].
The estimated earnings growth rate for the S&P 500 for 23Q1 is 0.1% [+1.0%]. If the energy sector is excluded, the growth rate declines to -1.7% [-1.1%].
The 55 companies that have reported show aggregate earnings down 6.1% on a 7.1% revenue gain.


Trailing EPS are $221.71. Forward EPS: $226.23e. Full year 2023: $227.19e.
TECHNICALS WATCH
S&P 500 Large Cap Index – 13/34–Week EMA Trend (CMG Wealth)


![]()
![]()
![]() Dating giant Match Group is bumping up its most expensive subscription level on dating app Hinge to $60 a month, or $720 a year. That price point nearly doubles the current highest membership tier of $35 a month, as the company seeks “highly motivated daters” that are hoping to increase their chances of finding the one. (Chartr)
Dating giant Match Group is bumping up its most expensive subscription level on dating app Hinge to $60 a month, or $720 a year. That price point nearly doubles the current highest membership tier of $35 a month, as the company seeks “highly motivated daters” that are hoping to increase their chances of finding the one. (Chartr)
Must be another supply shortage problem!