U.S. New Home Sales Picked Up in June
Purchases of newly built single-family homes increased 7% from the prior month to a seasonally adjusted annual rate of 646,000 in June, the Commerce Department said Wednesday. The increase follows two straight months of declines. (…) Sales in May were revised down to a seasonally adjusted annual rate of 604,000 from an initial estimate of 626,000. (…)
Wednesday’s report showed new home sales falling in the Northeast and the Midwest, where they fell to the lowest level since September 2015. But sales rose strongly in the West in June after slumping in May. Sales in the South were roughly on par with the previous month.
Based on these Haver Analytics charts, there are 3 basic trends in the U.S. new housing market: A steadily rising South, a volatile sideways West and declining demand elsewhere. The bottom chart plots existing home sales, 90% of the housing market:


US growth has diverged from the rest of the world. Is it sustainable?
The Daily Shot uses this Morgan Stanley chart to set the stage for the coming U.S. GDP report:

Source: Morgan Stanley Research
Since 2005, each time there was a divergence, one way or the other, growth lines eventually reconnected. Odds are that U.S. growth will decline. One, it’s already at unsustainable levels considering the fundamentals of employment and productivity, unless the latter really surprises on the upside. Two, recent data do point to a meaningful slowdown coming soon:
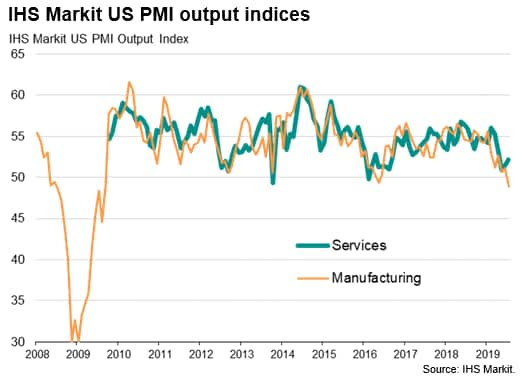
- Flash PMI survey data indicated that the US economy started the third quarter on a disappointingly soft footing. At 51.6 in July, the seasonally adjusted IHS Markit Flash US Composite PMI Output Index edged up from 51.5 in June and remained higher than the three-year low recorded during May, but still signalled only a modest expansion of private sector output. The PMI surveys for manufacturing and services collectively point to annualised GDP growth of just 1.6%, up only very marginally from a lacklustre 1.5% indicated by the survey in the second quarter.

The July survey found evidence of firms becoming increasingly cautious in relation to hiring amid an increasingly uncertain outlook. Future prospects have darkened to the gloomiest since comparable data were first available in 2012, according to the latest survey, suggesting that companies may look to tighten their belts further in coming months, dampening spending, investment and jobs growth. Geopolitical worries, trade wars and increasingly widespread expectations of slower economic growth at home and internationally have all pulled business optimism lower.
The weak trends in manufacturing are well documented and known. The question is whether Services will be dragged further down by the very weak manufacturing activity:
Yesterday’s Markit Flash PMI report revealed that
Growth of business activity was supported by price discounting in July, with average charges reduced to the greatest extent since February 2016. Business expectations for the next 12 months dropped sharply across the service sector in July. Moreover, the latest reading was the lowest since this index began in October 2009.
U.S. growth will likely weaken but Europe seems set to keep weakening even more:
A big question also remains as to how long the service sector can sustain strong growth in the absence of an expanding manufacturing sector. July saw a widening divergence between the manufacturing and service sectors to the largest since April 2009.

How would a sane betting man set the odds? Manufacturing surging back up?
German business people have placed their chips on the red square:
In July, the Ifo index dropped for the tenth time in the last eleven months since August last year. At 95.7, from 97.4 in June, the Ifo index stands at its lowest level since late-2012. Both the current assessment and expectation components dropped significantly. (ING)
The FT sums it up: German manufacturing companies report industry ‘in freefall’
From Markit’s Flash German PMI:
After rising in June, overall inflows of new business returned to contraction at the start of the third quarter, falling for the fifth time in the past seven months. The main drag was from manufacturing order books, which fell at the fastest rate since April amid reports of lower export sales (in particular to China) and weakness in the automotive sector. July’s decrease in factory export orders was in fact the sharpest seen in over a decade. With services firms also reporting reduced inflows of new orders from abroad, total new export business was down for an eleventh straight month in July.
The lack of incoming new work was reflected in a further decrease in outstanding business across Germany’s private sector. Backlogs fell in manufacturing at the fastest rate since June 2009 and barely rose across the service sector, resulting in the quickest overall decline in more than six years.
Five Reasons to Oppose the Budget Deal
By 2029, federal debt would be 97% of GDP, from 78% currently and higher than the 92% projected under the current law.

EARNINGS WATCH
We now have 138 reports in, a beat rate of 78% on earnings (64% on revenues) and an earnings surprise factor of +5.1%. The blended growth rate for Q2 is now –0.1%. It was +0.3% on July 1st.
The 138 companies having reported have aggregate earnings up 8.7% on revenues up 3.8%, meaning that the rest of the season is expected to mainly feature declining profits unless beats continue at a high rate.
At the same time during Q1’19, the 129 companies that had reported had aggregate earnings up 6.0% on revenues up 4.1%. For the full quarter, earnings ended up 1.6% on revenues up 5.7%.
Trailing EPS were $163.44 on July 24. With inflation at 2.1% and the S&P 500 at 3000, the Rule of 20 P/E reached 20.51. The Rule of 20 Fair Value is now 2925, down from 2952 at the end of June. If the Rule of 20 Fair Value remains below 2952 at the end of the month, it will be the first drop since September 2018.
![]() These new valuation metrics have triggered a change in the Rule of 20 Strategy: cash has been raised from 10% to 30% at 3000 on the S&P 500 Index.
These new valuation metrics have triggered a change in the Rule of 20 Strategy: cash has been raised from 10% to 30% at 3000 on the S&P 500 Index.
GAPS IN GAAP
The WSJ about Facebook’s results:
The tech giant earned $16.9 billion in revenue, up 28% from a year ago. The company posted $2.6 billion in profit, or $0.91 a share, reflecting a one-time $2 billion charge as part of its $5 billion settlement with the Federal Trade Commission announced earlier on Wednesday, and an accounting change regarding tax deductions for stock-based compensation. Without those two charges, the company would have earned $1.99 a share, beating analysts’ expectations of $1.88.
Europe is expected to charge FB with a $1.6B fine for breaching privacy laws.
Mark Mahaney of RBC Capital Markets “said it is possible that continued regulatory scrutiny will impact the business, but the risk seems manageable. Google has annually paid $2 billion to $3 billion to regulators, he noted. “For Facebook, I won’t treat it as a recurring expense until it becomes one.”
In Mahaney’s 11 page report on FB’s recent results, there was perhaps 2 lines on the fines.
Apart from the fact that there is something truly extraordinary in just about everybody only noting in passing that a company was sentenced to pay $5 BILLION in fine, investors and earnings aggregators have to deal with these new significant charges. Recurring or not, operating or not?
Analysts adds to the confusion. Goldman Sachs:
Excluding the $2bn accrual for the FTC settlement ($3bn was accrued in 1Q19), GAAP operating margin was 39.2%, which was above the Street’s forecast of 37.8%. Also, excluding the accrual for the settlement as well as the $1.1bn one-time tax expense related to the developments in Altera Corp. v Commissioner, GAAP EPS was $1.99, which compares to consensus of $1.88. Including the fine and the one-time tax item, EPS was $0.91.
Can somebody explain what are GAAP earnings exactly? GS seems to introduce a GAAP operating earnings measure I was not aware existed…
It will be interesting, and confusing, to see how the various aggregators and strategists deal with what could well become recurring non-recurring costs.
FYI, total S&P 500 earnings will be around $340B in Q2 and $1.4T in 2019.
SENTIMENT WATCH
The Investor’s Intelligence survey of newsletter writers now has a Bull Ratio in the top 5% of all readings in the past 30 years. Such high readings led to poor 1-year returns, with the S&P averaging only 2.3%. Excluding the super-momentum years of 2013 and 2017, that dropped to -1.3%, with risk of -10.9%. (SentimenTrader)
 (yardeni.com)
- NDR Crowd Sentiment Poll: Extreme Optimism (S/T Bearish for Equities). The current weekly sentiment reading is 67.6. It was 69 last week. (CMG Wealth)
 Source: Ned Davis Research
U.S. Warns of Dealing With Iranian Airlines The U.S. alleged that many Iranian airlines help support Iran in regional violence by transporting fighters and weapons to international locations
Entities that provide services for designated Iranian airlines, including financing, reservations and ticketing as well as procurement of aircraft parts, could be at risk of enforcement actions or economic sanctions from the U.S., the Treasury Department said in an advisory. (…)